

 PDF
PDF ePub
ePub Citation
 Print
Print


INTRODUCTION
MATERIALS AND METHODS
Patients
Data collection
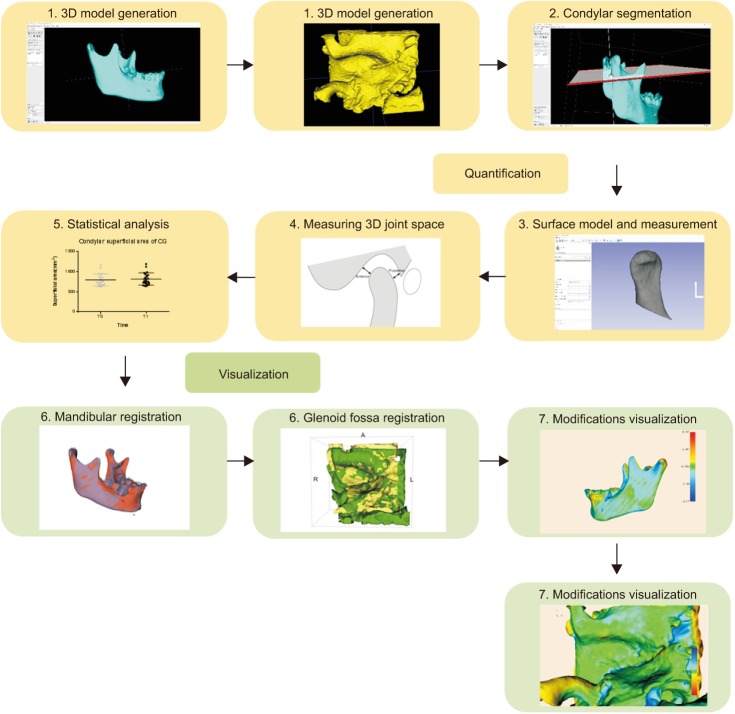 | Figure 1Technical route of the experiment. 1, Construction of the three-dimensional (3D) segmentations of the mandible and glenoid fossa. 2, Performing condylar segmentation. 3, Generating the surface model and performing volumetric measurements of the condyle. 4, Measuring the joint space by using 3D landmarks. 5, Performing the statistical analysis. 6, Registering the condyle-fossa based on the voxels. 7, Visualization of condyle-fossa modifications using the distance color-coded map.
|
Quantitative evaluation of temporomandibular joint changes
Qualitative assessment of temporomandibular joint changes
Statistical analysis
Table 1
The reliability of measurements
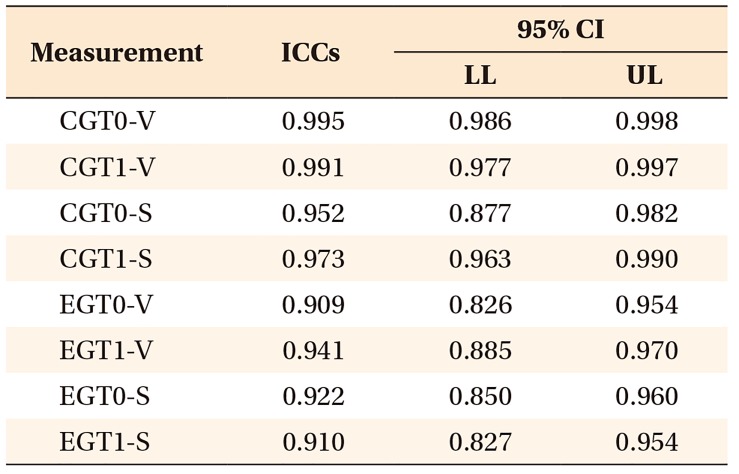
The measurements show great repeatability.
ICCs, Intraclass correlation coefficients; CI, confidence interval; LL, lower limit; UL, upper limit; CGT0-V, the volume of the control group before treatment; CGT1-V, the volume of the control group 8 months after treatment; CGT0-S, the superficial area of the control group before treatment; CGT1-S, the superficial area of the control group 8 months after treatment; EGT0-V, the volume of the experimental group before treatment; EGT1-V, the volume of the experimental group 8 months after treatment; EGT0-S, the superficial area of the experimental group before treatment; EGT1-S, the superficial area of the experimental group 8 months after treatment.
![]()
RESULTS
Table 2
Information about the samples
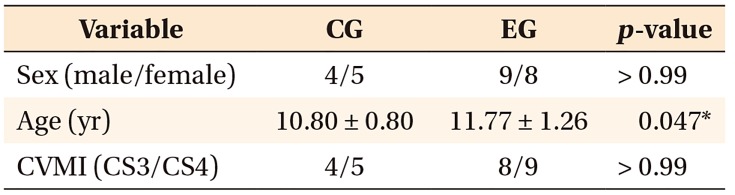
Values are presented as the mean ± standard deviation.
Sex indicates the composition of men and women in each group; CVMI indicates the composition of stage 3 or 4 cervical vertebrae maturation indicators (CS3 or CS4, respectively).
The chi-squared tests were performed to assess sex and CVMI distributions in the control and experimental groups.
Age is assessed using the independent t-test.
CG, Control group; EG, experimental group.
*p < 0.05.
![]()
Quantitative assessment
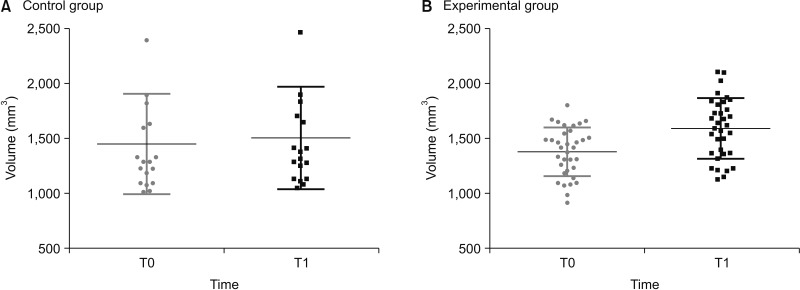 | Figure 2Condylar volume increases significantly 8 months after treatment (T1) compared to before treatment (T0) in both control (A) and experimental groups (B).
|
Table 3
The changes of condylar volume and superficial area in CG and EG
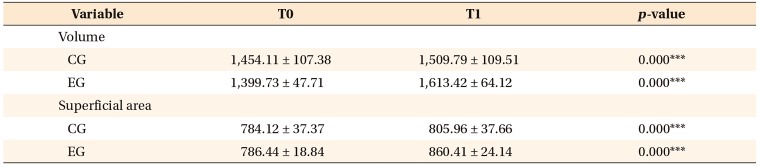
Values are presented as the mean ± standard deviation.
Condylar volume and superficial area in the control group are analyzed using the nonparametric rank-sum test. Condylar volume and superficial area in the experimental group are analyzed using the paired t-test.
CG, Control group; EG, experimental group; T0, before treatment; T1, 8 months after treatment.
***p < 0.001.
![]()
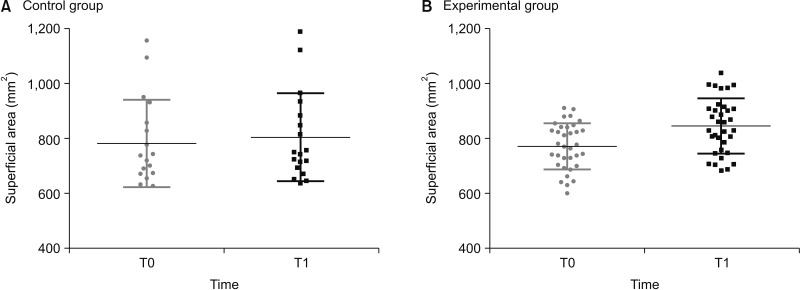
Table 5
Positional changes of the control and experimental groups
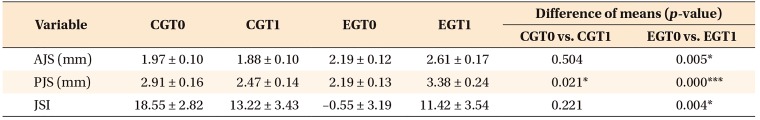
Values are presented as the mean ± standard deviation.
The AJS and PJS in the experimental group are analyzed using the nonparametric rank-sum test. The JSI in the experimental gruop and the AJS, PJS, and JSI in the control group are analyzed using the paired t-test.
CGT0, Control group before treatment; CGT1, control group 8 months after treatment; EGT0, experimental group before treatment; EGT1, experimental group 8 months after treatment; AJS, anterior joint space; PJS, posterior joint space; JSI, joint space index.
*p < 0.05; ***p < 0.001.
![]()
Qualitative assessment
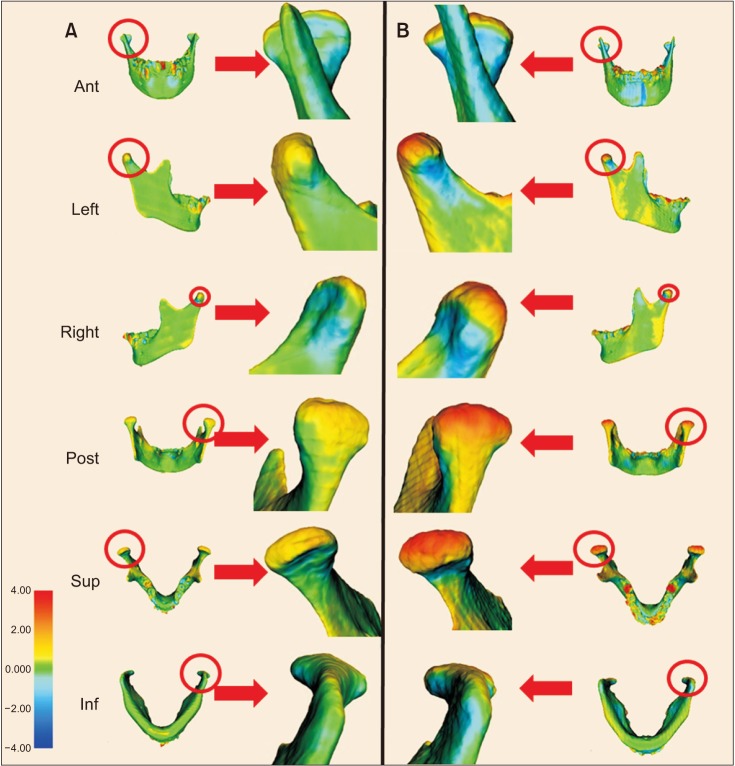 | Figure 5One example of six-directional views of superimposition in the control (A) and experimental (B) groups (CG and EG, respectively). More obvious skeletal remodeling is observed in the superior and posterior directions of the condyle in the EG than in the CG. All the skeletal superimpositions are visualized on a color-coded map and measured using the same scale, in which red color represents overgrowth and blue color represents resorption.Ant, Anterior; Post, posterior; Sup, superior; Inf, inferior.
|
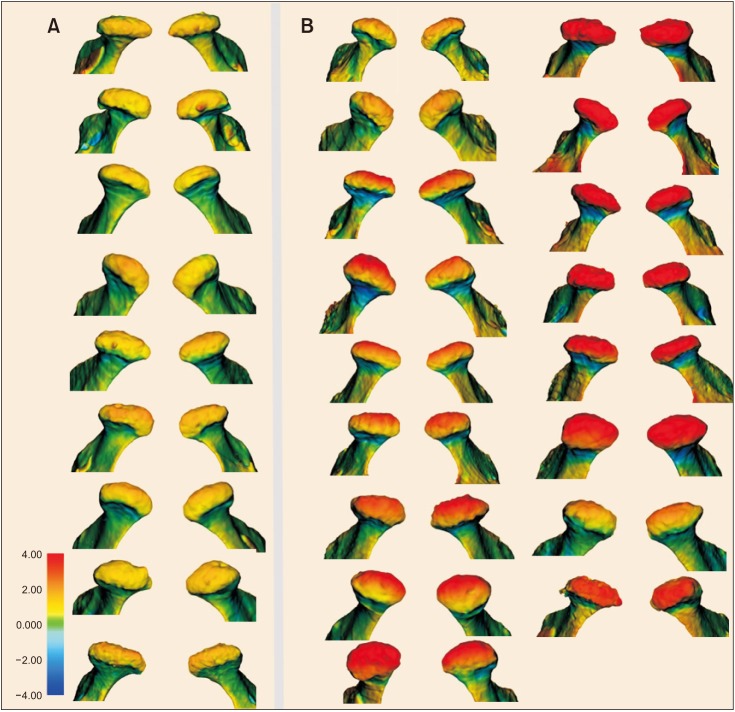 | Figure 6The superior view of all condylar superimpositions in the control (A) and experimental (B) groups (CG and EG, respectively). More obvious skeletal remodeling is observed in the superior direction of the condyle in the EG than in the CG. All the skeletal superimpositions are visualized on a color-coded map and measured using the same scale, in which red color represents overgrowth and blue color represents resorption.
|
 | Figure 7The posterior view of all condylar superimpositions in the contol (A) and experimental (B) groups (CG and EG, respectively). More obvious skeletal remodeling is observed in the posterior direction of the condyle in the EG than in the CG. All the skeletal superimpositions are visualized on a color-coded map and measured using the same scale, in which red color represents overgrowth and blue color represents resorption.
|
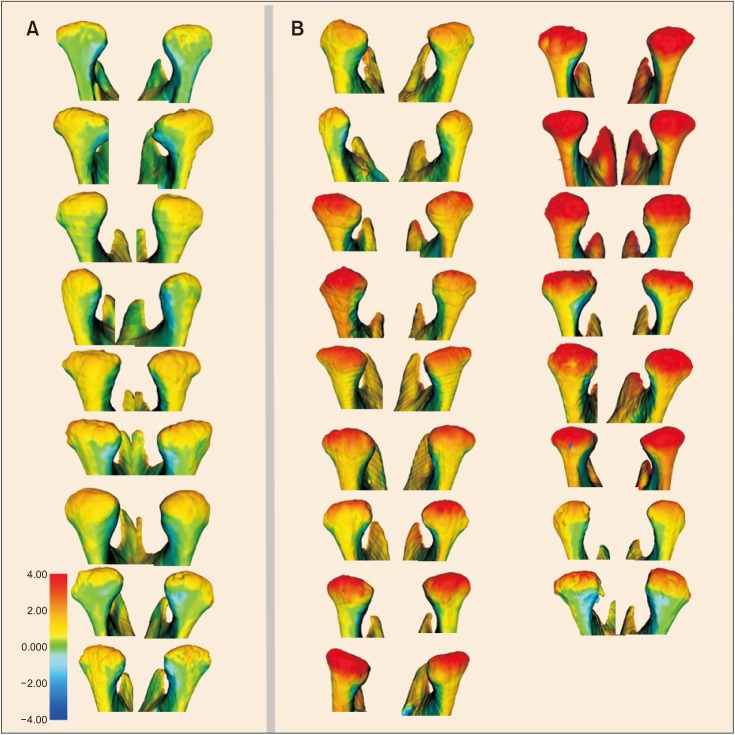
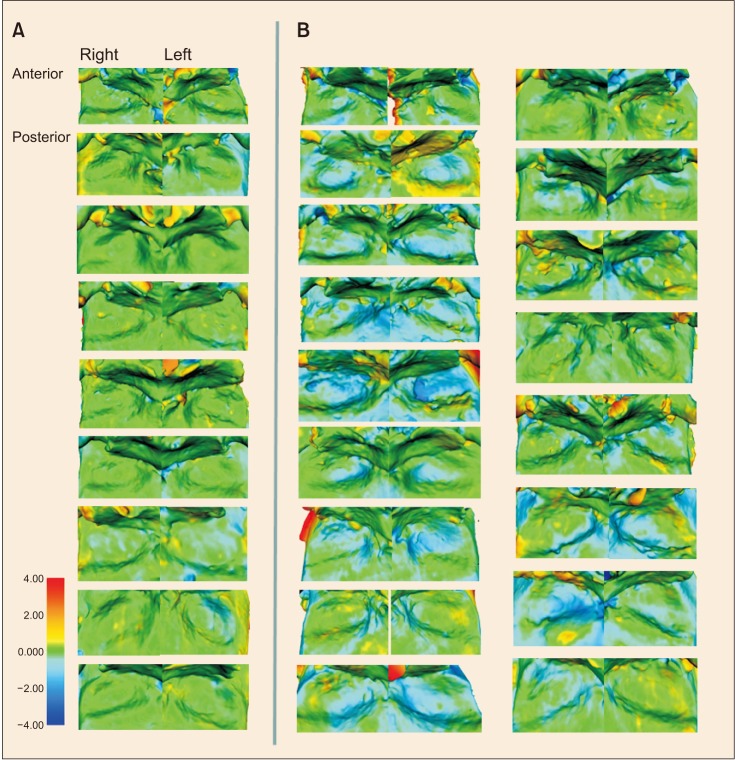 | Figure 8All superimpositions of the left and right glenoid fossa in the control (A) and experimental (B) groups (CG and EG, respecitvely). More obvious skeletal resorption is observed in the superior direction of the glenoid fossa in the EG than in the CG. All the skeletal superimpositions are visualized on a color-coded map and measured using the same scale, in which red color represents overgrowth and blue color represents resorption.
|
 XML Download