

 PDF
PDF ePub
ePub Citation
 Print
Print


INTRODUCTION
For the achievement of stable occlusion, resolution of the transverse discrepancy between the maxillary and mandibular arches is essential. The prevalence of maxillary transverse deficiency is reported to vary from 8% to 23%; in adult patients, it is known to be approximately 10%.123
Transverse deficiencies in adult patients were conventionally resolved by camouflage treatment in mild cases or surgically assisted rapid palatal expansion (SARPE) in severe cases. Maturation of the midpalatal suture and adjacent articulations increases the resistance to mechanical forces. Thus, the outcomes of traditional palatal expansion devices used after growth completion are less successful. The disadvantages of conventional tooth-anchored appliances (conventional rapid palatal expansion [RPE] or quad-helix), such as tipping of the anchored teeth, undesirable tooth movement, limited skeletal movement, postexpansion relapse, and root resorption, may be contributing factors for treatment failure.4567
Of late, microimplant-assisted rapid palatal expansion (MARPE) is being frequently utilized to overcome the abovementioned disadvantages.8 Microimplants incorporated into the palatal jackscrew ensures expansion of the palate, thus minimizing unwanted dentoalveolar effects such as tipping and expansion. Various microimplant insertion sites have been introduced and studied. MARPE employs posterior screws, whereas the Hybrid Hyrax expander employs anterior screws.9 Despite several attempts to utilize the technique for both practical and educational purposes, there is a lack of data regarding MARPE amongst orthodontists.1011121314
The esthetic demands of patients have been continuously increasing over the past few years.15 Under these circumstances, several clinical and radiographic studies have evaluated both the skeletal and dental effects of MARPE. However, the effects on the shape of the nose remain unclear.13 Although Ngan et al.16 and Filho et al.17 evaluated these effects, they used conventional two-dimensional (2D) lateral cephalograms, which have major limitations in terms of soft tissue assessments. Specifically, quantification of soft tissue changes from a frontal perspective is difficult with 2D cephalograms.
Magnusson et al.18 evaluated three-dimensional (3D) nasal changes after SARPE using cone-beam computed tomography (CBCT). CBCT facilitates 3D superimposition of data obtained before and after treatment; however, it leads to radiation exposure. Moreover, most patients who undergo palatal expansion treatment do not need to undergo CBCT; therefore, its use is ethically restricted.18
Recent advancements in 3D facial imaging techniques have facilitated faster, noninvasive, accurate facial measurements, and stereophotogrammetry is particularly advantageous in this regard.1920 In the present study, under the As Low As Reasonably Achievable (ALARA) principle, we used stereophotogrammetry to observe changes in the 3D facial profile, particularly the nasal soft tissues. Many clinicians and, occasionally, patients, are concerned about changes in the nasal soft tissues after MARPE. In adult patients in particular, unexpected changes in the facial profile could be misunderstood as adverse effects. Thus, the aim of this study was to evaluate changes in the nasal soft tissues, including movements of landmarks, changes in linear distances, and volumetric changes, using 3D stereophotogrammetry after MARPE in adult patients.
Go to : 
MATERIALS AND METHODS
Subjects
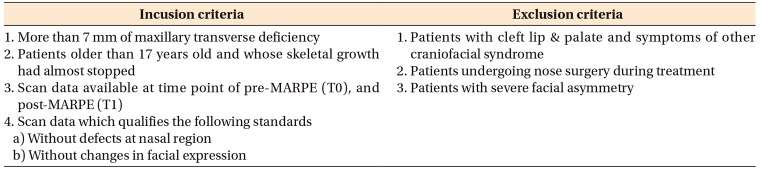
This prospective study was approved by the Institutional Review Board (IRB) of Dankook University Dental Hospital (DKUDH IRB: 2018-06-004). Patients who underwent MARPE in the Department of Orthodontics at the College of Dentistry, Dankook University, Korea were considered eligible. The entire face of each patient was scanned by a white light scanner before and after MARPE. The inclusion and exclusion criteria are described in Table 1.
Treatment protocol
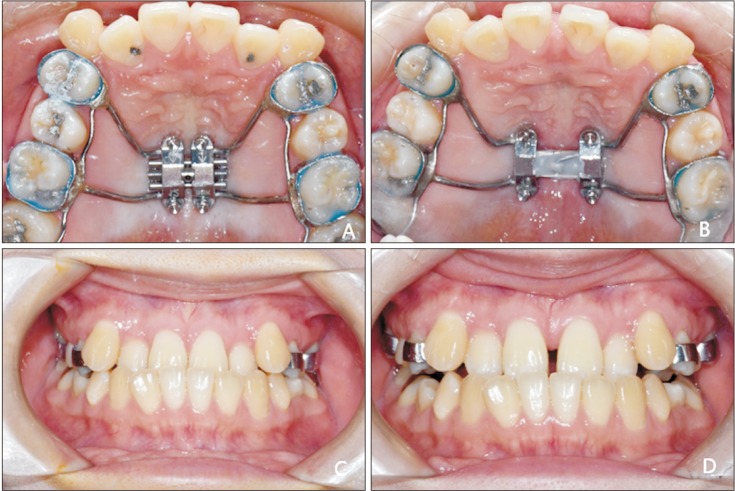
The MARPE (MSE-12; Biomaterials, Seoul, Korea) device made passive contact with the underlying tissue. Following cementation of the appliance to the maxillary first premolars and molars, MARPE was delivered via four microimplants (1.5 × 11 mm) inserted in the 1.5- × 2-mm slots of the appliance (Figure 1A and 1C). After delivery of the MARPE, the patient's facial profile was scanned (T0). Patients were instructed to turn the jackscrew themselves, with one turn every day. After 7 mm of expansion was achieved, activation was discontinued (Figure 1B) and separation of the midpalatal suture was evaluated by confirmation of the space between the two central incisors (Figure 1D). This was followed by 3D scanning (T1). The patient was excluded if the midpalatal suture had not separated and a diastema had not appeared.
Facial evaluation
3-dimensional scanning
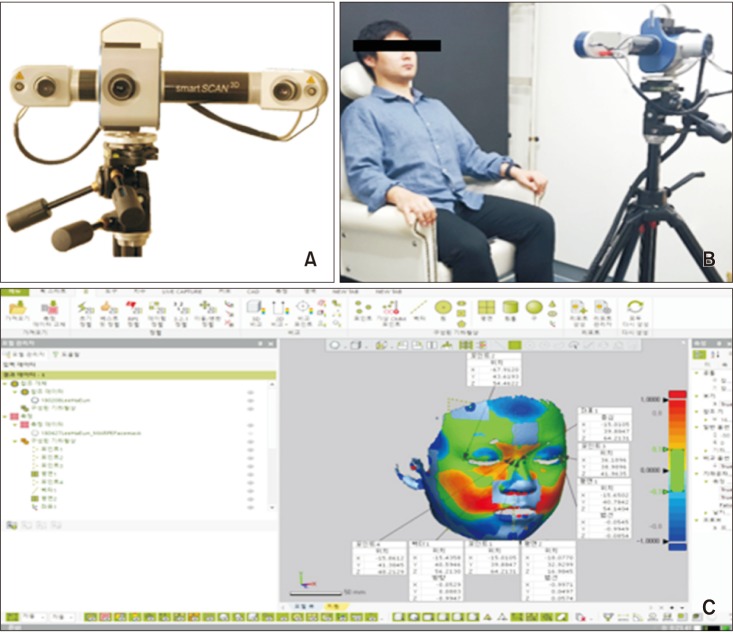
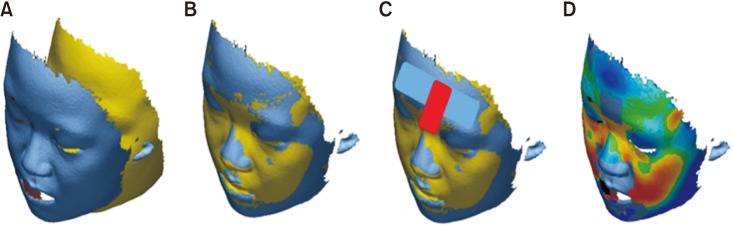
A 3D white light scanner, Smart-Scan 3D (Breuckmann, Braunschweig, Germany), was used for image acquisition (Figure 2A). Lens with a field of view of 450 mm were used. The resolution limit was 8 µm, with a feature accuracy of ± 45 µm and scan range of 318 × 318 mm2. Because of the susceptibility of the white light scanner, environmental light was eliminated during the scan process such that the light from the projector itself was the solitary source of light. In a closed room, the scanner was mounted on a dolly so that it could freely move without the need to change the scanning height. The patient was seated on a fixed chair stationed in front of the scanner. Involuntary swinging movement of the patient's head was minimized by a rear headrest fixed on the chair. Three scans were obtained for each patient: frontal, 45° to the right, and 45° to the left (Figure 2B). Every scan from each patient was aligned and merged using the iterative closest point (ICP) algorithm of the Optocat 2010 R2 (Breuckmann) software. Merged data were then exported and imported to Geomagic Control X 2017 (3D Systems, Seoul, Korea; Figure 2C), a reverse engineering software, as .STL files.
Establishment of reference planes
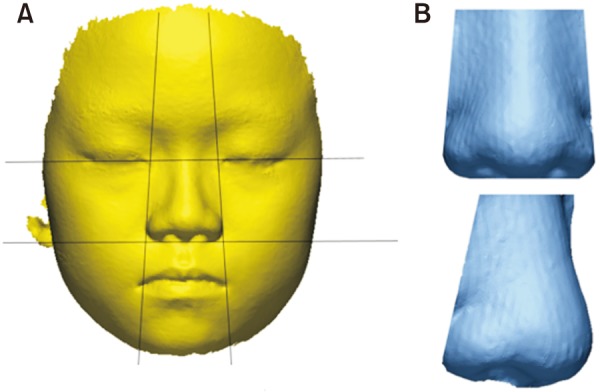
For the superimposition and measurement of scanned data, a new coordinate system was established. The horizontal reference plane was defined as the plane passing through the soft tissue nasion and exocanthion on both sides (Figure 3A). The plane perpendicular to the horizontal reference plane and passing through the soft tissue nasion and subnasale was established as the sagittal reference plane (Figure 3B). Finally, the coronal reference plane was designed such that it was perpendicular to the two existing planes and passed through the soft tissue nasion (Figure 3C). The soft tissue nasion was defined as the origin point with a coordinate value of (0, 0, 0). We set the sagittal reference plane as the x-axis, axial reference plane as the y-axis, and coronal reference plane as the z-axis, with positive values for movement in the left, upward, and forward directions, respectively (Figure 3D).
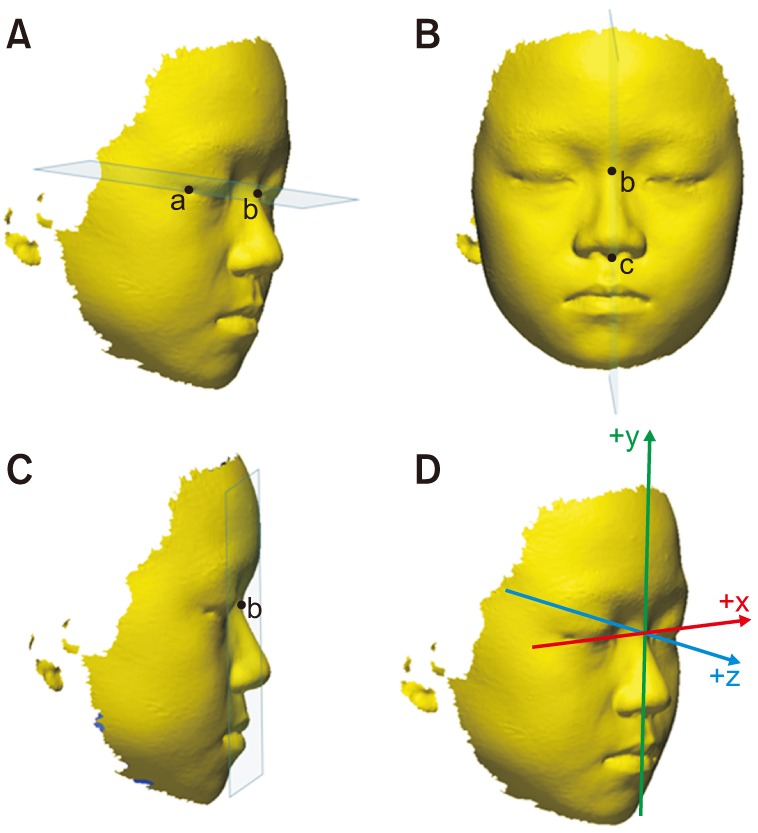 | Figure 3Establishment of reference planes for measurement of nasal soft tissue changes using stereophotogrammetry after microimplant-assisted rapid palatal expansion. A, The horizontal reference plane is defined as the plane passing through the soft tissue nasion (point b) and exocanthion (point a) on both sides. B, The plane perpendicular to the horizontal reference plane and passing through the soft tissue nasion and subnasale (point c) is established as the sagittal reference plane. C, The coronal reference plane is designed such that it is perpendicular to the two existing planes and passed through the soft tissue nasion. D, New coordinate system.
|
Definitions of soft tissue landmarks
For each of the scan data, a single examiner registered 10 soft tissue landmarks into the program (Geomagic Control X 2017; 3D Systems), with separate (x, y, z) coordinate values defining each landmark in the 3D Euclidean space. The locations and definitions of all landmarks are illustrated in Figure 4 and Table 2.18
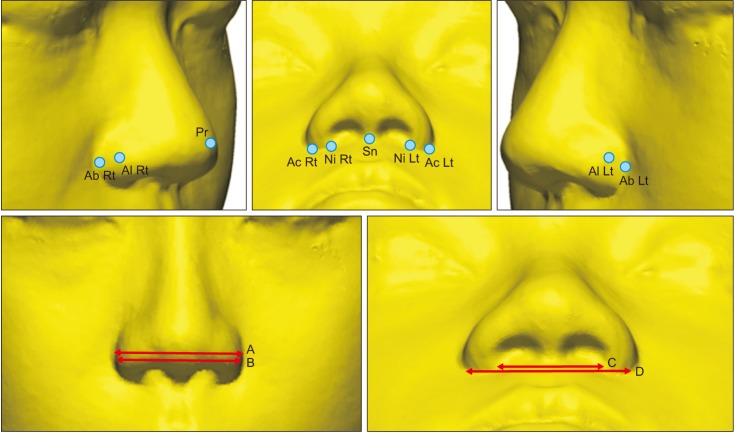 | Figure 4Locations and definitions of nasal soft tissue landmarks for measurement of nasal soft tissue changes using stereophotogrammetry after microimplant-assisted rapid palatal expansion.A, Alar width (Al Rt to Al Lt); B, alar base width (Ab Rt to Ab Lt); C, inferior width of the nostrils (Ni Rt to Ni Lt); D, alar curvature width (Ac Rt to Ac Lt).
See Table 2 for definition of each landmark.
|
Superimposition and measurements
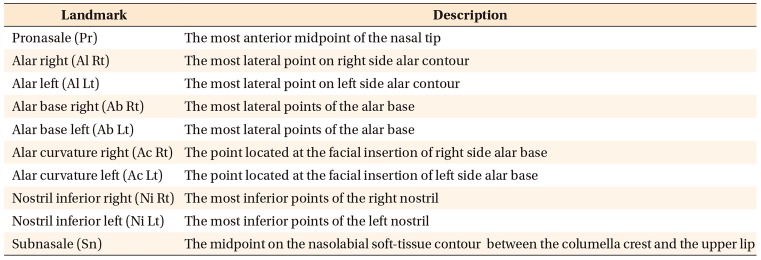
Scan data acquired at T0 and T1 were initially registered according to the algorithm of the program (Figure 5A and 5B). Subsequently, for more precise superimposition, best-fitting alignment was performed by designating the forehead, intercanthal region, and dorsum of the nose as an overlapping area (Figure 5C). The T1 and T0 data thus superimposed were represented by a color map generated via a 3D comparison algorithm, where relatively protruded and depressed areas were represented by red and blue colors, respectively (Figure 5D). The movement of each landmark along each of the three axes was measured. Moreover, the alar width, alar base width, inferior width of the nostrils, and alar curvature width were evaluated by measuring the distance between different landmarks, as shown in Figure 4.
 | Figure 5Superimposition and measurements for evaluation of nasal soft tissue changes using stereophotogrammetry after microimplant-assisted rapid palatal expansion (MARPE). A, Facial scan data before and after MARPE. B, Initial registration. C, Best fit alignment. Additional alignment based on specific regions is achieved (forehead, intercanthal region, and dorsum of the nose). D, Shell to shell three-dimensional deviation maps.
|
Volumetric measurements
The upper boundary was established as the plane that included the endocanthion on both sides and ran parallel to the horizontal reference plane, while the lower boundary was established as the plane that included the subnasale and ran parallel to the horizontal reference plane. The lateral boundary included the alar and endocanthion and ran parallel to the z-axis (Figure 6A). The scanned data outside the established boundaries were excluded such that only the nasal region remained, and the virtual volume of the nose was determined in mm3 (Figure 6B).
Statistical analysis
All statistical analyses were performed using IBM SPSS ver. 21.0 (IBM Corp., Armonk, NY, USA). All measurements were performed by a single examiner (S.R.L.). Ten parameters scanned at T0 were randomly selected at 1 month after the initial T0 measurements. These randomly selected data were used for landmark designation and volume measurements, followed by the determination of intraexaminer reliability and verification of systemic errors. Intraexaminer reliability was assessed using the intraclass correlation coefficient (ICC). Student's t-test and the Mann–Whitney U test were used to test for systematic errors, and Pearson's correlation analysis was used to determine the correlation of age with coordinate displacement, linear changes, and volumetric changes. Analysis of variance was used to identify differences in parameters measured before and after MARPE; the paired t-test and Wilcoxon signed rank test were used after regularity tests for each parameter. A p-value of < 0.05 was considered statistically significant.
Go to :
RESULTS
According to power and sample size calculations, the minimum sample size was set to 25 patients (A = 0.05, and power of 80%). From 46 consecutively recruited patients, 11 with insufficient scan data, two who declined to participate, and three in whom the midpalatal sutures did not separate were excluded. Eventually, 30 patients (12 men, 18 women) with a mean age of 20.46 years (range, 17.4–42.2 years) at the time of treatment initiation were recruited.
All ICC values except that for the x coordinate of the subnasale were > 0.994, which indicated excellent consistency. The ICC value for the volumetric measurement was also 0.977, indicating good reliability. Overall, the coordinates of the landmarks established in the nasal soft tissues showed a tendency for lateral, protrusive, and inferior movements. The coordinate displacements before (T0) and after (T1) MARPE are described in Table 3 and Figure 7.
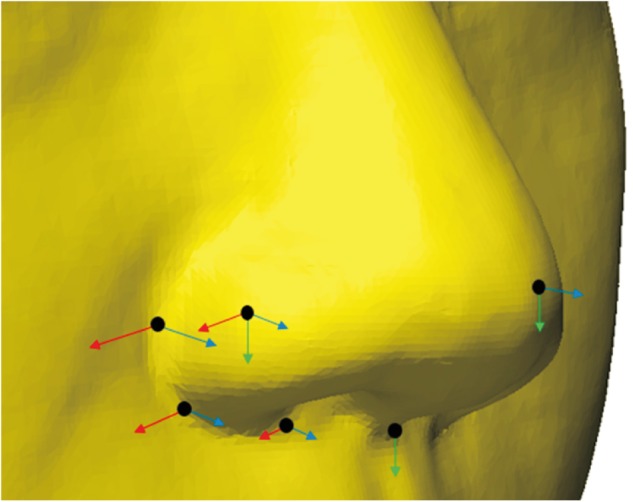 | Figure 7Displacement of landmarks measured by stereophotogrammetry after microimplant-assisted rapid palatal expansion. The length of the arrows indicates the amount of change (red: x-axis, green: y-axis, blue: z-axis).
|
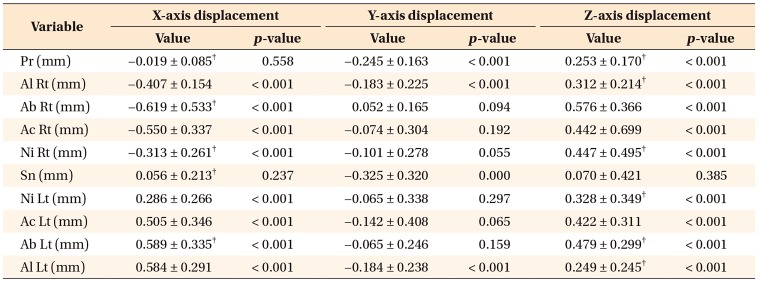
Table 3
Results of paired t-tests for the displacement of nasal soft tissue landmarks in each axis after microimplant-assisted rapid palatal expansion
Values are presented as mean ± standard deviation.
See Table 2 for definition of each landmark.
Significance was calculated using paired t-tests or †Wilcoxon singed rank test with the significance level set at p < 0.05.
![]()
On the x-axis, all landmarks except pronasale and subnasale showed significant movement. The landmarks on the right side exhibited negative values while those on the left displayed positive values. This indicated that the movement of each landmark resulted in widening of the nose. The largest amount of displacement was observed at alar right (right alar base; mean: −0.619 mm), followed by alar left (left alar base; mean: 0.589 mm).
On the y-axis, negative displacement values were observed for all landmarks except alar right. However, only pronasale, alar right, subnasale, and alar left could be considered statistically significant movement. Subnasale displayed the largest amount of displacement (mean: −0.325 mm), followed by pronasale (mean: −0.245 mm).
On the z-axis, all landmarks except subnasale showed statistically significant displacement with positive values. This indicated protrusive movement of the majority of landmarks. Alar right showed the maximum anterior displacement (mean: 0.576 mm), followed by alar left (mean: 0.479 mm). Both pronasale and subnasale showed relatively small anterior displacement values.
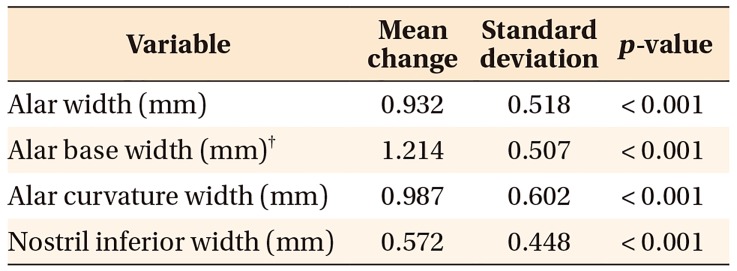
With regard to the Euclidean distance (linear distance between two landmarks), a statistically significant increase could be observed in the alar width, alar base width, inferior width of the nostrils, and alar curvature width (Table 4). The alar base width showed the maximum increase (mean: 1.214 mm) while the inferior width of the nostrils showed the smallest increase (mean: 0.572 mm). Relative to the amount of expansion achieved by MARPE, nasal soft tissue widening was observed at a ratio of approximately 8.1% to 17.3%.
Significant volumetric changes were also observed. The average volume was 33,571.56 mm3 at T0 and 34,564.89 mm3 at T1, with an increase of 993.33 mm3. The proportion of increase relative to the value at T0 was 2.96%. None of the measurements showed a correlation with age (Pearson's correlation analysis).
Go to :
DISCUSSION
Despite the high success rate as a treatment method for nongrowing patients, clinicians have several concerns about the midpalatal suture separation technique. As a result of the constant increase in the esthetic demands of patients, unwanted facial deformities that commonly occur after this type of treatment can be a rather sensitive issue for both the patient and the clinician.
In previous studies, the zygomatic arch and nasal cavity have been reported to expand after RPE or SARPE.23 Thus, with regard to the soft tissues, widening of the face or deformation of the nose can be expected. However, there is insufficient research on this aspect. Some studies attempted to clarify this issue by using photographs or radiographs; however, their findings were limited because it was difficult to acknowledge 3D changes in the facial features.24 In the present study, we used stereophotogrammetry, which enables the acquisition of 3D data without radiation exposure. This technique is considered highly reliable and accurate,2526 and studies using this method have been recently introduced.27
Accurate superimposition is crucial for the comparison of 3D data. Eidson et al.28 suggested that the upper zygoma is a relatively stable structure for superimposition.29 However, in the present study, structures on the lateral side of the face could not be used for superimposition because the skeletal structure above the maxilla has been reported to expand laterally after MARPE.18 Accordingly, we used the forehead region and dorsum of the nose as areas for superimposition (Figure 5C) and repeatedly instructed the patients to maintain a stable facial posture. Because the forehead and dorsum of the nose are the furthest regions from the expansion area and closest to the center of the face, they could be considered structures that would be the most stable during the lateral expansion process.
In a previous study based on SARPE, expansion of over 5 mm resulted in an alar width increase of 1.66 mm and alar base width increase of 3.09 mm;18 these values were 0.932 mm and 1.214 mm, respectively, in the present study, where expansion of 7 mm was achieved by MARPE (Table 4). Thus, the width increases were lesser than those reported after SARPE, possibly because of the smaller percentage of skeletal expansion with MARPE. Park et al.13 reported that skeletal, alveolar, and dental expansions accounted for 37.0%, 22.2%, and 40.7% of the total expansion amount after MARPE, respectively. Compared with SARPE, MARPE requires considerable stress to separate the midpalatal suture.30 Therefore, it is thought that the amount of skeletal expansion with MARPE is smaller than that with SARPE, even if the jackscrew is expanded by the same amount.
Corbridge et al.31 reported that, during RPE treatment, the skeletal structure separated into a pyramidal shape when viewed from the coronal plane. Park et al.13 reported that such changes could also be observed in patients undergoing treatment with MARPE.
In the present study, the alar base width showed the largest increase. This is because the alar base is closer to the coronal plane than is the alar, so it is more directly affected by MARPE. It is believed that the cartilages and soft tissues of the nose absorb the influence of bony expansion. Landmarks near the midline, such as pronasale and subnasale, exhibited larger amounts of displacement in the y and z axes than in the x-axis, showing statistically significant displacement in the downward and forward directions. In fact, all landmarks except alar right showed overall forward and downward displacement. Thus, clinicians need to keep in mind that the contours of the nose may move forward or downward after MARPE. In certain situations, the forward movement of pronasale may have a positive effect on the facial appearance (Figure 7).
Trends for overall displacement in the forward and downward directions can be attributed to the characteristics of MARPE. Sarver and Johnston32 reported that the maxilla is displaced forward and downward during RPE because of the influence of the treatment on the circummaxillary suture. Park et al.,13 however, observed that MARPE had a stronger tendency to separate the midpalatal suture in a parallel fashion than did RPE. Circumaxillary sutures are diagonally aligned when observed from a 3D perspective.33 Separation of the midpalatal suture in a parallel fashion enables sufficient separation of the posterior portion of the maxilla.34 Consequently, the circumaxillary suture, which is close to the posterior portion of the maxilla, would be more directly affected, and this leads to a further increase in downward and forward movement of the maxilla. However, the soft tissue displacement tendency observed in the present study requires long-term follow-up evaluations for determining whether the change is merely temporary stretching of the soft tissue or an actual significant and permanent soft tissue displacement. Abedini et al.35 reported that expansion using MARPE significantly affected the soft tissues in the paranasal area, with the changes remaining stable after a 1-year retention period.
After MARPE in the present study, the nose volume increased by an average of 993.33 mm3, which was statistically significant. This increase is related to an increase in the airway volume, which has been addressed in previous studies.36 The boundaries for volumetric measurements of the nose were unclear, and establishment of reproducible boundaries was necessary considering the complex shape of the nose. The actual outer contour of the nose was a less reproducible boundary because of ambiguity in the borders between the nose and cheek. Therefore, we aimed to establish virtual boundaries using landmarks such as the endocanthion and alar (Figure 6). Nada et al.36 reported an average volume increase of 1,040 mm3 after bone-borne SARPE; this was equivalent to 2.39% of the original total volume. The authors did not control the amount of expansion of the device and measured the volume of the nose after achieving clinically appropriate occlusion. In the present study, expansion of the device was fixed at 7 mm, and the volume increase was 2.96%. The actual data for the volume of the nose showed smaller figures than those in the study of Nada et al.,36 but this can be attributed to differences between Asians and Caucasians and differences in measuring techniques between the two studies. Nevertheless, our study aimed to evaluate the amount and proportion of changes rather than the actual nose volume, and we achieved clinically meaningful results in this aspect. It should be noted that the nasal volume can differ according to the method by which the nasal region is defined.
The degree of soft tissue changes after orthognathic surgery varies among patients.37 The present study showed results consistent with this theory. Even though changes in the nasal soft tissues after RPE or SARPE have been measured in some previous studies,1836 few studies have evaluated these changes after MARPE. To our knowledge, the present study is the first to evaluate 3D changes in the nasal soft tissues using stereophotogrammetry after MARPE. The level of soft tissue sensitivity varies greatly among patients. Furthermore, because the nose is placed in the center of the face, which is an area where several structures converge, it is highly susceptible to influences from diverse factors such as circummaxillary sutures, spheno-occipital synchondrosis, orbital structures, sex, and age.38 Therefore, more controlled studies considering these factors and including sufficient samples are necessary.
While the facial profile changes observed in this study could be positively considered in nongrowing patients, they could also be considered negative. The nasal soft tissues tended to widen and move forward and downward. This could be favorable for patients with a narrow nasal width before treatment. However, for adult patients who may already have a wide nose, the increase in the nasal width can be a very sensitive issue, even if it is as small as 1 mm. There is no definite threshold for a layperson's perception about the nasal width.36 Thus, esthetic evaluation is very complicated, and clinicians must give patients enough information about the anticipated changes before the start of treatment. In addition, thorough diagnosis is necessary.
This study has some limitations. A limitation of the present study is that the changes were immediate response, not permanent one. Whether this result is just a temporary stretching of the soft tissue or an actual significant permanent displacement, a long term follow-up study is needed. In addition, the 3D superimposition remains a topic of research. For example, there may be deformation of overlapping areas such as the soft tissue nasion by additional expansion of the frontonasal suture. In the present situation, the method considered as the best overlap method was used; however, the result itself was a small number, and a tiny error in the overlap area may be meaningful. Further research on 3D superimposition is necessary.
Go to :
CONCLUSION
The findings of this study suggest that the majority of soft tissue landmarks around the nasal region show significant positional changes after MARPE in adults. The nose tends to widen and move forward and downward. The post-treatment nasal volume may also exhibit a significant increase relative to the initial volume. Clinicians should thoroughly explain the anticipated changes to patients before MARPE initiation.
Go to :
 XML Download