

 PDF
PDF ePub
ePub Citation
 Print
Print


INTRODUCTION
According to the Statistics Korea, Koreans 65 years or older accounted for 14.2% of the population in 2017, indicating that Korea has become an aged society, and the proportion of people aged 65 years or older is expected to exceed 20% by 2026, at which point Korea will become a superaged society [1]. The increasing number of elderly people will be accompanied by a greater burden of mortality and morbidity related to cardiovascular and metabolic diseases. This point is underscored by the importance of cardiovascular and metabolic diseases as causes of death; for instance, in 2018, heart disease, cerebral hemorrhage, diabetes, and hypertension were the second, fourth, sixth, and 10th most common causes of death in Korea, respectively [1]. Therefore, interventions to prevent and/or reduce cardiovascular risk factors are warranted.
In Korea, numerous associations annually release fact sheets with information on the prevalence and current management of their diseases of interest based on analyses of national databases. Every year since 2015, the Korean Society for the Study of Obesity (KSSO) has released the Obesity Fact Sheet, which is based on an analysis of National Health Insurance Service (NHIS) and Korean National Health and Nutrition Examination Survey (KNHANES) data [2]. Almost every year since 2012, the Korean Diabetes Association (KDA) has released the Diabetes Fact Sheet, which is based on an analysis of KNHANES data and supplemented by NHIS data [3]. Furthermore, the Korean Society of Hypertension (KSH) released the first Hypertension Fact Sheet in 2018 using KNHANES and NHIS data [4]. Lastly, since 2015, the Korean Society of Lipid and Atherosclerosis (KSoLA) has released the Dyslipidemia Fact Sheet, which is based on an analysis of KNHANES and NHIS data [5]. Although these fact sheets differ in terms of the years of data that are included, they help clinicians and the public to recognize the current status of these diseases in Korea and to implement better strategies to promote health.
The NHIS and KNHANES provide two national-scale datasets, which are the main sources used to generate these fact sheets. The NHIS provides claims data for almost all beneficiaries of the NHIS, which covers the entire population of Korea, as well as data from a nationwide medical checkup program, in which biennial examinations are provided to all Koreans older than 20 years [6]. This database contains laboratory data for metabolic parameters, and claims codes for diseases and medications are also available. The KNHANES dataset is constructed as part of an ongoing cross-sectional study conducted by the Korea Centers for Disease Control and Prevention that has been assessing the health and nutritional status of Koreans since 1998 [7]. This nationally representative cross-sectional survey includes approximately 10,000 individuals each year as a survey sample and collects information on socioeconomic status, health-related behaviors, quality of life, healthcare utilization, anthropometric measures, biochemical and clinical profiles for non-communicable diseases, and dietary intake. It has three components: a health interview, a health examination, and a nutrition survey. The NHIS dataset has the advantage of containing data from the entire Korean population, while the KNHANES dataset furnishes well-sampled data representing the entire Korean population.
In this review, I would like to summarize the information contained in the four above mentioned fact sheets, focusing on the prevalence and current management of each disease in Korea to provide insights into the current status and management of cardiovascular risk factors in Korea.
Go to : 
OBESITY FACT SHEET 2019
The KSSO has released the Obesity Fact Sheet since 2015. The fact sheets released over the course of the last 4 years have presented cross-sectional data on obesity and its comorbidities. Distinct from the previous Obesity Fact Sheets, the Obesity Fact Sheet 2019 focused on changes in the prevalence of obesity over the past 10 years, from 2009 to 2018, primarily on the basis of an analysis of the NHIS database [28].
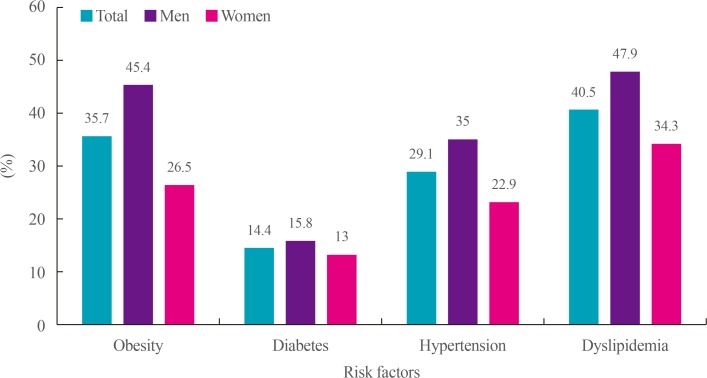
Obesity was defined as a body mass index (BMI) equal to or higher than 25 kg/m2, according to the Asia-Pacific Region definition and the KSSO obesity guideline [910]. Over the past 10 years, the prevalence of obesity in Korea markedly increased (Fig. 1). In 2009, the prevalence of obesity in the total population was 29.7%, which increased to 35.7% in 2018. This trend was similar in both sexes. In 2018, the prevalence of obesity was 45.4% in men and 26.5% in women, showing a higher prevalence in men than in women, as expected (Fig. 2).
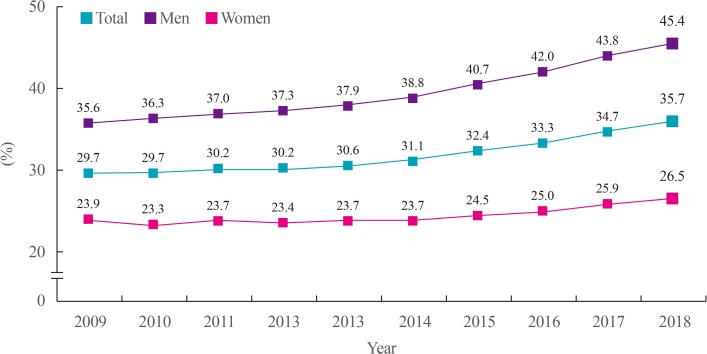 | Fig. 1Prevalence of obesity in the last 10 years (2009 to 2018). Obesity was defined as a body mass index equal to or higher than 25 kg/m2. Modified from the guidelines of Korean Society for the Study of Obesity [2].
|
Trends in the obesity rate by age and sex over the past 10 years
When the prevalence of obesity was analyzed by age group, it was found that the prevalence of obesity gradually increased in all age groups over the past 10 years [28]. The highest prevalence of obesity was found in adults in their 30s (40.5%), followed by those in their 60s (40.1%), those in their 70s (39.8%), and those in their 40s (38.3%). The prevalence of obesity in adults in their 20s, 30s, and 80s showed a significantly steeper increasing trend over the past 10 years than was observed in other age groups.
In men, the prevalence of obesity gradually increased over the past 10 years in all age groups, with the highest prevalence of obesity found in men in their 30s (51% in 2018). Men in their 20s and 30s showed steeper increases in the prevalence of obesity than were found in other age groups. This increase in the prevalence of obesity in young men reflects a worrisome metabolic health threat facing young Korean men.
In women, an increasing trend in the prevalence of obesity was not found in all age groups. Of note, women in their 20s, 30s, 70s, and 80s showed a markedly increasing trend in the prevalence of obesity, while paradoxically, those in their 50s and 60s showed a decreasing trend (32.7% to 30.6% in 50s, 41.4% to 38.7% in 60s) [28]. The decrease in the prevalence of obesity in post-menopausal women (50s and 60s) was unexpected, but a potential explanation is that these are age groups in which women tend to be relatively economically stable and can therefore take steps to care for their own health through lifestyle modifications.
Trends in the prevalence of abdominal obesity
Abdominal obesity was defined by a waist circumference of at least 90 cm in men and 85cm in women according to the KSSO criteria [10]. The prevalence of abdominal obesity significantly increased over the past 10 years in Korean adults [28], with prevalence rates of 23.8% in the total population, 28.1% in men, and 18.2% in women recorded in 2018. Similar to the prevalence of general obesity assessed by BMI, the prevalence of abdominal obesity increased most steeply in adults in their 30s. In contrast, the prevalence of abdominal obesity decreased in those in their 60s. A significant difference from general obesity is that the absolute rate of abdominal obesity was higher in older age groups, with a prevalence of 29.6% in adults in their 60s and 36.1% in those in their 80s; in contrast, the prevalence of abdominal obesity was 22.4% in adults in their 30s and 23.4% in those in their 50s. However, the highest rate of increase was found for adults in their 30s (15.8% to 24.5%), overwhelming the rate of increase for adults in their 40s and 50s (16.2% to 22.3% in 40s, 22.2% to 23.4% in 50s).
In men, the prevalence of abdominal obesity gradually increased over the past 10 years in all age groups, but the trend was somewhat different from that of the total population. Men in their 70s showed the highest prevalence of abdominal obesity in 2018 (32.5%), followed in order by those in their 30s, 80s, and 60s (30.8%, 30.4%, and 30.0%). In contrast, in the total population, the top-tier prevalence of abdominal obesity was found in older age groups (36.1% in 70s, 35.1% in 80s, 29.6% in 60s). Of note, men in their 30s and 40s were the most severely threatened age groups in terms of the rate of increase in the prevalence of abdominal obesity (18.9% to 30.8% in 30s, 20.7% to 29.1% in 40s). As with general obesity, lifestyle interventions for men in these age groups are warranted.
In women, the highest prevalence of obesity was observed in those in their 70s (39.4%). Similar to the trends observed for general obesity, the prevalence of abdominal obesity decreased in women in their 50s and 60s (19.9% to 19.0% in 50s, 32.8% to 29.2% in 60s). The prevalence of abdominal obesity in women in their 20s, 30s, and 40s showed an increasing trend (4.4% to 8.1% in 20s, 7.3% to 11.9% in 30s, and 11.0% to 14.1% in 40s). However, the absolute prevalence was higher in older age groups than in younger age groups.
Go to :
DIABETES FACT SHEET 2018
The KDA has released the Diabetes Fact Sheet at intervals of 1 to 2 years since 2012. The aims of this fact sheet are to provide accurate statistics on the number of patients with diabetes in Korea and their management status, and to show the severity of the comorbidities and complications of diabetes. In the Diabetes Fact Sheet 2018, information on the prevalence of diabetes, level of management, comorbidities, and health behaviors was extracted from KNHANES data from 2011 to 2016, and the current status of diabetes treatment was analyzed using health insurance data from the NHIS [311]. The cross-sectional prevalence of diabetes was analyzed using KNHANES 2016 data, and trends in the prevalence of diabetes over time were assessed using data from 2011 to 2016 [3]. Individuals were classified as having diabetes if they satisfied any of the following four criteria: (1) having been diagnosed with diabetes by a doctor, (2) currently taking anti-diabetic medications, (3) having a fasting plasma glucose (FPG) ≥126 mg/dL, or (4) having a hemoglobin A1c (HbA1c) level ≥6.5% [10].
The prevalence of diabetes among adults 30 years or older was 14.4% (15.8% in men and 13.0% in women) when the HbA1c criterion was included in the definition of diabetes (Fig. 2). The prevalence of diabetes was even higher (29.8%) when the analysis was limited to adults older than 65 years, meaning that one in three Koreans 65 years or older had diabetes. When separate analyses were conducted by age group and sex, the prevalence of diabetes exceeded 10% for men in their 40s (10.9%) and 10% for women in their 50s (12.4%) (Fig. 3). The prevalence of diabetes was higher in women in their 70s than in men in their 70s (33.6% vs. 29.1%).
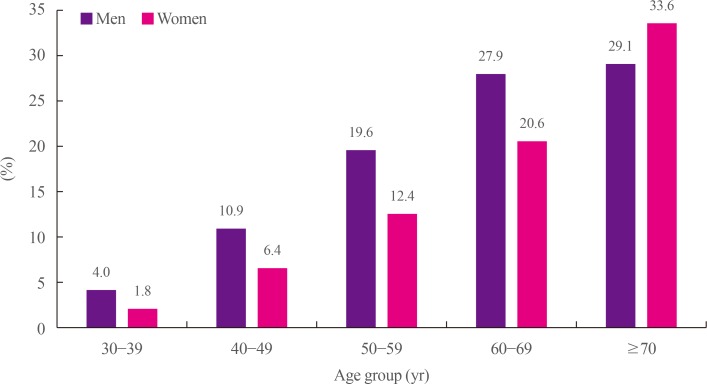 | Fig. 3Prevalence of diabetes by age and sex (2016). Diabetes was defined if they satisfied any of the following four criteria: (1) having been diagnosed with diabetes by a doctor, (2) currently taking anti-diabetic medications, (3) having a fasting plasma glucose ≥ 126 mg/dL, or (4) having a hemoglobin A1c level ≥6.5%. Modified from the guidelines of Korean Diabetes Association [3].
|
When the prevalence of diabetes was analyzed serially from 2011 to 2016, it was found to have increased from 12.4% in 2011 to 14.4% in 2016. The increasing trend was similar in men and women.
Prevalence of impaired fasting glucose
Prediabetes refers to glycemic abnormalities that precede diabetes [12]. The Diabetes Epidemiology: Collaborative analysis of Diagnostic criteria in Europe (DECODE) study and the Funagata study found that prediabetes was a strong predictor of cardiovascular mortality in comparison to normoglycemic individuals [1314]. Therefore, interventions to lower blood glucose levels should be started in the stage of prediabetes to reduce cardiovascular disease (CVD) risk.
Impaired fasting glucose (IFG) is defined by an FPG of 100 to 125 mg/dL and an HbA1c level <6.5% in people who have not been diagnosed with diabetes [12]. In 2016, the prevalence of IFG among Korean adults 30 years or older was 25.3% in the total population (31% in men and 19.7% in women). In an analysis by age group, the prevalence of IFG steadily increased with age in both sexes, except for individuals in their 70s. The estimated number of Korean adults with IFG was 1.73 times that of those with diabetes, corresponding to 5.02 million patients with diabetes and 8.71 million patients with IFG. In total, 13.72 million Korean adults were estimated to suffer from IFG or diabetes.
Management of diabetes
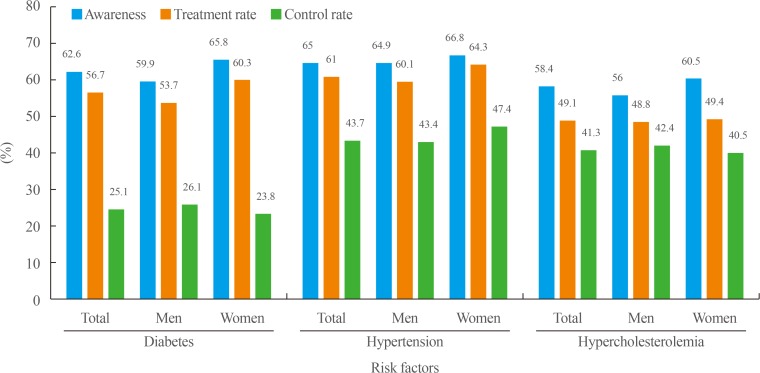
The current status of diabetes management was analyzed. The awareness rate of diabetes was 62.6%, and the treatment rate was 56.7%, which were relatively high compared to other diseases (Fig. 4). However, the control rate, defined by an HbA1c level <6.5%, was only 25.1%, which was relatively low considering the high awareness and treatment rates. When the target HbA1c level was defined as <7.0%, the control rate increased to 52.6%. Nonetheless, 20.9% of people with diabetes had an HbA1c level ≥8.0%, indicating that they still had a long way to go to reach a reasonable target.
Comorbidities of diabetes
When the comorbidities of diabetes were analyzed, it was found that 50.4% of people with diabetes were obese, as defined by a BMI ≥25 kg/m2. Class II obesity (BMI 30 to 34.9 kg/m2) was present in 8.4% of people with diabetes, and class III obesity (BMI ≥35.0 kg/m2) was present in 1.8% of people with diabetes.
When abdominal obesity was defined by a waist circumference ≥90 cm in men and ≥85 cm in women, it was found that 52.2% of people with diabetes had abdominal obesity, a higher proportion than was observed in the general population [10]. Men with diabetes showed a higher prevalence of abdominal obesity than women with diabetes (55.8% vs. 47.9%).
Hypertension was defined by a blood pressure ≥140/90 mm Hg and/or taking anti-hypertensive medications; according to this definition, 55.3% of patients with diabetes had hypertension. Surprisingly, more than seven out of 10 (74.6%) of people 65 years or older with diabetes had hypertension. Controlled hypertension was defined by a blood pressure <140/85 mm Hg according to KDA Treatment Guideline for Diabetes 2015, and roughly seven out of 10 (73.1%) people with diabetes had reached their target blood pressure goal according to this definition [12].
When hypercholesterolemia was defined by a total cholesterol (TC) level ≥240 mg/dL and/or the use of lipid-lowering medications, the prevalence of hypercholesterolemia in people with diabetes was found to be 34.9%. Moreover, only four out of 10 people with diabetes had reached the target goal of a low-density lipoprotein cholesterol (LDL-C) level <100 mg/dL according to the KDA Treatment Guideline for Diabetes 2015 [12].
The proportion of people with comprehensive management of diabetes, defined by satisfying all three target of an HbA1c level <6.5%, blood pressure <140/85 mm Hg, and a LDL-C level <100 mg/dL, was 8.4% in people with diabetes, which seems rather low. Comprehensive management of diabetes should be implemented in patients with diabetes to reduce CVD risk, as suggested by findings of the Steno-2 trial [13].
Go to :
HYPERTENSION FACT SHEET 2018
The KSH released its first fact sheet for hypertension epidemiology in 2018, based on an analysis of NHIS and KNHANES data through 2016 [415]. Hypertension was defined as a blood pressure ≥140/90 mm Hg and/or taking anti-hypertensive medication [16].
According to this fact sheet, 11 million Koreans were estimated to have hypertension, approximately 29% of Korean adults older than 30 years. Men showed a higher prevalence of hypertension than women (35% vs. 22.9%) (Fig. 2).
Prevalence of hypertension by age
When the prevalence of hypertension was analyzed by age group and sex, men showed a higher prevalence than women until their 60s, after which women showed a higher prevalence than men, similar to the other diseases discussed above. Since 1998, the prevalence of hypertension has increased in both sexes, except for women in their 40s to 60s. In general, the prevalence of hypertension showed a decreasing trend in middle-aged women, as was observed for obesity (Fig. 5).
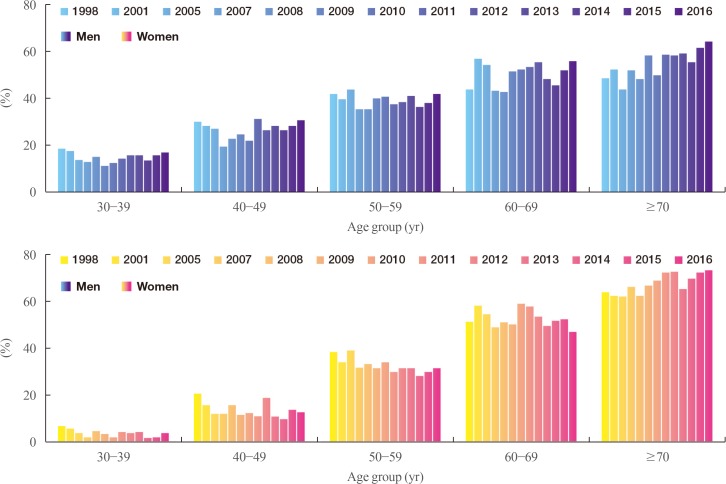 | Fig. 5Changes in the prevalence of hypertension by age and sex over time. Hypertension was defined as a blood pressure ≥140/90 mm Hg and/or taking anti-hypertensive medication. Modified from the guidelines of Korean Society of Hypertension [4].
|
Management of hypertension
The status of hypertension management was assessed in terms of control, awareness, and treatment rates. The target of blood pressure control was <140/90 mm Hg, according to the KSH guideline for hypertension management [17]. In 2016, the rate of hypertension control was 43.7% among patients diagnosed with hypertension and 70.8% among those who had been treated for hypertension (Fig. 4). In addition, the awareness and treatment rates of hypertension were 65% and 61%, respectively, in 2016. When these indices were analyzed over the past 10 years, the awareness, treatment, and control rates of hypertension steadily increased from 1998 to 2007. However, starting in 2007, the rates remained stagnant for 10 years. Further efforts should be made to improve the management of hypertension.
Go to :
DYSLIPIDEMIA FACT SHEET 2018
Since 2015, the KSoLA has regularly released the Dyslipidemia Fact Sheet based on national survey data to uphold its mission of preventing and treating atherosclerosis and to improve public awareness of atherosclerosis and its risk factors. The Dyslipidemia Fact Sheet 2018 was based on KNHANES and NHIS data through 2016 [5].
Prevalence and management of hypercholesterolemia
Hypercholesterolemia was defined by a TC level ≥240 mg/dL, previously diagnosed hypercholesterolemia, or the use of any anti-dyslipidemic drugs. The prevalence of hypercholesterolemia in adults 30 years or older was found to be 19.9% in 2016, meaning that nearly one out of five adults had hypercholesterolemia. The prevalence increased from 14.4% in 2012 to 19.9% in 2016. Men and women showed a similar increase in the prevalence of hypercholesterolemia during this period.
Regarding the management of hypercholesterolemia, the awareness rate of hypercholesterolemia was 58.5% in 2016, meaning that four out of 10 adults with hypercholesterolemia were not aware of their condition (Fig. 4). However, the awareness rate steadily increased from 38.8% in the KNHANES IV data (2007 to 2009) to 58.4% in the KNHANES VII data (2016). The treatment rate of hypercholesterolemia was 49.1% according to the KNHANES VII data from 2016, meaning half of hypercholesterolemic patients took lipid-lowering medications. Lastly, the control rate of hypercholesterolemia was 41.3%, based on a target goal of TC <200 mg/dL. The control rate was much higher (82.7%) in patients taking lipid-lowering drugs, implying that taking lipid-lowering drugs may be an effective way for patients to reach their target cholesterol levels.
Prevalence and management of dyslipidemia
Dyslipidemia was diagnosed in individuals who satisfied one of the three following criteria: an LDL-C level ≥160 mg/dL, a high-density lipoprotein cholesterol (HDL-C) level <40 mg/dL, or a triglyceride (TG) level ≥200 mg/dL. Individuals taking any medications for dyslipidemia or who were previously diagnosed with dyslipidemia were also classified as having dyslipidemia.
The mean serum TC level in adults aged 30 years or older was 192.8 mg/dL in men and 193.4 mg/dL in women. The mean levels of TG, HDL-C, and LDL-C were 169.7, 47.0, and 113.8 mg/dL, respectively, in men, and 118.4, 54.0, and 116.2 mg/dL, respectively, in women.
The prevalence of dyslipidemia was 40.5% in the total population (47.9% in men and 34.3% in women) (Fig. 2). When the prevalence was analyzed by age group, it was found that the prevalence of dyslipidemia gradually increased with age, and that adults in their 60s showed the highest prevalence of dyslipidemia (55.8%) (Fig. 6).
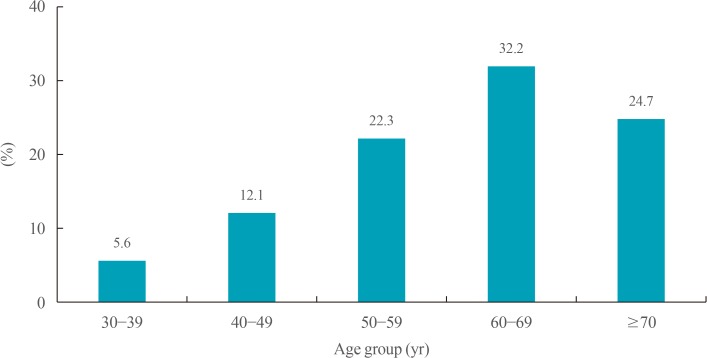 | Fig. 6Prevalence of dyslipidemia by age group in Korean adults. Dyslipidemia diagnosed in individuals who satisfied one of the three following criteria: a low-density lipoprotein cholesterol ≥160 mg/dL, a high-density lipoprotein cholesterol <40 mg/dL, or a triglyceride ≥200 mg/dL. Individuals taking any medications for dyslipidemia or who were previously diagnosed with dyslipidemia were also classified as having dyslipidemia. Modified from the guidelines of Korean Society of Lipid and Atherosclerosis [5].
|
The prevalence of high LDL-C was 17.6%, and it increased with age, from 5.6% in adults in their 30s to 32.3% in those in their 60s. Although the prevalence of high LDL-C in men in their 30s and 40swas higher than that in women belonging to the corresponding age groups, women showed a markedly increased prevalence in their 50s. Specifically, the prevalence of high LDL-C was six times higher in women in their 50s than in those in their 30s, which implies that the influence of postmenopausal status on LDL-C levels is tremendous. The prevalence of high LDL-C in women in their 60s (39.9%) was higher both than that of women in any other age group and the prevalence among men in the same age group.
In contrast, hypertriglyceridemia showed somewhat different features. The prevalence of hypertriglyceridemia was 17.5% in the total population, with a much higher prevalence in men than in women (24.8% vs. 11.0%). The highest prevalence of hypertriglyceridemia was observed in men in their 40s (30.5%), and this rate was four times higher than that of women in the same age group. As high TG levels are considered to be a marker of insulin resistance and are one of the components of metabolic syndrome, high TG levels in men in their 40s mean that they are at an increased risk for diabetes and metabolic syndrome [17]. Lifestyle interventions and education about weight control are warranted for men in this age group.
Insulin resistance causes shrinkage and degradation of HDL particle via the kidney, and low HDL-C levels are considered to be one of the components of metabolic syndrome [18]. HDL-C has anti-atherogenic effects, but HDL-C levels are not easily affected by lipid-lowering agents; instead, there is evidence suggesting that HDL-C levels are more strongly affected by genetic factors [19]. The prevalence of low HDL-C was found to be 19.4%, and the prevalence of low HDL-C was relatively weakly affected by age in men, as shown by a slight increase from 24.6% in men in their 30s to 30.9% in men after 70 years of age. However, in women, the prevalence steeply increased with age, from 6.8% in women in their 30s to 22.4% in women after 70 years of age. Although the absolute rate of low HDL-C is lower in women than in men, HDL-C levels seem to be more strongly affected by aging in women than in men.
Go to :
CONCLUSIONS
To summarize, prevalence of all risk factors significantly increased in Korea for the last 10 years. Among the risk factors, the increase in obesity was most noticeable, and this increase was accompanied by other risk factors related with insulin resistance, such as diabetes, hypertension and dyslipidemia. Of note, steady deterioration of metabolic risk factors in men in their 30s and 40s was so prominent that life style intervention and weight reduction in these working age groups are nationally warranted. Unexpectedly, women in their 50s and 60s showed relatively decreasing trend for obesity compared to other age groups, and men in the same age group. These finding could be partly attributed to economic growth of Korea in that women in these age can have spare time and money to take care of their health. Decreasing trend of prevalence of hypertension in women in these age groups support this hypothesis. Prevalence of diabetes show increasing trend and one in 7 Korean adults suffer from diabetes. Surprisingly, one in three Koreans in their 60s have diabetes, an alarm for healthcare burden in superaged Korean society. Fortunately, awareness and treatment rate steadily improved over the past 10 years for hypertension and hypercholesterolemia in Korean adults, although control rates are still low, especially for diabetes (Table 1).
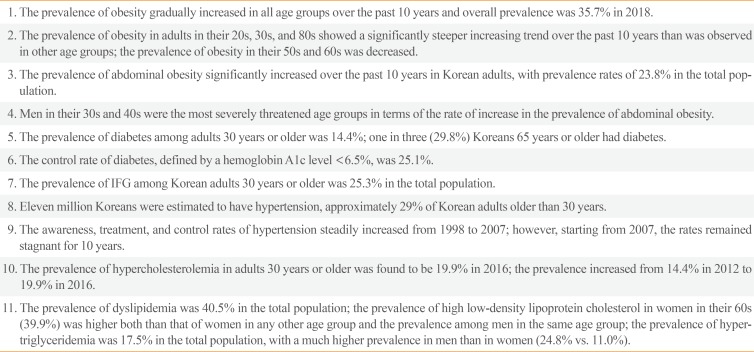
Table 1
Take Home Message from the Fact Sheets of Cardiovascular Risk Factors in Korea
![]()
The interactions between cardiovascular risk factors such as diabetes, hypertension, obesity, dyslipidemia and the events themselves cannot be separated in any circumstances. There is a tremendous amount of evidence proving the effectiveness of optimal control of risk factors on the prevention of CVD and resultant mortality. According to NHIS data, 2.6 million Koreans have both hypertension and dyslipidemia, 0.72 million have both diabetes and dyslipidemia, 0.64 million have both hypertension and diabetes, and 1.4 million have all three diseases (Fig. 7). Simultaneously having multiple of these risk factors exponentially increases cardiovascular risk compared to having only a single risk factor [1320].
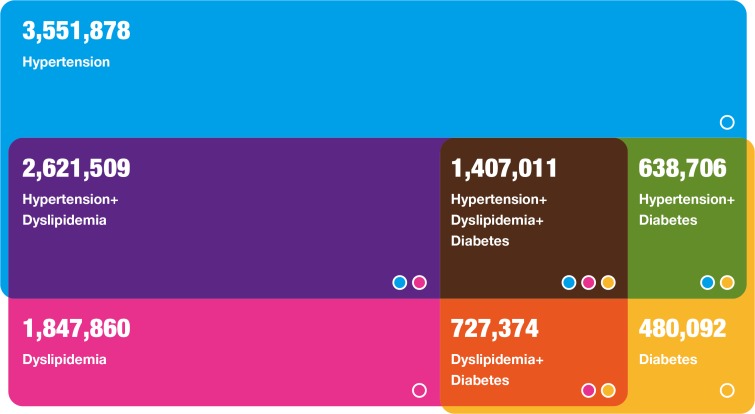 | Fig. 7Concurrent treatment of hypertension, diabetes, and dyslipidemia in Korean adults. Modified from the guidelines of Korean Diabetes Association [3].
|
As discussed in this review, hypertension and dyslipidemia can be relatively easily controlled by medications. However, despite a large number of novel anti-diabetic drugs, glycemic targets are still difficult to reach. Similarly, reducing body weight to combat obesity is an extremely difficult task for an obese person. However, if one were to ask about the best way to prevent or treat all these risk factors, I would recommend weight reduction above all other interventions. Education and the provision of accurate information on lifestyle modifications as early as possible in the life course may be the most effective way to prevent people from proceeding down the pathway that leads to CVD.
Go to :
 XML Download