Journal List > Endocrinol Metab > v.35(1) > 1144249

Jung, Rhee, Kwon, Chang, Ryu, and Lee: Visceral-to-Subcutaneous Abdominal Fat Ratio Is Associated with Nonalcoholic Fatty Liver Disease and Liver Fibrosis

Abstract

Background

We evaluated the association of visceral-to-subcutaneous fat ratio (VSR) with nonalcoholic fatty liver disease (NAFLD) and advanced fibrosis degree based on noninvasive serum fibrosis markers in the general population with NAFLD.

Methods

This is a cross-sectional study, in 7,465 Korean adults who underwent health screening examinations. NAFLD was defined as fatty liver detected on ultrasonography, and visceral and subcutaneous abdominal fat was measured using computed tomography. We predicted fibrosis based on the fibrosis-4 (FIB-4) score and aspartate aminotransferase-to-platelet ratio index (APRI) and categorized the risk for advanced fibrosis as low, indeterminate, or high.

Results

The multivariable-adjusted prevalence ratios for indeterminate to high risk of advanced fibrosis based on FIB-4, determined by comparing the second, third, and fourth quartiles with the first quartile of VSR, were 3.38 (95% confidence interval [CI], 0.64 to 17.97), 9.41 (95% CI, 1.97 to 45.01), and 19.34 (95% CI, 4.06 to 92.18), respectively. The multivariable-adjusted prevalence ratios for intermediate to high degree of fibrosis according to APRI also increased across VSR quartiles (5.04 [95% CI, 2.65 to 9.59], 7.51 [95% CI, 3.91 to 14.42], and 19.55 [95% CI, 9.97 to 38.34], respectively). High VSR was more strongly associated with the prevalence of NAFLD in nonobese subjects than in obese subjects, and the associations between VSR and intermediate to high probability of advanced fibrosis in NAFLD were stronger in obese subjects than in nonobese subjects.

Conclusion

High VSR values predicted increased NAFLD risk and advanced fibrosis risk with NAFLD, and the predictive value of VSR for indeterminate to high risk of advanced fibrosis was higher in obese subjects than in nonobese subjects.

INTRODUCTION

Nonalcoholic fatty liver disease (NAFLD) has become a leading cause of chronic liver disease, cirrhosis, type 2 diabetes mellitus (T2DM), and liver-related mortality [12]. In addition, the presence of NAFLD is associated with higher morbidity and mortality of cardiovascular disease (CVD) than the absence of NAFLD [3].The liver develops fibrosis as a wound-healing process after various kinds of liver injury [4]. Recently, emerging data have suggested that the degree of fibrosis in the presence of NAFLD is an important prognostic factor for future liver-related outcomes and mortality and is associated with the cardiometabolic risk [56].
Obesity is highly correlated not only with the NAFLD prevalence and but also with histologic severity [78]. It is well known that abdominal obesity, especially high visceral adipose tissue (VAT), plays an important role in the development of metabolic diseases and NAFLD independent of generalized obesity [79]. Previous studies have demonstrated that VAT is clearly associated with NAFLD. On the other hand, the role of subcutaneous adipose tissue (SAT) in NAFLD is controversial, in that some studies suggested no relationship between SAT and NAFLD [10], and others reported an inverse relationship [11121314]. Considering the independent effects of both VAT and SAT on the cardiometabolic risk, the relative distribution of body fat might be more important than VAT or SAT per se. Consequently, the visceral-to-subcutaneous fat ratio (VSR) has been proposed to be a better predictor of atherosclerosis and cardiometabolic risk not only in the asymptomatic general population and obese subjects but also in patients with T2DM [15161718]. However, there are few available studies about the contribution of VSR to NAFLD and liver fibrosis in the general population [14].
Further, although NAFLD is highly associated with obesity, it is also known to be prevalent in nonobese subjects [19]. A meta-analysis study demonstrated that lean and obese subjects with NAFLD share a common altered metabolic and cardiovascular profile [8]. Relative to lean individuals without NAFLD, the lean population with NAFLD showed an excess of abdominal adipose tissue [20]. In particular, studies showing whether body fat distribution, represented by VSR, has a diagnostic value in identifying multiple metabolic risk factors in nonobese subjects, compared with visceral fat area (VFA) and subcutaneous fat area (SFA), are rare. A previous study revealed that VSR showed superior diagnostic value in predicting multiple risk factors in subjects with normal waist circumference and proved that it was superior to VFA [15].
To our knowledge, few studies have examined whether the quartiles of VSR assessed using fat-computed tomography (CT) are associated with advanced fibrosis in the general population with NAFLD. We hypothesized that body fat distribution represented by VSR would indicate the risk for the presence of NAFLD and for advanced fibrosis in individuals with NAFLD. Therefore, we investigated the association of VSR quartiles measured using fat-CT with NAFLD and the probability of advanced fibrosis in the presence of NAFLD by using the fibrosis (FIB-4) score and aspartate aminotransferase (AST)-to-platelet (PLT) ratio index (APRI) in healthy Korean adults. In addition, we further analyzed this association according to the presence or absence of obesity.

METHODS

Study design and study participants

In this cross-sectional study, we recruited participants from the Kangbuk Samsung Health Study, a program of the Health Promotion Center of Kangbuk Samsung Hospital, Sungkyunkwan University School of Medicine, Seoul, Korea. The purpose of the medical health checkup program is to promote the health of employees through regular health examinations and to enable the early detection of diseases. Most of the examinees are employees of various industrial companies throughout the country, and their family members. The medical examinations are largely paid for by the employers, and a considerable proportion of the examinees undergo examinations annually or biennially.
The present analysis included participants who underwent fat-CT during the health checkup program between January 2013 and December 2017 (n=10,229). Of these 10,229 subjects, we excluded those with alcohol intake of ≥30 g/day for men or ≥20 g/day for women (n=1,574); use of steatogenic medications within the past year, such as valproate, amiodarone, methotrexate, tamoxifen, or corticosteroids (n=30); known liver disease or current use of medications for liver disease (n=297); positive serologic markers for hepatitis B virus or hepatitis C virus (n=288); history of liver cirrhosis or findings of liver cirrhosis on ultrasonography (n=2); and missing data on alcohol status, abdominal ultrasonography, body mass index (BMI), high-sensitivity C-reactive protein (hs-CRP), or homeostasis model assessment of insulin resistance (HOMA-IR) (n=2,771). Final analyses were performed in 7,465 subjects.
This study was approved by the Institutional Review Board of Kangbuk Samsung Hospital (KBSMC 2018-11-003), which waived the requirement for informed consent because we only retrospectively accessed a de-identified database for analysis purposes.

Diagnosis of NAFLD and measurement of abdominal fat area

All subjects underwent abdominal ultrasonography (Logic Q700 MR, GE, Milwaukee, WI, USA). Fatty liver was diagnosed according to standard criteria, including hepatorenal echo contrast, liver brightness, and vascular blurring on ultrasonography with a 3.5-MHz probe, which was conducted by experienced radiologists blinded to the aim of this study and the clinical status of the subjects [21]. NAFLD was defined as the detection of fatty liver in the absence of other etiologies of hepatic steatosis, as described in the exclusion criteria. Of the final 7,465 subjects, 2,706 were diagnosed with NAFLD on ultrasonography.
Abdominal VFA and SFA were measured by CT (a Lightspeed VCT XTe-64 slice Multi-detector CT scanner, GE Healthcare, Tokyo, Japan) [22]. A cross-sectional scan at 10 mm thickness centered at the L4-L5 vertebral disc space, with the subject in the supine position, was obtained using a radiograph of the skeleton as a reference to establish the position of the scans to the nearest millimeter. SFA and VFA boundaries were defined using a manual cursor by delineating these areas with a graph pen. The adipose tissue areas were calculated by computing the fat area surfaces with an attenuation range of −190 to −30 Hounsfield units. The abdominal VFA was measured by drawing a line in the muscle wall surrounding the abdominal cavity. The SFA was calculated by subtracting the VFA from the total fat area. Then the VSR was calculated.

Estimating the risk of advanced fibrosis in NAFLD

In subjects with NAFLD, FIB-4, and APRI as serum markers of fibrosis were used to estimate the degree of advanced fibrosis [23]. The FIB-4 score includes readily available clinical data of age, AST, alanine aminotransferase (ALT), and PLT, and was validated for use in NAFLD by Shah et al. [24]. The FIB-4 score was calculated using the following formula: FIB-4=[age (yr)×AST (IU/L)]/{[PLT (109/L)]×[ALT (IU/L)2]}. The cutoffs for low, intermediate, and high probability of advanced fibrosis were <1.3, 1.3 to 2.67, and >2.67, respectively. The APRI is another simple index for identifying patients with advanced fibrosis (≥F3) and was calculated using the following formula: APRI=[AST/AST (upper limit of normal)]/PLT (×109/L) [2526]. We used the cutoff of 0.5 for low probability and 1.5 for high probability of advanced fibrosis.

Covariates and baseline anthropometric and laboratory measurements

The values of serum biochemical parameters and physical measurements were obtained by trained staff during health examinations, and data on medical history, medication use, and health-related behaviors were collected through a self-administered questionnaire. BMI was calculated by dividing weight (kg) by the square of height (m2). Systolic blood pressure and diastolic blood pressure were measured three times with the subjects in a seated position and with a 1-minute rest between each measurement. The average of the second and third measurements was used in our analyses.
Blood samples were collected after 12 hours of overnight fasting. Fasting plasma glucose levels were determined through the hexokinase method (Modular D2400, Hitachi, Tokyo, Japan). An electrochemiluminescence immunoassay was used to assess fasting insulin levels (Modular E170, Hitachi). An enzymatic colorimetric test was used to measure the total cholesterol and triglyceride levels. The selective inhibition method was used to measure high density lipoprotein cholesterol levels, and a homogeneous enzymatic colorimetric test was used to measure low density lipoprotein cholesterol levels. ALT, AST, and gamma-glutamyltransferase were measured using Bayer Reagent Packs on an automated chemistry analyzer (Advia 1650 autoanalyzer, Bayer Diagnostics, Leverkusen, Germany). Serum hs-CRP levels were measured using a nephelometric assay with a BNII nephelometer (Dade Behring, Deerfield, IL, USA). Insulin resistance was measured using the HOMA-IR and was obtained by applying the following formula: HOMA-IR=fasting insulin (µIU/mL)×fasting blood glucose (mmol/L)/22.5 [27].
A smoker was defined as a subject who had smoked at least five packs of cigarettes over the course of the lifetime. Regular exercise was defined as moderate-intensity exercise at least three times every week.
Total energy and nutrient intake was calculated by using food composition table developed by the Korean Nutrition Society [28]. Education level and history of CVD were evaluated using self-reported questionnaire.
Hypertension was defined as systolic blood pressure ≥140 mm Hg, diastolic blood pressure ≥90 mm Hg, self-reported history of hypertension, or current use of antihypertensive medications. The presence of diabetes was defined as fasting plasma glucose level ≥126 mg/dL or hemoglobin A1c level ≥6.5%, a self-reported history of diabetes, or current use of antidiabetic medication [29].

Statistical analysis

The characteristics of the study participants were examined according to VSR quartiles. To test for linear trends, category numbers were used as continuous variables in regression models. The study population was grouped into quartiles of VSR, as follows: Q1 (<0.37), Q2 (0.37 to 0.51), Q3 (0.52 to 0.70), and Q4 (≥0.71).
To evaluate the association of NAFLD across quartiles of VSR, SFA, and VFA, we used Poisson regression with robust variance to estimate prevalence ratios (PRs) with 95% confidence intervals (CIs) for NAFLD. Models were initially adjusted for age and sex, and further adjusted for center (Seoul or Suwon), year of screening examination, smoking status (never, past, current, or unknown), physical activity, alcohol intake (0, <10, >10 g/day, or unknown), total energy intake (in quintile or unknown), education level, history of CVD, history of diabetes, and history of hypertension (model 1). To investigate whether this association was influenced by obesity or insulin resistance, we performed additional analysis with adjustment for BMI and HOMA-IR in model 2. We also estimated the PRs of NAFLD with the degree of fibrosis based on FIB-4 or APRI by VSR quartiles, by using multinomial logistic regression models as outcomes categorized into no NAFLD, NAFLD plus low FIB-4 or APRI, and NAFLD plus intermediate/high FIB-4 or APRI. Multivariable models 1 and 2 were adjusted with the same variables described above. To determine the linear trends of prevalence, the number of quartiles was used as a continuous variable and tested on each model.
We performed stratified analyses in prespecified subgroups defined by BMI (<25 kg/m2 vs. ≥25 kg/m2). Interactions between subgroups were tested using likelihood ratio tests comparing models with and without multiplicative interaction terms. All P values were two-tailed, and values of P<0.05 were considered statistically significant. We used STATA version 14.0 (Stata Corp., College Station, TX, USA) for data analysis.

RESULTS

General characteristics of the participants according to VSR quartiles

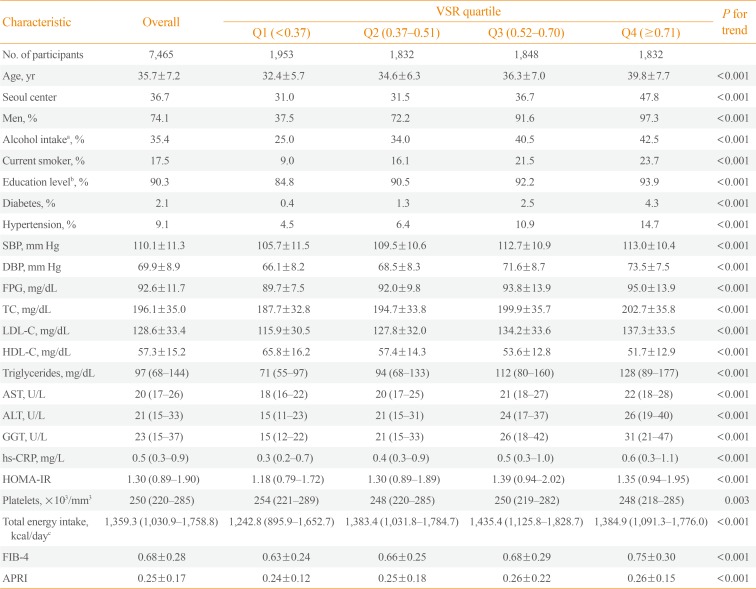
The total number of subjects was 7,465 (5,532 men and 1,933 women), and their mean age was 35.7 years (Table 1). The subjects were subdivided into four groups according to VSR quartiles. The baseline characteristics according to VSR quartiles are presented in Table 1.
The proportion of men, subjects with a history of diabetes, subjects with hypertension, and subjects with CVD significantly increased across VSR quartiles. BMI, insulin resistance, and the mean values of glucose and traditional and nontraditional cardiovascular risk factors (blood pressure, lipid profile, and hs-CRP) significantly increased across VSR quartiles. The AST level, ALT level, FIB-4, and APRI significantly increased across VSR quartile groups.

Risk of incident NAFLD across quartiles of VSR, SAT, and VAT

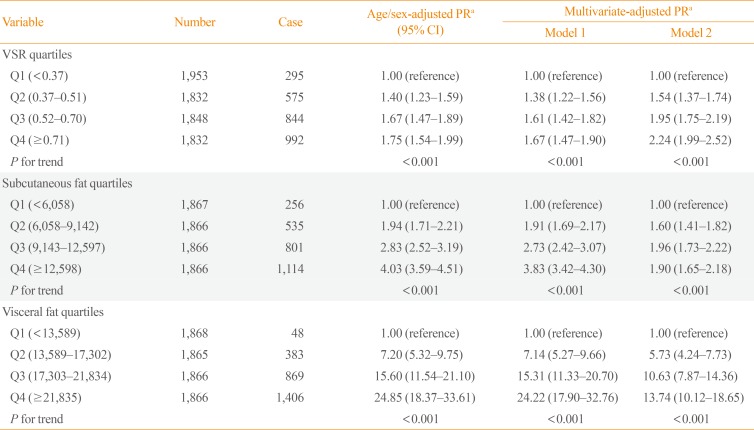
Of the total 7,465 subjects, 2,706 (36.2%) were diagnosed with NAFLD on ultrasonography. Table 2 presents the risk of incident NAFLD across the quartiles of VSR. In age- and sex-adjusted models, the PRs for NAFLD comparing Q2 to Q4 withQ1 of VSR were 1.4 (95% CI, 1.23 to 1.59), 1.67 (95% CI, 1.47 to 1.89), and 1.75 (95% CI, 1.54 to 1.99), respectively. After further adjusting for confounding variables including examination center, year of screening examination, smoking status, physical activity, alcohol intake, education level, history of CVD, history of diabetes, and history of hypertension, significantly increased PRs were sustained across the groups. The results were strengthened after additional adjustment for BMI and HOMA-IR (1.54 vs. 1.95 vs. 2.24). When the analyses were performed according to gender after excluding 151 subjects with diabetes, women showed higher PRs in all analyses compared with men, although the observed trends were similar (Supplemental Table S1).
The PRs of NAFLD were analyzed according to quartiles of SAT and VAT (Table 2). The prevalence of NAFLD also significantly increased across the quartiles of subcutaneous and visceral fat.

Prevalence of NAFLD and degree of fibrosis based on fibrosis scores according to VSR quartiles

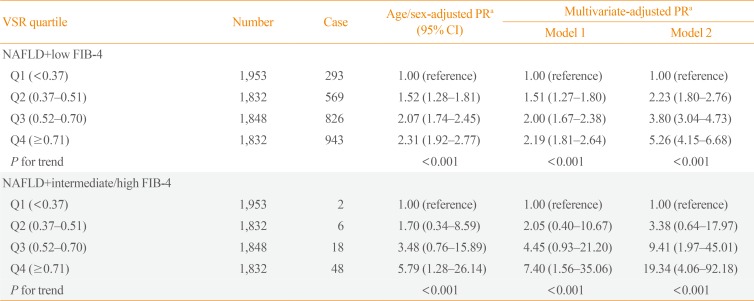
We assessed the degree of advanced fibrosis in subjects with NAFLD based on FIB-4 and APRI, and categorized the subjects into having a low, intermediate, or high probability of fibrosis. Table 3 shows the association between VSR quartiles and the degree of advanced fibrosis assessed by FIB-4 in NAFLD by using multinomial logistic regression. The age- and sex-adjusted PRs (95% CI) for NAFLD with low FIB-4 comparing Q2 to Q4 with Q1 of VSR increased steadily (1.51 [95% CI, 1.27 to 1.8], 2.0 [95% CI, 1.67 to 2.38], and 2.19 [95% CI, 1.81 to 2.64], respectively). This association also persisted even after further adjustment for the above-mentioned confounders in model 1 and for BMI and HOMA-IR (2.23 [95% CI, 1.8 to 2.76], 3.8 [95% CI, 3.04 to 4.73], and 5.26 [95% CI, 4.15 to 6.68], respectively). With respect to the PRs for NAFLD with intermediate or high FIB-4, the age- and sex-adjusted PRs substantially increased across VSR quartiles (1.7 [95% CI, 0.34 to 8.59] for Q2, 3.48 [95% CI, 0.76 to 15.89] for Q3, and 5.79 [95% CI, 1.28 to 26.14] for Q4, respectively). The results were strengthened after multivariable adjustment including model 1 plus BMI and HOMA-IR (19.34 [95% CI, 4.06 to 92.18] for Q4; P for trend <0.001).
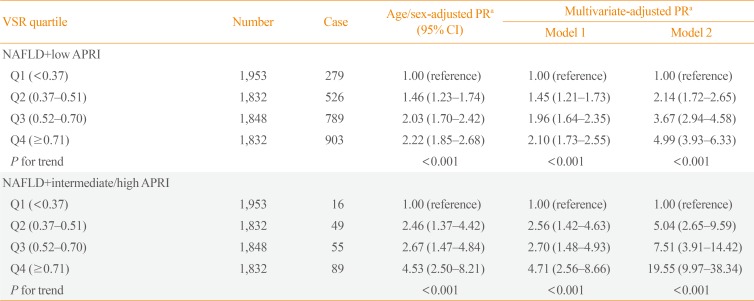
Table 4 shows the association between VSR quartiles and the degree of advanced fibrosis based on APRI in subjects with NAFLD. The results were similar to those based on FIB-4. The PRs (95% CI) for NAFLD with low APRI comparing Q2, Q3, and Q4 with Q1 of VSR moderately increased after multivariate covariate adjustment (1.45 [95% CI, 1.21 to 1.73], 1.96 [95% CI, 1.64 to 2.35], and 2.1 [95% CI, 1.73 to 2.55], respectively). This association persisted even after further adjustment for BMI and HOMA-IR (2.14 [95% CI, 1.72 to 2.65], 3.67 [95% CI, 2.94 to 4.58], and 4.99 [95% CI, 3.93 to 6.33], respectively). In addition, the risk for NAFLD with intermediate or high APRI significantly increased across VSR quartiles and was strengthened after further adjustments for BMI and HOMA-IR (5.04 [95% CI, 2.65 to 9.59], 7.51 [95% CI, 3.91 to 14.42], and 19.55 [95% CI, 9.97 to 38.34], respectively).

Prevalence of NAFLD and degree of fibrosis by VSR quartiles according to obesity

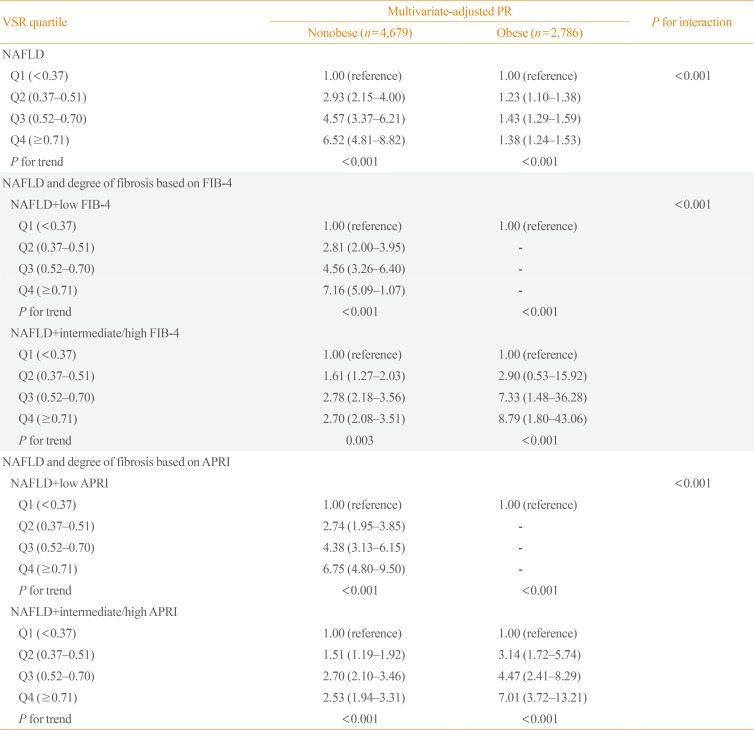
The association of VSR quartiles with NAFLD and the risk for advanced fibrosis was also examined by subgroups of study participants according to obesity (Table 5). These associations of VSR quartiles with NAFLD and the intermediate to high probability of advanced fibrosis in NAFLD were modified by obesity (P for interaction <0.01). High VSR values were more strongly associated with the prevalence of NAFLD in nonobese than in obese subjects. In addition, the associations between VSR values and the intermediate to high probability of advanced fibrosis assessed by FIB-4 in NAFLD were stronger in obese than in nonobese subjects. With respect to the PRs for advanced fibrosis based on APRI, the results were similar to those for FIB-4.

DISCUSSION

The results of the present cross-sectional study show that high VSR is an independent risk factor for the presence of NAFLD and advanced fibrosis even after adjustment for BMI and insulin resistance. In a subgroup analysis according to obesity, VSR was well associated with NAFLD even in nonobese subjects and the PR for NAFLD was higher in the nonobese than in the obese group. Concerning the probability of advanced fibrosis, higher VSR was more strongly associated with an intermediate to high probability of advanced fibrosis, especially in the obese group.
Previous epidemiologic, cross-sectional, and longitudinal studies demonstrated that VAT is clearly associated with NAFLD, whereas the role of SAT in NAFLD remains inconclusive [11]. Some studies showed that SAT is correlated with NAFLD, whereas others did not find this correlation [12]. However, there are few studies about the association of VSR and NAFLD and the degree of advanced fibrosis [1214]. In a study of 38 patients with biopsy-proven NAFLD by van der Poorten et al. [12], VSR assessed using magnetic resonance imaging also had an association with increasing fibrosis stage, although the extent of association was less than that of visceral fat. VSR has a moderate negative correlation with adiponectin and leptin but shares similar associations to visceral fat. In addition, subcutaneous fat is not associated with increasing steatosis, inflammation, or fibrosis, indicating its metabolically protective properties. Kim et al. [14] investigated the longitudinal association between VAT versus SAT and the incidence and regression of NAFLD in 2017 individuals who participated in a voluntary follow-up health screening with a 4.43-year of median follow-up. They showed that an increased VAT area was associated with a higher incidence of NAFLD and an increased SAT area was significantly associated with regression of NAFLD in multivariable analysis. Consistent with our study, their study showed that the VSR was strongly associated with incident NAFLD in the fully adjusted multivariate model. However, they did not investigate the association with fibrosis.
Obesity is highly correlated not only with NAFLD prevalence but also with histologic severity. In a systematic review and meta-analysis using cross-sectional data of patients with biopsy-proven nonalcoholic steatohepatitis (NASH) and those with no NASH, being overweight or obese was associated with more severe histologic features [8]. Although the mechanisms underlying the association between excessive adiposity or fat gain and the progression of fibrosis are not yet fully understood, insulin resistance and inflammation are believed to be involved [303132]. However, after adjustment for insulin resistance represented by HOMA-IR, the association between VSR and the risk of advanced fibrosis remained significant in the present study. Multiple other factors, including lipotoxicity, inflammatory attacks by proinflammatory cytokines, adipocytokines, and oxidative stress, may lead to the development of fibrosis in a substantial proportion of the population with NAFLD [3133].
In this study, higher VSR was significantly and independently associated with a higher risk of NAFLD development even after adjustment for confounders including BMI (as a simple indicator of obesity). In the subgroup analysis according to obesity, the predictive value of VSR for the risk of NAFLD was stronger in the nonobese group than in the obese group. The growing prevalence of NAFLD (around 8% to 19%) in lean Asians with BMI <25 kg/m2 has been reported, compared with the prevalence of −7% in the United States population [3435]. In a meta-analysis, lean and obese subjects with NAFLD showed similar altered metabolic and cardiovascular profiles [8]. Relative to lean subjects without NAFLD, the lean NAFLD population showed an excess of abdominal adipose tissue. In particular, studies on whether the body fat distribution (represented by VSR) has diagnostic value in identifying multiple metabolic risk factors in nonobese subjects, compared with VFA and SFA, are rare. One previous study revealed that VSR showed superior diagnostic value in predicting multiple risk factors in subjects with normal waist circumference, and proved that it is superior to VFA [15].
Whether nonobese individuals with NAFLD are protected from severe histologic outcomes is unknown. In our study, both nonobese and obese subjects with NAFLD exhibited a high risk of advanced fibrosis across VSR quartiles. Nonetheless, obese NAFLD subjects showed higher odds of having a higher risk for advanced fibrosis according to VSR quartiles than nonobese NAFLD subjects. Some previous studies reported findings similar to our results. A meta-analysis showed that overweight/obese NAFLD subjects based on BMI showed significantly higher fibrosis scores relative to lean subjects (BMI ≤25 kg/m2) with NAFLD [8]. Previously, our group evaluated the association of baseline BMI and weight change with fibrosis progression, determined by APRI, in a prospective large cohort study on NAFLD [36]. We found obesity and weight gain to be independently associated with an increased risk of fibrosis progression, from a low to an intermediate or a high probability of advanced fibrosis.
This study has several limitations. First, NAFLD and liver fibrosis were diagnosed using ultrasonography and calculated indices, not with biopsy. Furthermore, we could not consider the severity of NAFLD diagnosed with ultrasonography due to relative imperfectness of ultrasonography to diagnose fatty liver. Although liver biopsy is required for an accurate diagnosis and staging of liver fibrosis, it is not practical to perform liver biopsies in all low-risk individuals, because of several challenges such as sampling errors, intra-observer variations, invasiveness, and risk of complication [37]. Therefore, simple serum-based noninvasive scoring systems such as FIB-4 and APRI have been developed and validated to identify and exclude advanced fibrosis in patients with NAFLD, and have been proven to correlate well with liver histology [233839]. In addition, evidence for advanced fibrosis as determined using noninvasive scoring systems and markers is useful in predicting the increased risk of liver-related complications and cardiovascular mortality [4041]. Second, as this was a cross-sectional study, the causal relationship between VSR and NAFLD or advanced fibrosis in NAFLD cannot be determined. Third, the generalization of our findings may be limited by the study population comprising young and middle-aged healthy Koreans. Lastly, as the information regarding the menopausal status of the female participants were not accurate, we could not analyze the data of pre- and postmenopausal women separately. Although the strength of this study is the large sample size, we could not perform stratified subgroup analyses with the PR of the low risk of fibrosis according to VSR quartiles in the obese group because of the small number of obese subjects with a low risk of fibrosis.
In conclusion, we have demonstrated that VSR is associated with NAFLD and advanced fibrosis, based on FIB-4 or APRI, in subjects with NAFLD. This effect was independent of age, sex, insulin resistance, and obesity. In stratified analysis, VSR more strongly predicted the risk of NAFLD in the nonobese group than in the obese group. Additionally, the predictive value of VSR for intermediate to high risk of advanced fibrosis was higher in the obese group than in the nonobese group. Future large prospective studies are required to confirm the predictive value of VSR for NAFLD and advanced fibrosis in NAFLD in diverse populations.

Notes

CONFLICTS OF INTEREST: No potential conflict of interest relevant to this article was reported.

AUTHOR CONTRIBUTIONS:

  • Conception or design: E.J.R., S.R., W.Y.L.

  • Acquisition, analysis, or interpretation of data: C.H.J., E.J.R., Y.C., S.R., W.Y.L.

  • Drafting the work or revising: C.H.J., E.J.R.

  • Final approval of the manuscript: H.K., S.R., W.Y.L.

References

1. Chalasani N, Younossi Z, Lavine JE, Diehl AM, Brunt EM, Cusi K, et al. The diagnosis and management of non-alcoholic fatty liver disease: practice guideline by the American Gastroenterological Association, American Association for the Study of Liver Diseases, and American College of Gastroenterology. Gastroenterology. 2012; 142:1592–1609. PMID: 22656328.
crossref
2. Lee YH, Cho Y, Lee BW, Park CY, Lee DH, Cha BS, et al. Nonalcoholic fatty liver disease in diabetes. Part I: epidemiology and diagnosis. Diabetes Metab J. 2019; 43:31–45. PMID: 30793550.
crossref
3. Targher G, Day CP, Bonora E. Risk of cardiovascular disease in patients with nonalcoholic fatty liver disease. N Engl J Med. 2010; 363:1341–1350. PMID: 20879883.
crossref
4. Pinzani M. Pathophysiology of liver fibrosis. Dig Dis. 2015; 33:492–497. PMID: 26159264.
crossref
5. Ekstedt M, Hagstrom H, Nasr P, Fredrikson M, Stal P, Kechagias S, et al. Fibrosis stage is the strongest predictor for disease-specific mortality in NAFLD after up to 33 years of follow-up. Hepatology. 2015; 61:1547–1554. PMID: 25125077.
crossref
6. Angulo P, Kleiner DE, Dam-Larsen S, Adams LA, Bjornsson ES, Charatcharoenwitthaya P, et al. Liver fibrosis, but no other histologic features, is associated with long-term outcomes of patients with nonalcoholic fatty liver disease. Gastroenterology. 2015; 149:389–397. PMID: 25935633.
crossref
7. Li L, Liu DW, Yan HY, Wang ZY, Zhao SH, Wang B. Obesity is an independent risk factor for non-alcoholic fatty liver disease: evidence from a meta-analysis of 21 cohort studies. Obes Rev. 2016; 17:510–519. PMID: 27020692.
crossref
8. Sookoian S, Pirola CJ. Systematic review with meta-analysis: the significance of histological disease severity in lean patients with nonalcoholic fatty liver disease. Aliment Pharmacol Ther. 2018; 47:16–25. PMID: 29083036.
crossref
9. Janghorbani M, Salamat MR, Aminorroaya A, Amini M. Utility of the visceral adiposity index and hypertriglyceridemic waist phenotype for predicting incident hypertension. Endocrinol Metab (Seoul). 2017; 32:221–229. PMID: 28537054.
crossref
10. Gentile CL, Weir TL, Cox-York KA, Wei Y, Wang D, Reese L, et al. The role of visceral and subcutaneous adipose tissue fatty acid composition in liver pathophysiology associated with NAFLD. Adipocyte. 2015; 4:101–112. PMID: 26167414.
crossref
11. Park BJ, Kim YJ, Kim DH, Kim W, Jung YJ, Yoon JH, et al. Visceral adipose tissue area is an independent risk factor for hepatic steatosis. J Gastroenterol Hepatol. 2008; 23:900–907. PMID: 17995942.
crossref
12. Van der Poorten D, Milner KL, Hui J, Hodge A, Trenell MI, Kench JG, et al. Visceral fat: a key mediator of steatohepatitis in metabolic liver disease. Hepatology. 2008; 48:449–457. PMID: 18627003.
crossref
13. Narumi H, Yoshida K, Hashimoto N, Umehara I, Funabashi N, Yoshida S, et al. Increased subcutaneous fat accumulation has a protective role against subclinical atherosclerosis in asymptomatic subjects undergoing general health screening. Int J Cardiol. 2009; 135:150–155. PMID: 18593641.
crossref
14. Kim D, Chung GE, Kwak MS, Seo HB, Kang JH, Kim W, et al. Body fat distribution and risk of incident and regressed nonalcoholic fatty liver disease. Clin Gastroenterol Hepatol. 2016; 14:132–138. PMID: 26226099.
crossref
15. Oh YH, Moon JH, Kim HJ, Kong MH. Visceral-to-subcutaneous fat ratio as a predictor of the multiple metabolic risk factors for subjects with normal waist circumference in Korea. Diabetes Metab Syndr Obes. 2017; 10:505–511. PMID: 29270027.
crossref
16. Higuchi S, Kabeya Y, Kato K. Visceral-to-subcutaneous fat ratio is independently related to small and large cerebrovascular lesions even in healthy subjects. Atherosclerosis. 2017; 259:41–45. PMID: 28285092.
crossref
17. Fukuda T, Bouchi R, Takeuchi T, Nakano Y, Murakami M, Minami I, et al. Ratio of visceral-to-subcutaneous fat area predicts cardiovascular events in patients with type 2 diabetes. J Diabetes Investig. 2018; 9:396–402.
crossref
18. Wang Y, Chen F, Wang J, Wang T, Zhang J, Han Q, et al. The relationship between increased ratio of visceral-to-subcutaneous fat area and renal outcome in Chinese adults with type 2 diabetes and diabetic kidney disease. Can J Diabetes. 2019; 43:415–420. PMID: 30503868.
crossref
19. Pagadala MR, McCullough AJ. Non-alcoholic fatty liver disease and obesity: not all about body mass index. Am J Gastroenterol. 2012; 107:1859–1861. PMID: 23211853.
20. Feng RN, Du SS, Wang C, Li YC, Liu LY, Guo FC, et al. Lean-non-alcoholic fatty liver disease increases risk for metabolic disorders in a normal weight Chinese population. World J Gastroenterol. 2014; 20:17932–17940. PMID: 25548491.
crossref
21. Quinn SF, Gosink BB. Characteristic sonographic signs of hepatic fatty infiltration. AJR Am J Roentgenol. 1985; 145:753–755. PMID: 3898784.
crossref
22. Kim JA, Choi CJ, Yum KS. Cut-off values of visceral fat area and waist circumference: diagnostic criteria for abdominal obesity in a Korean population. J Korean Med Sci. 2006; 21:1048–1053. PMID: 17179685.
crossref
23. Cheah MC, McCullough AJ, Goh GB. Current modalities of fibrosis assessment in non-alcoholic fatty liver disease. J Clin Transl Hepatol. 2017; 5:261–271. PMID: 28936407.
crossref
24. Shah AG, Lydecker A, Murray K, Tetri BN, Contos MJ, Sanyal AJ, et al. Comparison of noninvasive markers of fibrosis in patients with nonalcoholic fatty liver disease. Clin Gastroenterol Hepatol. 2009; 7:1104–1112. PMID: 19523535.
crossref
25. Wai CT, Greenson JK, Fontana RJ, Kalbfleisch JD, Marrero JA, Conjeevaram HS, et al. A simple noninvasive index can predict both significant fibrosis and cirrhosis in patients with chronic hepatitis C. Hepatology. 2003; 38:518–526. PMID: 12883497.
crossref
26. Adams LA, George J, Bugianesi E, Rossi E, De Boer WB, van der Poorten D, et al. Complex non-invasive fibrosis models are more accurate than simple models in non-alcoholic fatty liver disease. J Gastroenterol Hepatol. 2011; 26:1536–1543. PMID: 21950746.
crossref
27. Matthews DR, Hosker JP, Rudenski AS, Naylor BA, Treacher DF, Turner RC. Homeostasis model assessment: insulin resistance and beta-cell function from fasting plasma glucose and insulin concentrations in man. Diabetologia. 1985; 28:412–419. PMID: 3899825.
28. Ahn Y, Kwon E, Shim JE, Park MK, Joo Y, Kimm K, et al. Validation and reproducibility of food frequency questionnaire for Korean genome epidemiologic study. Eur J Clin Nutr. 2007; 61:1435–1441. PMID: 17299477.
crossref
29. American Diabetes Association. 2. Classification and diagnosisof diabetes: standards of medical care in diabetes-2019. Diabetes Care. 019; 1. 42 Suppl 1:S13–S28. PMID: 30559228.
30. Angulo P, Machado MV, Diehl AM. Fibrosis in nonalcoholic fatty liver disease: mechanisms and clinical implications. Semin Liver Dis. 2015; 35:132–145. PMID: 25974899.
crossref
31. Boutari C, Perakakis N, Mantzoros CS. Association of adipokines with development and progression of nonalcoholic fatty liver disease. Endocrinol Metab (Seoul). 2018; 33:33–43. PMID: 29589386.
crossref
32. Moon YA. The SCAP/SREBP pathway: a mediator of hepatic steatosis. Endocrinol Metab (Seoul). 2017; 32:6–10. PMID: 28116873.
crossref
33. Neuschwander-Tetri BA. Hepatic lipotoxicity and the pathogenesis of nonalcoholic steatohepatitis: the central role of nontriglyceride fatty acid metabolites. Hepatology. 2010; 52:774–788. PMID: 20683968.
crossref
34. Fan JG, Kim SU, Wong VW. New trends on obesity and NAFLD in Asia. J Hepatol. 2017; 67:862–873. PMID: 28642059.
crossref
35. Younossi ZM, Stepanova M, Negro F, Hallaji S, Younossi Y, Lam B, et al. Nonalcoholic fatty liver disease in lean individuals in the United States. Medicine (Baltimore). 2012; 91:319–327. PMID: 23117851.
crossref
36. Kim Y, Chang Y, Cho YK, Ahn J, Shin H, Ryu S. Obesity and weight gain are associated with progression of fibrosis in patients with nonalcoholic fatty liver disease. Clin Gastroenterol Hepatol. 2019; 17:543–550. PMID: 30012432.
crossref
37. Sumida Y, Nakajima A, Itoh Y. Limitations of liver biopsy and non-invasive diagnostic tests for the diagnosis of nonalcoholic fatty liver disease/nonalcoholic steatohepatitis. World J Gastroenterol. 2014; 20:475–485. PMID: 24574716.
crossref
38. Vallet-Pichard A, Mallet V, Nalpas B, Verkarre V, Nalpas A, Dhalluin-Venier V, et al. FIB-4: an inexpensive and accurate marker of fibrosis in HCV infection: comparison with liver biopsy and fibrotest. Hepatology. 2007; 46:32–36. PMID: 17567829.
crossref
39. Kruger FC, Daniels CR, Kidd M, Swart G, Brundyn K, van Rensburg C, et al. APRI: a simple bedside marker for advanced fibrosis that can avoid liver biopsy in patients with NAFLD/NASH. S Afr Med J. 2011; 101:477–480. PMID: 21920102.
40. Angulo P, Bugianesi E, Bjornsson ES, Charatcharoenwitthaya P, Mills PR, Barrera F, et al. Simple noninvasive systems predict long-term outcomes of patients with nonalcoholic fatty liver disease. Gastroenterology. 2013; 145:782–789. PMID: 23860502.
crossref
41. Kim D, Kim WR, Kim HJ, Therneau TM. Association between noninvasive fibrosis markers and mortality among adults with nonalcoholic fatty liver disease in the United States. Hepatology. 2013; 57:1357–1365. PMID: 23175136.
crossref

SUPPLEMENTARY MATERIAL

Supplemental Table S1.

Prevalence Ratiosa (95% CI) of NAFLD by VSR or Visceral Fat or Subcutaneous Fat Quartiles According to Gender after Excluding 157 Subjects with Diabetes
enm-35-165-s001.pdf
Table 1

Baseline Characteristics by VSR Quartiles

enm-35-165-i001
Characteristic Overall VSR quartile
Q1 (<0.37) Q2 (0.37–0.51) Q3 (0.52–0.70) Q4 (≥0.71) P for trend
No. of participants 7465.0 1953.0 1832.0 1848.0 1832.0
Age, yr 35.7±7.2 32.4±5.7 34.6±6.3 36.3±7.0 39.8±7.7 <0.001
Seoul center 36.7 31.0 31.5 36.7 47.8 <0.001
Men, % 74.1 37.5 72.2 91.6 97.3 <0.001
Alcohol intakea, % 35.4 25.0 34.0 40.5 42.5 <0.001
Current smoker, % 17.5 9.0 16.1 21.5 23.7 <0.001
Education levelb, % 90.3 84.8 90.5 92.2 93.9 <0.001
Diabetes, % 2.1 0.4 1.3 2.5 4.3 <0.001
Hypertension, % 9.1 4.5 6.4 10.9 14.7 <0.001
SBP, mm Hg 110.1±11.3 105.7±11.5 109.5±10.6 112.7±10.9 113.0±10.4 <0.001
DBP, mm Hg 69.9±8.9 66.1±8.2 68.5±8.3 71.6±8.7 73.5±7.5 <0.001
FPG, mg/dL 92.6±11.7 89.7±7.5 92.0±9.8 93.8±13.9 95.0±13.9 <0.001
TC, mg/dL 196.1±35.0 187.7±32.8 194.7±33.8 199.9±35.7 202.7±35.8 <0.001
LDL-C, mg/dL 128.6±33.4 115.9±30.5 127.8±32.0 134.2±33.6 137.3±33.5 <0.001
HDL-C, mg/dL 57.3±15.2 65.8±16.2 57.4±14.3 53.6±12.8 51.7±12.9 <0.001
Triglycerides, mg/dL 97 (68–144) 71 (55–97) 94 (68–133) 112 (80–160) 128 (89–177) <0.001
AST, U/L 20 (17–26) 18 (16–22) 20 (17–25) 21 (18–27) 22 (18–28) <0.001
ALT, U/L 21 (15–33) 15 (11–23) 21 (15–31) 24 (17–37) 26 (19–40) <0.001
GGT, U/L 23 (15–37) 15 (12–22) 21 (15–33) 26 (18–42) 31 (21–47) <0.001
hs-CRP, mg/L 0.5 (0.3–0.9) 0.3 (0.2–0.7) 0.4 (0.3–0.9) 0.5 (0.3–1.0) 0.6 (0.3–1.1) <0.001
HOMA-IR 1.30 (0.89–1.90) 1.18 (0.79–1.72) 1.30 (0.89–1.89) 1.39 (0.94–2.02) 1.35 (0.94–1.95) <0.001
Platelets, ×103/mm3 250 (220–285) 254 (221–289) 248 (220–285) 250 (219–282) 248 (218–285) 0.003
Total energy intake, kcal/dayc 1,359.3 (1,030.9–1,758.8) 1,242.8 (895.9–1,652.7) 1,383.4 (1,031.8–1,784.7) 1,435.4 (1,125.8–1,828.7) 1,384.9 (1,091.3–1,776.0) <0.001
FIB-4 0.68±0.28 0.63±0.24 0.66±0.25 0.68±0.29 0.75±0.30 <0.001
APRI 0.25±0.17 0.24±0.12 0.25±0.18 0.26±0.22 0.26±0.15 <0.001

Values are expressed as mean±standard deviation, percentage, or median (interquartile range).

VSR, visceral-to-subcutaneous fat ratio; SBP, systolic blood pressure; DBP, diastolic blood pressure; FPG, fasting plasma glucose; TC, total cholesterol; LDL-C, low density lipoprotein cholesterol; HDL-C, high density lipoprotein cholesterol; AST, aspartate aminotransferase; ALT, alanine aminotransferase; GGT, gamma-glutamyltransferase; hs-CRP, high-sensitivity C-reactive protein; HOMA-IR, homeostasis model assessment of insulin resistance; FIB-4, fibrosis-4 score; APRI, aspartate aminotransferase-to-platelet ratio index; SD, standard deviation.

a≥10 g of ethanol per day; bCollege graduate or higher; cAmong 5,523 participants with plausible estimated energy intake (within 3 SDs of the log-transformed mean energy intake).

Table 2

Prevalence Ratiosa (95% CI) of Nonalcoholic Fatty Liver Disease by Quartiles of VSR, Subcutaneous Fat, and Visceral Fat

enm-35-165-i002
Variable Number Case Age/sex-adjusted PRa (95% CI) Multivariate-adjusted PRa
Model 1 Model 2
VSR quartiles
 Q1 (<0.37) 1,953 295 1.00 (reference) 1.00 (reference) 1.00 (reference)
 Q2 (0.37–0.51) 1,832 575 1.40 (1.23–1.59) 1.38 (1.22–1.56) 1.54 (1.37–1.74)
 Q3 (0.52–0.70) 1,848 844 1.67 (1.47–1.89) 1.61 (1.42–1.82) 1.95 (1.75–2.19)
 Q4 (≥0.71) 1,832 992 1.75 (1.54–1.99) 1.67 (1.47–1.90) 2.24 (1.99–2.52)
P for trend <0.001 <0.001 <0.001
Subcutaneous fat quartiles
 Q1 (<6,058) 1,867 256 1.00 (reference) 1.00 (reference) 1.00 (reference)
 Q2 (6,058–9,142) 1,866 535 1.94 (1.71–2.21) 1.91 (1.69–2.17) 1.60 (1.41–1.82)
 Q3 (9,143–12,597) 1,866 801 2.83 (2.52–3.19) 2.73 (2.42–3.07) 1.96 (1.73–2.22)
 Q4 (≥12,598) 1,866 1,114 4.03 (3.59–4.51) 3.83 (3.42–4.30) 1.90 (1.65–2.18)
P for trend <0.001 <0.001 <0.001
Visceral fat quartiles
 Q1 (<13,589) 1,868 48 1.00 (reference) 1.00 (reference) 1.00 (reference)
 Q2 (13,589–17,302) 1,865 383 7.20 (5.32–9.75) 7.14 (5.27–9.66) 5.73 (4.24–7.73)
 Q3 (17,303–21,834) 1,866 869 15.60 (11.54–21.10) 15.31 (11.33–20.70) 10.63 (7.87–14.36)
 Q4 (≥21,835) 1,866 1,406 24.85 (18.37–33.61) 24.22 (17.90–32.76) 13.74 (10.12–18.65)
P for trend <0.001 <0.001 <0.001

VSR, visceral-to-subcutaneous fat ratio; CI, confidence interval; PR, prevalence ratio.

aEstimated from Poisson regression with robust error. Multivariable model 1: age, sex, center, year of screening examination, smoking status, physical activity, alcohol intake, education level, history of cardiovascular disease, history of diabetes, and history of hypertension; model 2: model 1 plus adjustment for body mass index and homeostasis model assessment of insulin resistance.

Table 3

Prevalence Ratiosa (95% CI) of NAFLD and Degree of Fibrosis Based on FIB-4 Score by VSR Quartiles

enm-35-165-i003
VSR quartile Number Case Age/sex-adjusted PRa (95% CI) Multivariate-adjusted PRa
Model 1 Model 2
NAFLD+low FIB-4
 Q1 (<0.37) 1,953 293 1.00 (reference) 1.00 (reference) 1.00 (reference)
 Q2 (0.37–0.51) 1,832 569 1.52 (1.28–1.81) 1.51 (1.27–1.80) 2.23 (1.80–2.76)
 Q3 (0.52–0.70) 1,848 826 2.07 (1.74–2.45) 2.00 (1.67–2.38) 3.80 (3.04–4.73)
 Q4 (≥0.71) 1,832 943 2.31 (1.92–2.77) 2.19 (1.81–2.64) 5.26 (4.15–6.68)
P for trend <0.001 <0.001 <0.001
NAFLD+intermediate/high FIB-4
 Q1 (<0.37) 1,953 2 1.00 (reference) 1.00 (reference) 1.00 (reference)
 Q2 (0.37–0.51) 1,832 6 1.70 (0.34–8.59) 2.05 (0.40–10.67) 3.38 (0.64–17.97)
 Q3 (0.52–0.70) 1,848 18 3.48 (0.76–15.89) 4.45 (0.93–21.20) 9.41 (1.97–45.01)
 Q4 (≥0.71) 1,832 48 5.79 (1.28–26.14) 7.40 (1.56–35.06) 19.34 (4.06–92.18)
P for trend <0.001 <0.001 <0.001

CI, confidence interval; NAFLD, nonalcoholic fatty liver disease; FIB-4, fibrosis-4; VSR, visceral-to-subcutaneous fat ratio; PR, prevalence ratio.

aEstimated from multinomial logistic regression models as outcomes categorized as no NAFLD, NAFLD plus low FIB-4, and NAFLD plus intermediate/high FIB-4. Multivariable model 1 was adjusted for age, sex, center, year of screening examination, smoking status, physical activity, alcohol intake, total energy intake, education level, history of cardiovascular disease, history of diabetes, and history of hypertension; model 2: model 1 plus adjustment for body mass index and homeostasis model assessment of insulin resistance.

Table 4

Prevalence Ratiosa (95% CI) of NAFLD and Degree of Fibrosis Based on APRI by VSR Quartiles

enm-35-165-i004
VSR quartile Number Case Age/sex-adjusted PRa (95% CI) Multivariate-adjusted PRa
Model 1 Model 2
NAFLD+low APRI
 Q1 (<0.37) 1,953 279 1.00 (reference) 1.00 (reference) 1.00 (reference)
 Q2 (0.37–0.51) 1,832 526 1.46 (1.23–1.74) 1.45 (1.21–1.73) 2.14 (1.72–2.65)
 Q3 (0.52–0.70) 1,848 789 2.03 (1.70–2.42) 1.96 (1.64–2.35) 3.67 (2.94–4.58)
 Q4 (≥0.71) 1,832 903 2.22 (1.85–2.68) 2.10 (1.73–2.55) 4.99 (3.93–6.33)
P for trend <0.001 <0.001 <0.001
NAFLD+intermediate/high APRI
 Q1 (<0.37) 1,953 16 1.00 (reference) 1.00 (reference) 1.00 (reference)
 Q2 (0.37–0.51) 1,832 49 2.46 (1.37–4.42) 2.56 (1.42–4.63) 5.04 (2.65–9.59)
 Q3 (0.52–0.70) 1,848 55 2.67 (1.47–4.84) 2.70 (1.48–4.93) 7.51 (3.91–14.42)
 Q4 (≥0.71) 1,832 89 4.53 (2.50–8.21) 4.71 (2.56–8.66) 19.55 (9.97–38.34)
P for trend <0.001 <0.001 <0.001

CI, confidence interval; NAFLD, nonalcoholic fatty liver disease; APRI, aspartate aminotransferase-to-platelet ratio index; VSR, visceral-to-subcutaneous fat ratio; PR, prevalence ratio.

aEstimated from multinomial logistic regression models as outcomes categorized as no NAFLD, NAFLD plus low APRI, and NAFLD plus intermediate/high APRI. Multivariable model 1 was adjusted for age, sex, center, year of screening examination, smoking status, physical activity, alcohol intake, total energy intake, education level, history of cardiovascular disease, history of diabetes, and history of hypertension; model 2: model 1 plus adjustment for body mass index and homeostasis model assessment of insulin resistance.

Table 5

Prevalence Ratiosa (95% CI) of NAFLD or NAFLD and Degree of Fibrosis by VSR Quartiles According to Obesity

enm-35-165-i005
VSR quartile Multivariate-adjusted PR P for interaction
Nonobese (n=4,679) Obese (n=2,786)
NAFLD
 Q1 (<0.37) 1.00 (reference) 1.00 (reference) <0.001
 Q2 (0.37–0.51) 2.93 (2.15–4.00) 1.23 (1.10–1.38)
 Q3 (0.52–0.70) 4.57 (3.37–6.21) 1.43 (1.29–1.59)
 Q4 (≥0.71) 6.52 (4.81–8.82) 1.38 (1.24–1.53)
P for trend <0.001 <0.001
NAFLD and degree of fibrosis based on FIB-4
 NAFLD+low FIB-4 <0.001
  Q1 (<0.37) 1.00 (reference) 1.00 (reference)
  Q2 (0.37–0.51) 2.81 (2.00–3.95) -
  Q3 (0.52–0.70) 4.56 (3.26–6.40) -
  Q4 (≥0.71) 7.16 (5.09–1.07) -
  P for trend <0.001 <0.001
 NAFLD+intermediate/high FIB-4
  Q1 (<0.37) 1.00 (reference) 1.00 (reference)
  Q2 (0.37–0.51) 1.61 (1.27–2.03) 2.90 (0.53–15.92)
  Q3 (0.52–0.70) 2.78 (2.18–3.56) 7.33 (1.48–36.28)
  Q4 (≥0.71) 2.70 (2.08–3.51) 8.79 (1.80–43.06)
  P for trend 0.003 <0.001
NAFLD and degree of fibrosis based on APRI
 NAFLD+low APRI <0.001
  Q1 (<0.37) 1.00 (reference) 1.00 (reference)
  Q2 (0.37–0.51) 2.74 (1.95–3.85) -
  Q3 (0.52–0.70) 4.38 (3.13–6.15) -
  Q4 (≥0.71) 6.75 (4.80–9.50) -
  P for trend <0.001 <0.001
 NAFLD+intermediate/high APRI
  Q1 (<0.37) 1.00 (reference) 1.00 (reference)
  Q2 (0.37–0.51) 1.51 (1.19–1.92) 3.14 (1.72–5.74)
  Q3 (0.52–0.70) 2.70 (2.10–3.46) 4.47 (2.41–8.29)
  Q4 (≥0.71) 2.53 (1.94–3.31) 7.01 (3.72–13.21)
  P for trend <0.001 <0.001

CI, confidence interval; NAFLD, nonalcoholic fatty liver disease; VSR, visceral-to-subcutaneous fat ratio; PR, prevalence ratio; FIB-4, fibrosis-4; APRI, aspartate aminotransferase-to-platelet ratio index.

aEstimated from Poisson regression with robust error. The multivariable model was adjusted for age, sex, center, year of screening examination, smoking status, physical activity, alcohol intake, total energy intake, education level, history of cardiovascular disease, history of diabetes, and history of hypertension.

TOOLS
Similar articles