

 PDF
PDF ePub
ePub Citation
 Print
Print


INTRODUCTION
Chronic inflammatory demyelinating polyneuropathy (CIDP) is an acquired immune-mediated disease characterized by a progressive or relapsing-remitting disease for many months to years (123). It consists of primary demyelination of the proximal peripheral nerves, particularly affecting the nerve roots, as shown in autopsy studies (4). CIDP is most frequently present in adult men and has an annual incidence of 0.48 per 100000 people (5). The diagnosis of CIDP is imperative as this disease is treatable. However, it is difficult to make the diagnosis (167). Nerve conduction studies revealed conduction blocks or abnormal temporal dispersion in the intermediate segment of the nerve trunk but could not easily assess the proximal nerve damage (8). In some cases, invasive diagnostic measures, such as nerve biopsy, were required (9).
According to the 2010 European Federation of Neurological Societies (EFNS)/Peripheral Nerve Society (PNS) guidelines, magnetic resonance imaging (MRI) might facilitate the diagnosis of CIDP, presenting as contrast enhancement and hypertrophy of the cauda equine and plexus (10). Some studies described swelling of the plexus in patients with CIDP (1112). However, in these studies, only a single region was examined. A simultaneous examination of several regions, including the brachial and lumbosacral (LS) plexuses, extracranial branches of the cranial nerves, intercostal nerves, and cauda equina, is rarely performed to search for the reference site.
In addition, conventional MRI can only capture restricted regions of the peripheral nerve trunks, and therefore, it may be insufficient for identifying CIDP (11). The limited field of view (FOV) and insufficient background suppression of signals from the venous plexus, lymph node, and perineural muscles undermine the visualization of the peripheral nerves (131415) and impair the quality of images to visualize the nerve branches. As a result, the evidence of pathology in smaller nerves may be missed, and the distribution and true incidence of abnormally involved peripheral nerves may be underestimated.
In this study, we exploited large FOV three-dimensional (3D) MR neurography (MRN) to evaluate the distribution of hypertrophy and characteristics of the peripheral nerves in patients with CIDP and ascertained the rate of abnormalities of the peripheral nerves and relativity between the nerve diameter with clinical outcome measurement.
MATERIALS AND METHODS
Ethics Approval
The prospective study was approved by the ethics committee of our hospital and was registered on ClinicalTrials.gov. Written informed consent was obtained from all subjects.
Patients
From October 2015 to May 2019, 34 patients, who met the EFNS/PNS diagnostic criteria for CIDP, were recruited from the Neuromuscular Center of our hospital. The patients with Lewis-Sumner syndrome (n = 2) and with a pure motor variant of CIDP (n = 1) were excluded because of the small sample sizes for these cases. In addition, 21 healthy subjects from the staff at our institution were recruited. All healthy subjects were asymptomatic and/or were not receiving any drugs that could alter the sensory or motor functions. Table 1 shows the clinical characteristics of the enrolled patients. Exclusion criteria for both patients and controls were renal insufficiency, regional nerve surgery, metal in FOV, pregnancy, and any contraindication to MRI.
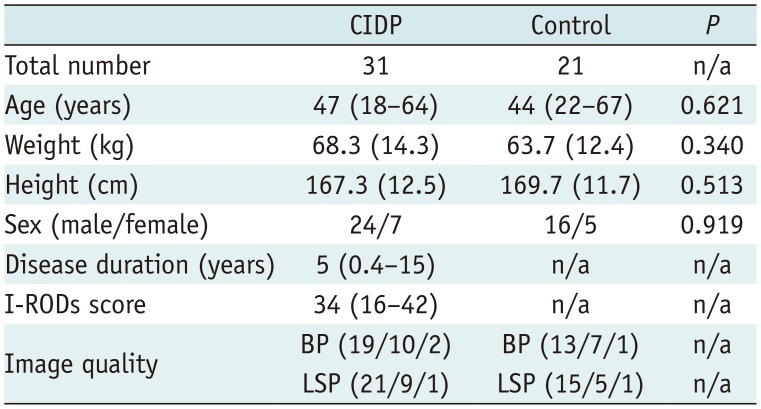
Table 1
Clinical Characteristics and Quality Assessments
![]()
Patient's Outcome Measurement
The inflammatory Rasch-built overall disability scale (I-RODS) questionnaire (Supplementary Table 1) was used to assess participation restrictions and activity limitations in patients with CIDP before MRI scans, which is an effective modality for outcome measurement (16). I-RODS is a 24-item scale, graded from easy to difficult (“reading a newspaper/book” was the easiest item; “running” was the most difficult item) (16). The medical history of all patients was acquired, and the questionnaire was filled individually.
MRI Technique
All scans were performed using a 3T MRI scanner (MAGNETOM Trio, Siemens Healthineers, Erlangen, Germany). Brachial and LS plexus neurography were performed with a four-channel neck coil, two multi-channel body matrix coils, and six elements of spine array coils covering the region from the skull base to the upper thigh. The 3D sampling perfection with application-optimized contrasts using different flip angle evolution (SPACE) sequence was performed in the coronal plane for the plexus. First, cauda equina plain imaging was performed through the T1- and T2-weighted turbo spin-echo (TSE) sequences in the sagittal plane. A macrocyclic gadolinium-based contrast agent (gadobutrol; Gadovist, Bayer Healthcare, Berlin, Germany) was injected intravenously at a dose of 0.1 mL/kg with a flow rate of 1.5 mL/s. Subsequently, T1-weighted TSE sequences to acquire the contrast-enhanced cauda equina images and 3D SPACE sequence were applied after the administration of the contrast agent. Table 2 shows the sequence parameters.
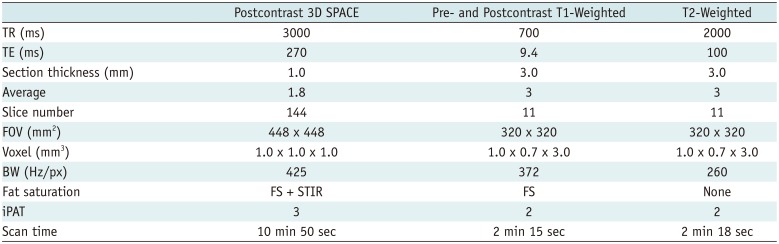
Table 2
Magnetic Resonance Sequence Parameters
BW = bandwidth, FOV = field of view, FS = frequency selective, iPAT = integrated parallel acquisition technique, Px = pixel, STIR = short T1 inversion recovery, TE = echo time, TR = repetition time, 3D SPACE = three-dimensional sampling perfection with application-optimized contrasts using different flip angle evolution
![]()
Image Processing and Analysis
The built-in post-processing software, 3D Syngo MR workspace (Siemens Healthineers) was used to reconstruct the maximum intensity projection (MIP) (slice thickness = 15 mm) images from 3D SPACE images. Two neuroradiologists (> 10 and 3 years of neuroimaging experience, respectively) were blinded to the clinical information and performed the initial qualitative and quantitative evaluations to MR images independently. One of the radiologists repeated the quantitative assessments after 8 weeks. All disagreements between the two radiologists over the qualitative assessment regarding the final conclusion were resolved by consensus.
Regarding the qualitative assessments, hypertrophy patterns of the brachial and LS plexuses, the extracranial branches of the cranial nerves, and the intercostal nerves were classified as follows: 1) uniform hypertrophy; 2) multifocal fusiform hypertrophy; 3) no hypertrophy, as described in a previous study (17); and (a) bilateral hypertrophy and (b) unilateral hypertrophy. Diffuse enlargement and/or contrast-enhancement of the cauda equina were recorded. Decreased signals of the peripheral nerves were recorded, similar to the “worm-like” cavity. The image quality was evaluated based on the degree and uniformity of fat suppression and degrees of motion and pulsation artifacts affecting the nerve visualization. It was scored on a scale of 1 to 3 (1, excellent; 2, good; 3, poor).
Regarding the quantitative assessments, the coronal MIP 3D SPACE images were used to measure the diameters of the brachial and LS nerve roots, which allowed the boundary to be clearly delineated between the peripheral nerve tissue and the adjacent background. The diameter at the bilateral C5–C8 and L4–S1 nerve roots were determined perpendicular to the long axes, 1.0 cm away from the dorsal root ganglia. Diameters of the bilateral sciatic and femoral nerves were determined at the upper edges of the femoral heads in the coronal and sagittal planes, respectively.
Statistical Analysis
Statistical analyses were performed using the GraphPad Prism 8.0 (GraphPad Software, San Diego, CA, USA) and SPSS statistical software, version 22 (IBM Corp., Armonk, NY, USA). Categorical variables are expressed as frequencies and proportions. The chi-square test was used to evaluate qualitative data. Non-normally distributed data are expressed as the median (M) and quartiles (Q1, Q3). The contingency table approach and Mann–Whitney U test were used to compare the demographic differences (sex and age). The Mann–Whitney U test was used to assess differences between the patients and controls. Wilcoxon's signed rank test was used to assess the difference in diameter between the left and right sides. Receiver operating characteristic analyses were used to evaluate the diagnostic efficiency and to identify the cut-off. Spearman's rank correlation test was used to detect the correlations between clinical data and MR parameters. Intraclass correlation coefficient (ICC) analyses were used to assess the interreader and intrareader consistencies (ICC value: 1, excellent, ≥ 0.75; 2, good, 0.60–0.74; 3, moderate, 0.40–0.59; 4, poor ≤ 0.39) (18). Two-tailed p values < 0.05 were regarded as statistically significant.
RESULTS
A total of 31 patients with CIDP and 21 controls were included. There were no significant differences in clinical characteristics between the patients and controls (Table 1). Table 1 shows the image qualities of MRN.
Descriptive Characteristics
The representative symmetrical and uniform signal intensities of the brachial and LS plexuses, with gradual fading of the signal along the course of the nerves, are presented for a healthy subject (Fig. 1). The ganglia presented low signal intensities similar to filling defects in both the healthy controls and patients with CIDP (arrows in Figs. 1, 2A), which was different from previous studies (1215). Uniform hypertrophy (type I) was commonly observed as diffuse symmetrical hypertrophy in the nerve roots, trunks, and branches (Figs. 2A, B, 3D, E). Multifocal fusiform hypertrophy (type II) appeared as multiple fusiform wheat-spike hypertrophy in patients with CIDP (Figs. 2C, D, 3F). Note that the neural stems exhibited characteristic worm-like cavities, regardless of hypertrophy type (arrows in Fig. 2B, D). One brachial plexus of patients with CIDP showed pronounced thickening of the distal nerves instead of the proximal nerve roots (Fig. 3A), which was different from the healthy peripheral nerves that gradually tapered in size distally.
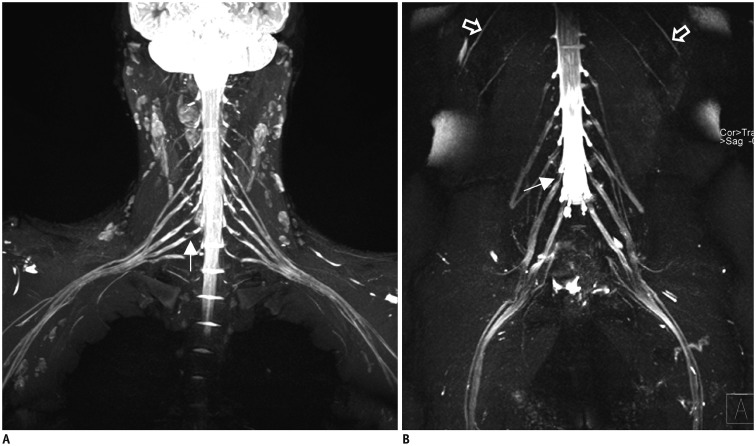
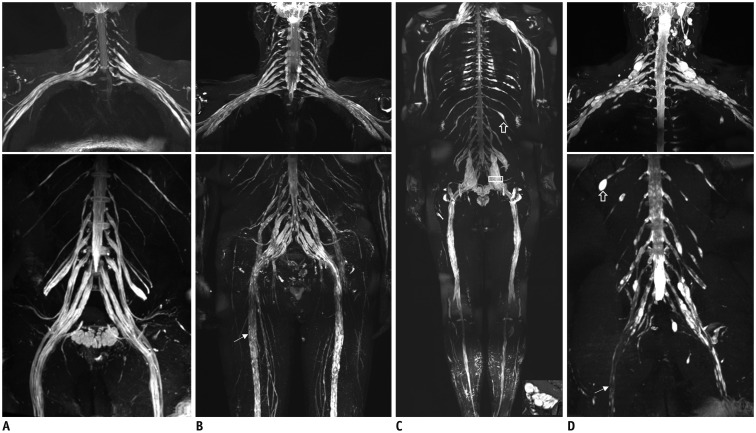
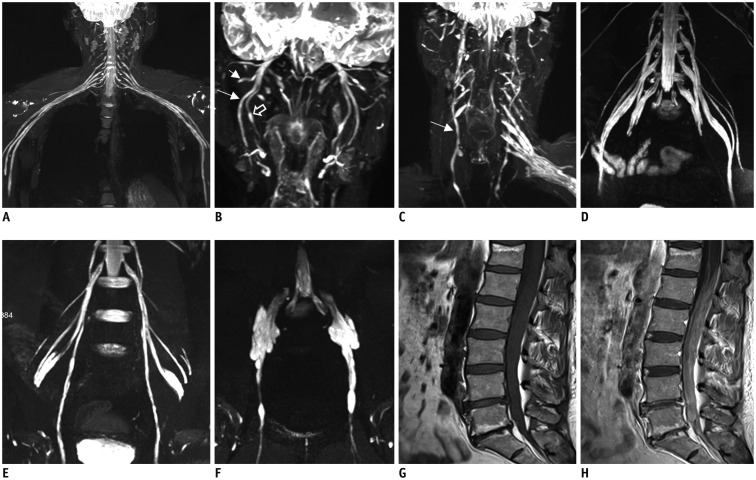
Fig. 1
Representative healthy subject of plexus.
Coronal reconstructed MIP 3D SPACE image of healthy subject showing expected symmetrical and uniform signal intensities of brachial (A), lumbosacral (B) plexus and intercostal nerves (open arrows in B), with gradual fading of signal along courses of nerves. Ganglia exhibit low signal intensities similar to filling defects (long arrows in A, B). MIP = maximum intensity projection, 3D SPACE = three-dimensional sampling perfection with application-optimized contrasts using different flip angle evolution
![]()
Fig. 2
Representative hypertrophy patterns and characteristic in CIDP patients with large field of view magnetic resonance neurography.
Patients (type I) with 5-year (A) and 3-year (B) disease courses, showed strikingly symmetric uniform enlargements in brachial and lumbosacral plexus with increased signal intensity. Patients (type II) with 7-year (C) and 6-year (D) relapsing-remitting courses, showed bilateral multiple fusiform wheat-spike hypertrophy in brachial and lumbosacral plexus, with irregular thickening in intercostal nerves (open arrows in C, D). Neural stems had characteristic signal reduction zone worm-like cavity in both type I (long arrow in B) and type II (long arrow in D) CIDP patients. CIDP = chronic inflammatory demyelinating polyneuropathy
![]()
Fig. 3
Representative abnormality of nerve branches in CIDP patients.
CIDP patient with 2-year disease courses (A), showed pronounced distal nerves trunk thickening not proximal to nerve roots. MIP 3D SPACE showed symmetrical hypertrophic hyperintense extracranial trigeminal branches (B), auriculotemporal nerves (short arrow), inferior alveolar nerves (long arrow), lingual nerves (open arrow), and bilateral vagus nerves (long arrow) (C). Images show bilateral hypertrophy of femoral (D) and obturator nerves (type I, E; type II, F). Images (G, H) show markedly thickened enhancement of cauda equina.
![]()
Qualitative Analysis
Nerve bilateral hypertrophy (a) was observed in the brachial plexus of 19 of 31 (61.3%) patients, in the LS plexus of 25 (80.7%) patients, and in none of the healthy controls. No unilateral hypertrophy (b) pattern of the peripheral nerves was found. The hypertrophy patterns of the nerve plexus were classified as follows: uniform hypertrophy (type I, 17 [54.8%] brachial plexuses and 21 [67.7%] LS plexuses) and multifocal fusiform hypertrophy (type II, 2 [6.5%] brachial plexuses and 4 [12.9%] LS plexuses) (Table 3). In two patients with CIDP of brachial and LS plexus, hypertrophy patterns were inconsistent. There was uniform thickening in the brachial plexus and multifocal fusiform thickening in the LS plexus. Worm-like cavities were found in the brachial plexus of two patients and in the LS plexus of four patients.
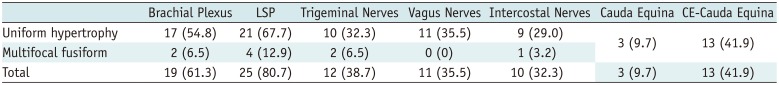
Table 3
Distribution and Patterns in CIDP Patients
![]()
Ten cases of intercostal nerves (32.3%) (Fig. 2C, D), eleven cases of extracranial vagus nerves (35.5%) (Fig. 3B), and twelve cases of extracranial trigeminal nerve branches (38.7%) (Fig. 3C) presented with symmetrical uniform or multifocal fusiform hypertrophy (Table 3). Enlarged cauda equina was shown on the plain MR images in 3 of 31 (9.7%) patients. Contrast-enhancement of the cauda equina was shown in 13 of 31 (41.9%) patients (Fig. 3G, H, Table 3). These abnormalities were not present in the healthy controls (Supplementary Fig. 1). Supplementary Table 2 shows the qualitative analysis at different anatomic locations.
Quantitative Analysis
There were no significant differences in the nerve diameters between the left and right sides for the CIDP and control groups (Supplementary Table 3). Diameters of the C5–C8 and L4–S1 nerve roots and sciatic and femoral nerves were significantly larger in patients with CIDP than in the healthy controls (all p < 0.001) (Table 4, Fig. 4).
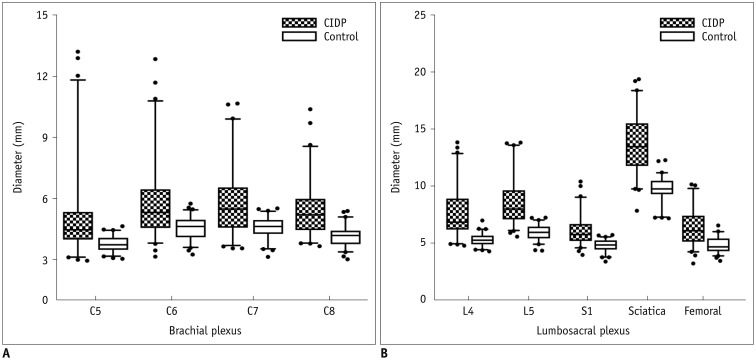
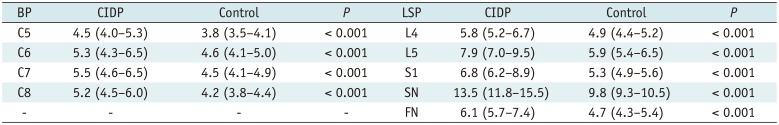
Fig. 4
Comparison of nerve diameters between CIDP and controls.
Diameters of brachial (C5–C8) (A) and lumbosacral (L4–S1) nerve roots and sciatic and femoral nerves (B) were significantly higher in patients with chronic inflammatory demyelinating polyneuropathy than in healthy controls (all p < 0.01).
![]()
Table 4
Diameters of Nerve Roots (mm) (Mann-Whitney U Test)
![]()
The sensitivity, specificity, cut-off, and area under the curve (AUC) for the C5–C8 and L4–S1 nerve roots and the sciatic and femoral nerves are summarized in Table 5. The largest AUC (0.942) was for the L5 nerve root in the LS plexus, of which the cut-off value, sensitivity, and specificity were 7.0 mm, 82.6%, and 96.8%, respectively (Fig. 5). There were no correlations between the course duration or I-RODS and the nerve diameters (Supplementary Table 4) and no correlations between the course duration and I-RODS (p = 0.834). No significant differences in the course duration or I-RODS were found between patients with CIDP with and without hypertrophy (Supplementary Table 5).
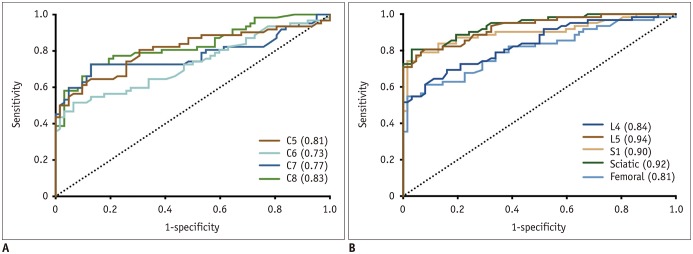
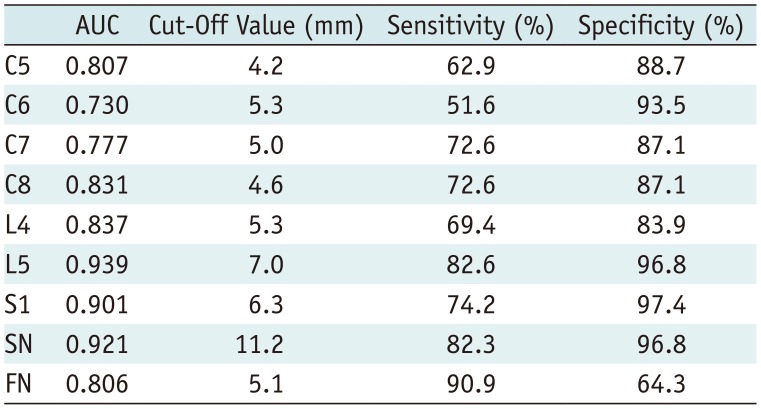
Fig. 5
Receiver operating characteristic plots showing curves for diameters of brachial (A) and lumbosacral (B) nerve roots.
AUCs of lumbosacral plexus were higher than those of brachial plexus. Largest AUC was L5 nerve root. Numbers in parentheses indicate respective AUC values. AUC = area under curve
![]()
Table 5
Receiver Operating Characteristic Curve Analysis for Nerves Diameter
![]()
Interreader and Intrareader Consistency
ICC values were 0.87 (95% confidence interval [CI], 0.70–0.93) to 0.94 (95% CI, 0.93–0.96) for intrareader and 0.83 (95% CI, 0.77–0.87) to 0.91 (95% CI, 0.88–0.93) for interreader in the CIDP and control groups (Supplementary Table 6). There were excellent interreader and intrareader consistencies for the diameter assessments in the brachial and LS plexuses.
DISCUSSION
In our study, the abnormal rates of hypertrophy and/or enhancement in the cauda equina were lower than those in the plexus. Furthermore, compared to the brachial plexus, the presence of hypertrophy in the LS plexus on MRN was more sensitive for the diagnosis of CIDP. Therefore, we recommend that LS neurography could be prioritized for imaging in the clinical practice. Additionally, we first revealed the existence of the vagus nerve involvement in CIDP. In this study, clinical outcome measurements or disease duration had no significant differences between the patients with and without hypertrophy and were both not associated with the degree of hypertrophy.
MRI of the extracranial segment of the cranial nerves or distal nerves of the plexus is challenging in that a large FOV is required. Additionally, sufficient background suppression is necessary in the neck and LS plexus regions, where abundant muscular and venous plexus structures are present (1319). Therefore, the contrast agent in this study was injected for two purposes: enhancing the cauda equina and improving the nerve-background contrast by using the paramagnetic effect to shorten the T2 relaxation time, as demonstrated previously (15). To avoid gadolinium deposition, a macrocyclic gadolinium-based contrast agent was adopted (20).
To the best of our knowledge, we are the first to find and describe symmetrical hypertrophy in the vagus nerves in patients with CIDP. The vagus nerve involvement may provide a potential explanation for the autonomic dysfunction symptoms in CIDP. Moreover, we described hypertrophy in the extracranial branches of the bilateral trigeminal nerve in patients with CIDP. Duarte et al. (21) first reported this disease in regions of the intracranial trigeminal nerve near the cavernous sinuses using plain brain MRI for a patient with CIDP. The reversed fast imaging with steady state free precession technique is a method of cranial nerve evaluation (22), and our findings suggested that contrast enhanced-3D SPACE also has the potential for visibility of the cranial nerves. In 2003, Oguz et al. (23) first reported diffuse enlargement of the intercostal nerves bilaterally in a patient with CIDP with a 10 year history. These pioneering works implied that MRI is a potential tool for CIDP diagnosis by scoping the tomographic abnormalities in the cranial and intercostal nerves. However, only a single case was reported in these studies.
In our study, we demonstrated that the peripheral nerves in patients with CIDP widely showed diffuse symmetrical uniform hypertrophy, and fewer patients presented with multifocal fusiform thickening, which was consistent with the findings of a study by Shibuya et al. (17), who evaluated the patterns of CIDP. According to previous reports, such hypertrophic changes in the nerves are attributable to the infiltration of the inflammatory cells, interstitial edema, and onion-bulb formation due to repeated demyelination and remyelination (24). Different patterns of nerve hypertrophy may reflect the developmental mechanisms of the demyelinating lesions. Some researchers have hypothesized that antibody-mediated demyelination is more likely to produce uniform hypertrophy while the breakdown of the blood–nerve barrier (BNB) mediated by cellular immunity may be important in producing multifocal fusiform hypertrophy (17). Interestingly, we found that in two patients with CIDP, the brachial and LS plexus hypertrophy patterns were inconsistent in the same patient. The underlying mechanism is to be explored in future studies. Furthermore, one patient did not exhibit a thickened brachial plexus but uniquely had hypertrophic median, radial, and ulnar nerves. The large FOV and sufficient background suppression, both of which we employed in our study, are even more crucial to accurately diagnose such an atypical presentation.
In both healthy controls and patients with CIDP, the dorsal root ganglia similarly exhibited low signal intensities similar to the filling defects. The reason for this unexpected similarity may be that the dorsal root ganglia, unlike the perineurium and the endoneurial vessels of the nerve trunk, is permeable to various low and high molecular weight contrasts (2526). In our study, MRN was obtained post-contrast enhancement whereas in the previous studies it had been obtained without contrast enhancement.
The nerve signal reduction and worm-eaten cavitation were detected in the thickened peripheral nerves of patients with CIDP, which may be due to increased permeability in BNB. BNB defines the intra-neural microenvironment of the peripheral nervous system, and its tight junctions block the diffusion of various tracers with large molecules, such as contrast agents (27). Previous studies showed that the permeability of BNB increased in patients with CIDP (2829). A recent in vitro study showed that incubating endothelial BNB cells with sera from patients with CIDP led to the decreased expression of claudin-5 proteins, the lack of which would possibly promote increased the barrier permeability (28). Another study revealed that the claudin-5 and ZO-1 proteins decreased in sural nerve biopsy specimens of patients with CIDP (29). The increased permeability may explain why, in some studies, the contrast agent produced the enhancement of peripheral nerves in patients with CIDP (3031). Moreover, the T2 signal intensity of the nerve tissue would be decreased when the contrast agent passes through BNB because of the T2 paramagnetic effect.
In this study, clinical outcome measurements and disease duration have no significant differences between the patients with and without hypertrophy and were not associated with the degree of hypertrophy. At present, there is no consensus on the correlation between the nerve size and clinical characteristic, disease course, or response to the treatment (323334). Once an onion bulb hypertrophy has formed, it rarely resorbs. In our results, more sensitive MR biomarkers other than the nerve size should be used for future clinical trials and follow-up studies in these conditions.
In our study, the median diameters of the C6 and C7 nerve roots were 4.4 and 4.5 mm in the healthy controls, respectively, which were slightly larger than that (3.8 and 3.7 mm, respectively) in 20 cadavers without neurological disease in an anatomical study (35). One possibility of this discrepancy may be that measurements on MR images are often larger than their actual anatomical size because of the high signal from the dura mater and cerebrospinal fluid. Another possibility is that the peripheral nerves shrink due to post-mortem water loss, which would explain the smaller nerve diameters found on autopsy.
There are several limitations to this study. First, our study did not include other variants of CIDP due to the small sample size. Second, the number of non-uniform multiple fusiform hypertrophy plexuses was relatively small, which restricted further analyses between different patterns with clinical data. Third, the 3D SPACE sequence takes longer and may be vulnerable to motion artifacts. Therefore, acceleration techniques should be developed for high resolution imaging of peripheral nerves in the future. Finally, functional quantitative assessments, such as diffusion tensor imaging, were not applied.
In conclusion, large-FOV MRN is useful in imaging the complex anatomy of the plexus over long trajectories and extracranial nerve branches, which helps assess the distribution and characteristics of peripheral nerves in CIDP. LS plexus imaging is recommended for evaluating the abnormal peripheral nerves in CIDP.
 XML Download