

 PDF
PDF ePub
ePub Citation
 Print
Print


INTRODUCTION
Magnetic resonance (MR) contrast-enhanced myocardial perfusion imaging (MPI) can assess the extent and distribution of ischemia (123). In comparison to single-photon emission CT or positron emission tomography, the established methods for clinical evaluation of myocardial perfusion, MR MPI offers superior spatial resolution with the potential to visualize sub-endocardial defects, and does not involve ionizing radiation. The capability of localizing sub-endocardial defects is of great clinical value since the sub-endocardial layer is the first to be damaged by coronary artery stenosis. Clinical studies evaluating MR MPI have reported high diagnostic sensitivity (88–98%), but relatively low specificity (71–82%), which hampers its widespread clinical use (45678). This bias is believed to result from the so-called dark rim artifact (DRA) that produces artifactually low signal intensity at the interface between the left ventricle lumen (LV) and the myocardium, potentially leading to a false positive diagnosis (910).
Several potential causes of DRA have been studied to date, but the relative contributions of putative sources remain to be further investigated. Gibbs' ringing has been widely acknowledged as a source of DRA. Due to the truncation by a rectangular window in k-space, intensity difference between LV and the myocardium produces a signal dip right outside the LV. The extent of this signal dip decreases as spatial resolution increases, which motivates the need for the use of high spatial resolution in MPI (911). Cardiac motion is also believed to contribute to the appearance of the DRA. Theoretical and simulation studies using one-dimensional (1D) motion models have confirmed the presence of a dark band along the phase-encoding direction (1213). The transient local susceptibility change induced by the contrast agent passage was also believed to contribute to the artifact (1415). Ferreira et al. (16) reported a frequency offset ranging from −69 to 85 Hz across the myocardium under typical scan protocols (single dose of contrast agent, 2.4 ms echo time [TE], and 1.5T field strength), which is too weak to cause DRA by intra-voxel dephasing. All of these hypothetical sources can and do contribute to the DRA, complicating its complete analysis.
We present evidence of yet another potential source of perceived DRA, which is associated with a visual illusion caused by the physiology of human visual processing. While the aforementioned sources (Gibbs' ringing, motion, susceptibility) generate a band of quantitatively reduced signal intensity, the artifact induced by the visual illusion is a perceptual phenomenon and related to the way that perfusion images are displayed. The presence of the perceived DRA is demonstrated using numerical phantom and in-vivo perfusion data displayed using different color maps.
MATERIALS AND METHODS
Mach Band Illusion
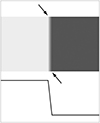
In a mammalian eye, the retinal ganglion cells (RGCs) which constitute the outputs of the retina exhibit a center-surround receptive field structure (17). The excitation of RGC is monotonically related to the difference in light intensity between the center and surround portion of the receptive field. For example, a ganglion cell with an on-center off-surround receptive field structure generates a vigorous response when a small spot of light is positioned at the center of the receptive field and surrounded by relative darkness (17). If the spotlight area is enlarged to cover both the center and surrounding regions, the cell's spike rate can plummet to levels nearly as low as those measured when there is no light impacting its receptive field. This center-surround response characteristic, often approximated as a Laplacian derivative operator, transmits the difference in light intensity between adjacent regions while remaining relatively insensitive to the actual level of intensity (18). This emphasis in representing contrast over raw intensity in the early stages of visual processing is believed to be responsible for an illusory edge enhancement effect known as the Mach band (19). Mach band appears when two luminance levels are connected by a ramp (Fig. 1). Illusory bright and dark bands are perceived at the two inflection points, despite the absence of a corresponding signal overshoot and undershoot. It should be noted that Mach band is more prominent in achromatic (luminance) contrast than in chromatic contrast (20).
Numerical Phantom
Dynamic numerical phantom was used to investigate the perception of the dark rim. The phantom consisted of LV, myocardium, and the right ventricle lumen (RV) with circular or elliptical shapes implemented by corresponding Fourier transforms in k-space. Assuming conditions mimicking cardiac diastolic phase, the phantom had transmural myocardial thickness of 1 cm and spatial resolution of 2.8 mm2, which translates to a myocardial thickness of 3.6 pixels. Twenty dynamics were generated to simulate the first pass of a contrast agent from RV through LV and myocardium. Perfusion curves in the three compartments were based on an in-vivo first-pass perfusion scan performed in this study. The effect of motion and susceptibility-induced intra-voxel dephasing were excluded from the analysis. The image was 5-fold interpolated by k-space zero-padding to avoid the variability of the dark rim based on the sub-pixel location of LV-myocardium interface (21). Image smoothing was also applied to suppress Gibbs' ringing effect using the Hann windowing in k-space. The window size was adjusted to suppress the actual quantitative signal dip.
The images were rendered either in conventional gray scale or in color scales with reduced luminance variation over the entire intensity range. The luminance of the red, green, blue (RGB) vector can be calculated by an empirical formula (22): 0.3R + 0.59G + 0.11B, which assumes that the mapping between R, G, and B signal levels to the luminance of the output is linear. Two simple color scales were used,
where x is normalized image intensity ranging from 0 to 1, with 1 being the highest intensity measured across all time frames. Since the mapping from RGB signal levels to luminance outputs is nonlinear for computer monitors, Equations [1] and [2] often do not result in an iso-luminant chromatic scale. Nevertheless, the resulting color scales exhibit a significantly reduced variation in luminance.
In-vivo Perfusion Images
First-pass perfusion images were acquired from two healthy volunteers (both male, age 41 and 55 years) on a Signa 3T scanner (GE Healthcare, Milwaukee, WI, USA) with an 8-channel cardiac receiver coil. The study protocol was approved by the institutional ethics committee and informed consent was obtained from both participants. The imaging protocol was designed to minimize the effects of motion and susceptibility changes, leaving Gibbs' ringing as the dominant source of DRA. To minimize motion effects, subjects were instructed to hold their breaths at least until peak myocardial enhancement stage (around 20th cardiac cycle) and data were acquired only during mid-diastole. To reduce susceptibility effects, half of the clinical dose of contrast agent (0.05 mmoL/kg) and smallest possible TE (1.0–1.2 ms) were used. The other imaging parameters were TSR = 120 ms, repetition time = 2.8–3.2 ms, readout band-width = 62.25–125 kHz, flip angle = 12°, spatial resolution = 2.5 × 3.0–3.2 mm2, and slice thickness = 8 mm. Rate-2 adaptive sensitivity encoding incorporating temporal filtering (TSENSE) method was used for image reconstruction (23). Perfusion images at 9th (peak LV enhancement), 14th, and 19th (peak myocardium enhancement) cardiac cycles were selected for the analysis of DRA. After sinc interpolation and k-space windowing, the images were displayed on the same gray and color scales used in the numerical phantom study. Six transmural segments perpendicular to the LV-myocardium border were manually selected to investigate the quantitative intensity profiles.
RESULTS
Numerical Phantom
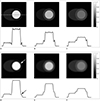
Figure 2 presents the grayscale images of the heart phantom at three representative time frames, before (top row) and after (bottom row) smoothing through k-space windowing. Corresponding signal intensity profiles across the horizontal line at the center are shown at the bottom of each image. The original images prior to smoothing exhibit a dark rim caused by Gibbs' ringing. After k-space windowing, the quantifiable signal dip is removed at all time frames, as validated by the negative finite difference values (i.e., monotonically decreasing) across the LV-myocardium interface, ranging from −1.07 to −0.14. The dark band that appears in the processed image is a Mach band, which is a visual illusion.
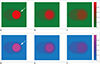
The intensity of illusory DRA varies slightly with the spatial position across the myocardium, as well as with the time of acquisition relative to the contrast injection. At peak LV enhancement (Fig. 2D), the dark rim is more intensely perceived around the lateral wall compared to the septal wall, presumably due to larger difference in intensity relative to the neighboring area (background versus RV). The dark rim is less strongly perceived at peak myocardial enhancement (Fig. 2F) than at the two earlier time frames (Fig. 2D, E), due to smaller difference in intensity between the LV and myocardium. Figure 3 shows the k-space windowed phantom images at the same time frames, but displayed using the two color scales defined as Equations [1] and [2]. The illusory dark band perceived in Figure 2 is eliminated due to the reduced luminance variation in the color maps used.
In-vivo Perfusion Images
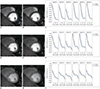
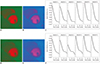
Figure 4 presents illustrative in-vivo perfusion images at peak LV enhancement (9th time frame; Fig. 4A, B), myocardial enhancement (19th frame; Fig. 4G, H), and an intermediate time frame (14th frame; Fig. 4D, E). Also shown are the corresponding intensity profiles across the LV-myocardium interface (Fig. 4C, F, and I, respectively). The original images before smoothing (1st column) exhibit a signal dip at the boundary between LV and myocardium, which is at least partially due to Gibbs' ringing. After smoothing, a dark rim is still perceived along the inferior and lateral walls. However, the corresponding transmural intensity profiles demonstrate effective suppression of the quantitative signal dip, suggesting that the perceived dark rim is a visual illusion. The dark rim is perceived as less intense at the time of peak myocardial enhancement (3rd row) compared to the earlier two time frames (1st and 2nd rows), due to reduced difference in intensity between the LV and myocardium. Figure 5 displays the same images as Figure 4B (Fig. 5A, B) and Figure 4E (Fig. 5C, D) using the same two color scales used in the phantom study, along with corresponding intensity profiles along the six transmural segments (Fig. 5E, F). The illusory dark rim may be notably less intense compared to Figure 4. As a trade-off, perceived spatial resolution is also reduced.
DISCUSSION
We demonstrate that the perception of DRA can be a result of visual illusion, in addition to other known causes. Numerical heart phantom and in-vivo images were shown to exhibit an illusory dark rim in the absence of a quantitative signal dip after image smoothing. While this study has focused on the presence of illusory perception of DRA, it should be noted that there are other known sources of the DRA, including Gibbs' ringing and cardiac motion. All of these causes must be addressed to completely eliminate DRA in first-pass MR MPI.
Approaches to Confirming Illusory DRA
Whether an observed sub-endocardial defect is illusory or true can be determined by quantitatively investigating the intensity profiles in the suspected regions. In this study, several transmural segments were manually selected and their intensity profiles were plotted over time. This approach, however, is not a practical solution to managing imaging artifacts, since the profile along a line of one-pixel thickness could be sensitive to noise and it would be time-consuming to specify multiple closely spaced segments to increase the analysis accuracy. Instead, it may be worthwhile to develop an image analysis tool which the user can use to specify a short azimuthal segment along the LV-myocardium border and obtain an averaged intensity profile within the region of interest.
Another potential approach to identifying the illusory dark rim is to use the color scales with near-isoluminance for image display. Color scales with reduced luminance variation can remove the largest Mach band illusion, as shown by the two simple color maps used for confirming the illusory dark rim. However, human vision is less sensitive to contrast defined along color dimensions than along the luminance dimension, which is used in the conventional gray scale (24). This will result in a reduction in perceived spatial resolution, possibly degrading the sensitivity of detecting true small defects. In general, a color map can be represented by a 1D trajectory in a three-dimensional (3D) color space defined by one luminance and two color dimensions. Finding the best trajectory that eliminates Mach band while retaining a high spatial resolution for human vision remains a worthwhile research question. Challenges in such optimization include the high degrees of freedom within the 3D search space, and possible individual differences in perceived spatial resolution and sensitivity to illusory dark rim. It should also be noted that the degree of dark rim perceived on color-coded images may vary between individuals, and the use of color maps should be considered a supplementary tool rather than an objective solution.
Dependence on Wall Location and Contrast Uptake
First-pass perfusion images typically contain two rapid signal transitions (from LV to myocardium, and from myocardium to void background), each of which is similar to the linear ramp shown in Figure 1. The first transition from LV to myocardium produces an illusory dark rim in the inner layer of the myocardium, and the second transition produces an illusory bright rim in the outer layer of the myocardium. The adjacency of the two illusory rims renders the perceived endocardial dark rim stronger, possibly due to another form of visual illusion known as simultaneous contrast (25). The anterior and lateral walls appear to be more vulnerable to illusory DRA than other locations, since they border a void area. Conversely, when septal wall intensity happens to be similar to RV intensity (as in Fig. 2D), a small bright rim can be perceived in the epicardial layer, mitigating the perceived intensity of the endocardial dark rim.
The perceived intensity of the Mach band generally increases with the intensity difference across the transient ramp and the slope of the ramp (19). This property makes the strength of illusory DRA dependent on the timing of contrast agent uptake in each compartment. For example, at peak myocardial enhancement (Figs. 2F, 3F), the intensity difference between LV and myocardium is relatively small, and the illusive DRA is weak compared to earlier time frames after peak LV enhancement. This implies a potential utility of evaluating the time course of the myocardial signal, which is available nowadays within most vendor-supplied or third-party cardiac analysis software. Since the signal-time curve wouldn't be affected by a visual illusion, simple display or calculation of the semi-quantitative index (such as the upslope) may serve as an additional solution for perceived DRA.
In conclusion, visual illusion is another potential cause of perceived DRA in contrast-enhanced MP MRI, as demonstrated by the perception of an illusory rim in the absence of an actual quantitative intensity undershoot. The perceived strength of DRA varies with time and spatial position within the myocardium during the first pass. These findings suggest the need for complementary ways to display images and quantitative plots of signal profiles, in addition to removing established sources of quantitative dark rim, such as Gibbs' ringing and cardiac motion.
 XML Download