

 PDF
PDF ePub
ePub Citation
 Print
Print


INTRODUCTION
Functional assessment of the right ventricle (RV) is a determinant of the treatment plan and prognosis in various clinical settings (123). In addition to the ejection fraction (EF), volumetric parameters of RV, such as end-diastolic volume (EDV), end-systolic volume (ESV), and stroke volume (SV), are important clinical indicators, for example, to determine the optimal operating time and predict the postoperative outcome of patients with repaired tetralogy of Fallot and to diagnose arrhythmogenic right ventricular dysplasia (345).
The complex geometry of the RV makes reliable measurement of RV volume challenging (67), and echocardiography is often suboptimal for RV assessment. Cardiac magnetic resonance imaging (CMRI) is the gold standard to evaluate RV volume and function with high reproducibility (8). However, CMRI has limitations in patients with poor compliance for long scan times or contraindications to CMRI (9). With the recent improvements in the temporal and spatial resolution of computed tomography (CT) scanners, cardiac CT can be used to assess RV volume and function (10). Previous studies that compared CT measurements of RV volume and function with CMRI as the reference standard showed variable results regarding the agreement between cardiac CT and CMRI (611121314151617181920212223242526272829). These variable results may be attributable to the differences in RV segmentation methods in cardiac CT and MRI; for example, two-dimensional (2D)- vs. three-dimensional (3D)-based methods, manual vs. semiautomatic vs. automatic segmentation, and threshold-based segmentation vs. simplified contouring (30313233). Considering the clinical significance of RV volume and function, factors affecting the difference and agreement of the measured values on CT and CMRI should be identified through a meta-analysis.
Therefore, the purpose of this meta-analysis was to evaluate the agreement of cardiac CT with CMRI in the assessment of RV volume and functional parameters.
MATERIALS AND METHODS
Our methods followed the Preferred Reporting Items for Systematic Reviews and Meta-Analyses recommendations (34).
Literature Search
A systematic search of the PubMed, EMBASE, and Cochrane library databases was performed to identify relevant studies published till January 9, 2019. Supplementary Materials lists the searched terms.
Study Selection
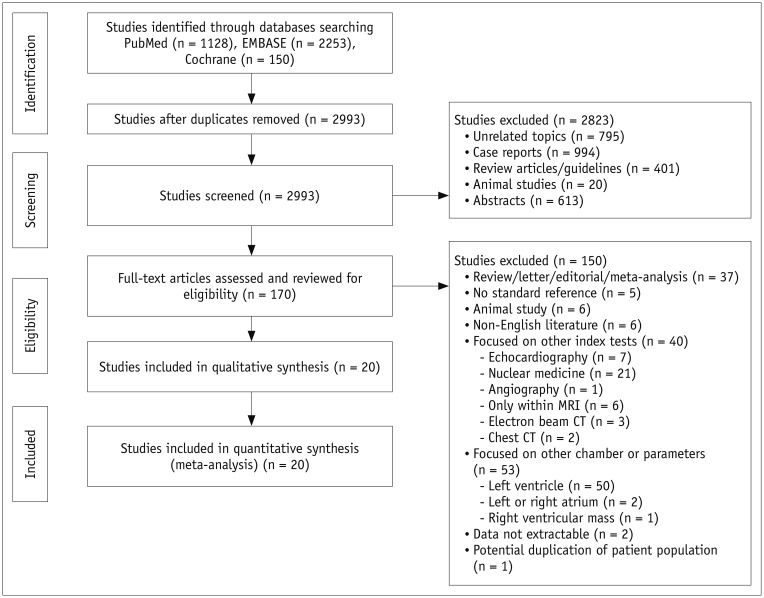
The articles were independently reviewed by two authors experienced in meta-analyses (4 and 7 years of experience in cardiothoracic radiology). Figure 1 summarizes the literature search process. The inclusion criterion used at the full-text level was a comparison of CT with CMRI as the standard reference in at least one of the following parameters of RV function: EF, EDV, ESV, or SV. The exclusion criteria were the absence of CMRI and other reference standards for RV measurement, use of an index test other than CT, assessment of a cardiac chamber other than RV, incomplete dataset, animal studies, non-English language, potential duplication of patient population, and manuscript format other than original article.
Data Extraction
Data were independently extracted by two investigators. The extracted parameters were: 1) article information and demographic characteristics; 2) acquisition protocol for CT and CMRI: number of CT slices, electrocardiogram (ECG)-gating method during CT, contrast administration protocol in CT (RV-dedicated [triphasic or split-bolus technique] or non-RV-dedicated), reconstruction interval of RR on CT, CMRI scanner type (3 tesla [T] or 1.5T), acquisition sequence for cine image on CMRI; 3) analysis method for RV function: details of the segmentation methods (2D with Simpson's method vs. 3D, manual vs. semiautomatic vs. automatic, threshold-based vs. simplified contouring, inclusion vs. exclusion of trabeculation or papillary muscle in the RV cavity), reconstructed slice thickness, and analysis software tool; 4) study outcomes: results of the Bland–Altman test (bias with 1 or 1.96 standard deviation [SD]) and correlation coefficient between CT and CMRI for EDV, ESV, SV, and EF.
Quality Assessment
The modified Quality Assessment of Diagnostic Accuracy Studies-2 (QUADAS-2) tool was used to assess the study quality (35). Two independent investigators reviewed studies for quality assessment and reached consensus through discussion.
Statistical Analysis
RV parameters measured with CT were compared with CMRI as the standard reference. For each study, bias (mean difference) was calculated by subtraction of the mean of each parameter measured by CT and CMRI, and limits of agreement (LOA) was defined as the SD of the mean difference multiplied by 1.96. The pooled bias and 95% LOA from the included studies were estimated based on the method proposed by DerSimonian and Laird (36). Pooled estimates of the bias and the SD for the difference were obtained on the basis of the random-effects model, after which 95% LOA was obtained by the method in Williamson et al. (37). The pooled correlation coefficient was analyzed using the inverse variance-weighted method in the DerSimonian–Laird random-effects model. If the results were presented in subgroups in the study, the average bias of the group was used, and the correlation coefficient of each subgroup was integrated by Fisher's -z-transformation method (37). Meta-analysis results of bias and LOA for each parameter were drawn as a modified forest plot, in which each circle indicated a study, with the circle size representing the weight (sample size and variance) of each study. Results of pooled correlation coefficients of each parameter were drawn as a forest plot. Heterogeneity was assessed using chi-squared-based Q statistics and I2 statistics (3638). For subgroup analysis of factors affecting the agreement in RV measurement, differences in the degree of heterogeneity for correlation coefficients between subgroups were assessed using the Cochran's Q test, and the influencing factors were analyzed using a meta-regression analysis. Publication biases were assessed using the Egger's test and drawn as funnel plots (3940). The analysis was performed using R (Version 3.5.2, R Foundation for Statistical Computing, Vienna, Austria) with the meta package (41).
RESULTS
Study Characteristics
After the study selection process, a total of 766 patients from 20 studies were included in the meta-analysis (611121314151617181920212223242526272829). EDV and ESV were analyzed in all 20 studies, and SV and EF were analyzed in 15 and 19 studies, respectively. Table 1 and Supplementary Table 1 summarize the study characteristics and details of image acquisition and RV analysis method in the included studies. The radiation dose from cardiac CT was 2.7–20 mSv in the ten included studies (11151620212224252627).
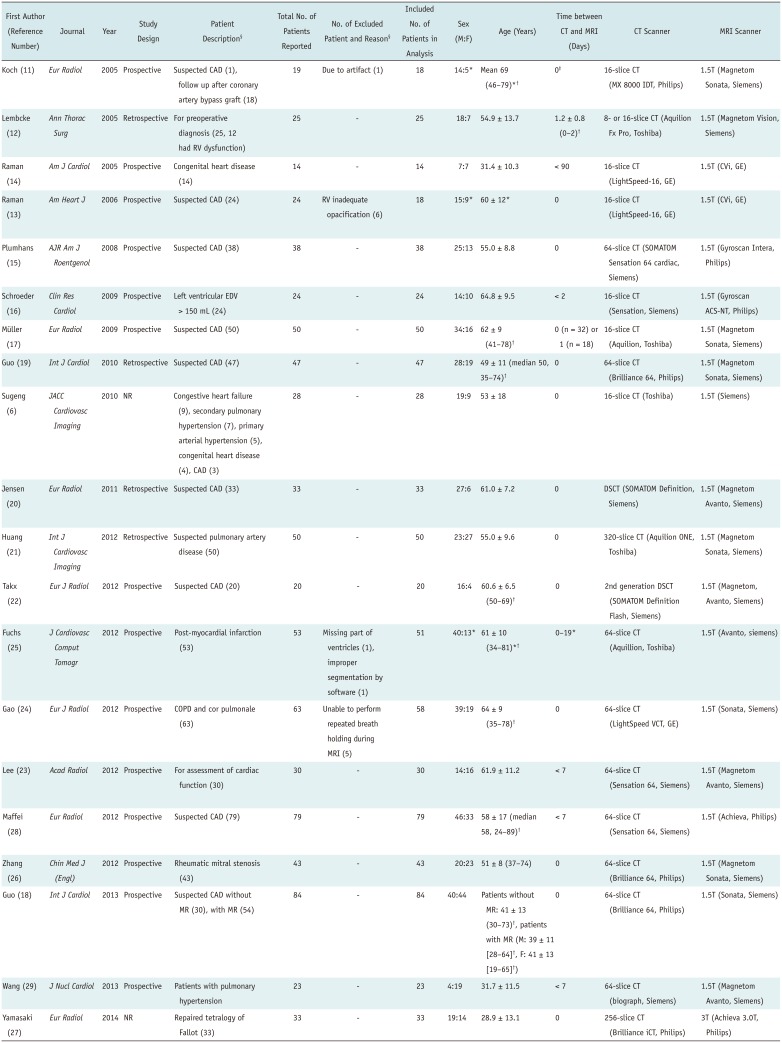
Table 1
Study Characteristics
| First Author (Reference Number) | Journal | Year | Study Design | Patient Description§ | Total No. of Patients Reported | No. of Excluded Patient and Reason§ | Included No. of Patients in Analysis | Sex (M:F) | Age (Years) | Time between CT and MRI (Days) | CT Scanner | MRI Scanner |
|---|---|---|---|---|---|---|---|---|---|---|---|---|
| Koch (11) | Eur Radiol | 2005 | Prospective | Suspected CAD (1), follow up after coronary artery bypass graft (18) | 19 | Due to artifact (1) | 18 | 14:5* | Mean 69 (46–79)*† | 0‡ | 16-slice CT (MX 8000 IDT, Philips) | 1.5T (Magnetom Sonata, Siemens) |
| Lembcke (12) | Ann Thorac Surg | 2005 | Retrospective | For preoperative diagnosis (25, 12 had RV dysfunction) | 25 | - | 25 | 18:7 | 54.9 ± 13.7 | 1.2 ± 0.8 (0–2)† | 8- or 16-slice CT (Aquilion Fx Pro, Toshiba) | 1.5T (Magnetom Vision, Siemens) |
| Raman (14) | Am J Cardiol | 2005 | Prospective | Congenital heart disease (14) | 14 | - | 14 | 7:7 | 31.4 ± 10.3 | < 90 | 16-slice CT (LightSpeed-16, GE) | 1.5T (CVi, GE) |
| Raman (13) | Am Heart J | 2006 | Prospective | Suspected CAD (24) | 24 | RV inadequate opacification (6) | 18 | 15:9* | 60 ± 12* | 0 | 16-slice CT (LightSpeed-16, GE) | 1.5T (CVi, GE) |
| Plumhans (15) | AJR Am J Roentgenol | 2008 | Prospective | Suspected CAD(38) | 38 | - | 38 | 25:13 | 55.0 ± 8.8 | 0 | 64-slice CT (SOMATOM Sensation 64 cardiac, Siemens) | 1.5T (Gyroscan Intera, Philips) |
| Schroeder (16) | Clin Res Cardiol | 2009 | Prospective | Left ventricular EDV > 150 mL (24) | 24 | - | 24 | 14:10 | 64.8 ± 9.5 | < 2 | 16-slice CT (Sensation, Siemens) | 1.5T (Gyroscan ACS-NT, Philips) |
| Müller (17) | Eur Radiol | 2009 | Prospective | Suspected CAD (50) | 50 | - | 50 | 34:16 | 62 ± 9 (41–78)† | 0 (n = 32) or 1 (n = 18) | 16-slice CT (Aquilion, Toshiba) | 1.5T (Magnetom Sonata, Siemens) |
| Guo (19) | Int J Cardiol | 2010 | Retrospective | Suspected CAD (47) | 47 | - | 47 | 28:19 | 49 ± 11 (median 50, 35–74)† | 0 | 64-slice CT (Brilliance 64, Philips) | 1.5T (Magnetom Sonata, Siemens) |
| Sugeng (6) | JACC Cardiovasc Imaging | 2010 | NR | Congestive heart failure (9), secondary pulmonary hypertension (7), primary arterial hypertension (5), congenital heart disease (4), CAD (3) | 28 | - | 28 | 19:9 | 53 ± 18 | 0 | 16-slice CT (Toshiba) | 1.5T (Siemens) |
| Jensen (20) | Eur Radiol | 2011 | Retrospective | Suspected CAD (33) | 33 | - | 33 | 27:6 | 61.0 ± 7.2 | 0 | DSCT (SOMATOM Definition, Siemens) | 1.5T (Magnetom Avanto, Siemens) |
| Huang (21) | Int J Cardiovasc Imaging | 2012 | Retrospective | Suspected pulmonary artery disease (50) | 50 | - | 50 | 23:27 | 55.0 ± 9.6 | 0 | 320-slice CT (Aquilion ONE, Toshiba) | 1.5T (Magnetom Sonata, Siemens) |
| Takx (22) | Eur J Radiol | 2012 | Prospective | Suspected CAD (20) | 20 | - | 20 | 16:4 | 60.6 ± 6.5 (50–69)† | 0 | 2nd generation DSCT (SOMATOM Definition Flash, Siemens) | 1.5T (Magnetom, Avanto, Siemens) |
| Fuchs (25) | J Cardiovasc Comput Tomogr | 2012 | Prospective | Post-myocardial infarction (53) | 53 | Missing part of ventricles (1), improper segmentation by software (1) | 51 | 40:13* | 61 ± 10 (34–81)*† | 0–19* | 64-slice CT (Aquillion, Toshiba) | 1.5T (Avanto, siemens) |
| Gao (24) | Eur J Radiol | 2012 | Prospective | COPD and cor pulmonale (63) | 63 | Unable to perform repeated breath holding during MRI (5) | 58 | 39:19 | 64 ± 9 (35–78)† | 0 | 64-slice CT (LightSpeed VCT, GE) | 1.5T (Sonata, Siemens) |
| Lee (23) | Acad Radiol | 2012 | Prospective | For assessment of cardiac function (30) | 30 | - | 30 | 14:16 | 61.9 ± 11.2 | < 7 | 64-slice CT (Sensation 64, Siemens) | 1.5T (Magnetom Avanto, Siemens) |
| Maffei (28) | Eur Radiol | 2012 | Prospective | Suspected CAD (79) | 79 | - | 79 | 46:33 | 58 ± 17 (median 58, 24–89)† | < 7 | 64-slice CT (Sensation 64, Siemens) | 1.5T (Achieva, Philips) |
| Zhang (26) | Chin Med J (Engl) | 2012 | Prospective | Rheumatic mitral stenosis (43) | 43 | - | 43 | 20:23 | 51 ± 8 (37–74) | 0 | 64-slice CT (Brilliance 64, Philips) | 1.5T (Magnetom Sonata, Siemens) |
| Guo (18) | Int J Cardiol | 2013 | Prospective | Suspected CAD without MR (30), with MR (54) | 84 | - | 84 | 40:44 | Patients without MR: 41 ± 13 (30–73)†, patients with MR (M: 39 ± 11 [28–64]†, F: 41 ± 13 [19–65]†) | 0 | 64-slice CT (Brilliance 64, Philips) | 1.5T (Sonata, Siemens) |
| Wang (29) | J Nucl Cardiol | 2013 | Prospective | Patients with pulmonary hypertension | 23 | - | 23 | 4:19 | 31.7 ± 11.5 | < 7 | 64-slice CT (biograph, Siemens) | 1.5T (Magnetom Avanto, Siemens) |
| Yamasaki (27) | Eur Radiol | 2014 | NR | Repaired tetralogy of Fallot (33) | 33 | - | 33 | 19:14 | 28.9 ± 13.1 | 0 | 256-slice CT (Brilliance iCT, Philips) | 3T (Achieva 3.0T, Philips) |
*Only data of entire population was reported, †Means 25th percentile to 75th percentile, ‡CT and MRI were performed on same day, except in one patient, §Data in parentheses indicate number of patients. CAD = coronary artery disease, COPD = chronic obstructive pulmonary disease, CT = computed tomography, DSCT = dual-source CT, EDV = end-diastolic volume, F = female, M = male, MR = mitral regurgitation, MRI = magnetic resonance imaging, NR = not reported, RV = right ventricle, T = tesla
![]()
Koch et al. (11) compared two different CT volumetric analysis methods (Simpson's method and the 3D threshold-based segmentation method) in the patient population. In this meta-analysis, results from 3D threshold-based segmentation methods were included to avoid data duplication. Data from the 2D-based Simpson's method were included only in the subgroup analysis for the volumetry method. Guo et al. (18) divided patients in two subgroups based on the presence of mitral regurgitation, and the results for the entire population, estimated from each subgroup, were used for this meta-analysis. Most of the studies included in this meta-analysis used 2D-based Simpson's methods with the simplified contouring method in CMRI for RV analysis; however, the segmentation methods used in CT differed from study to study.
Agreement between CT and MRI for Measurements of RV Volume and Function
Table 2 summarizes the weighted bias and LOA for each parameter, and Figure 2 summarizes the modified forest plots as Bland–Altman plots. For EDV, ESV, SV, and EF, the pooled bias was 3.036 mL, 3.589 mL, −0.385 mL, and −1.763%, respectively, and the pooled LOA were −5.715 to 11.786 mL, −3.997 to 11.175 mL, −5.722 to 4.953 mL, and −5.729 to 2.203%, respectively. Significant heterogeneity was observed in all studies (I2 > 50%, p < 0.1).
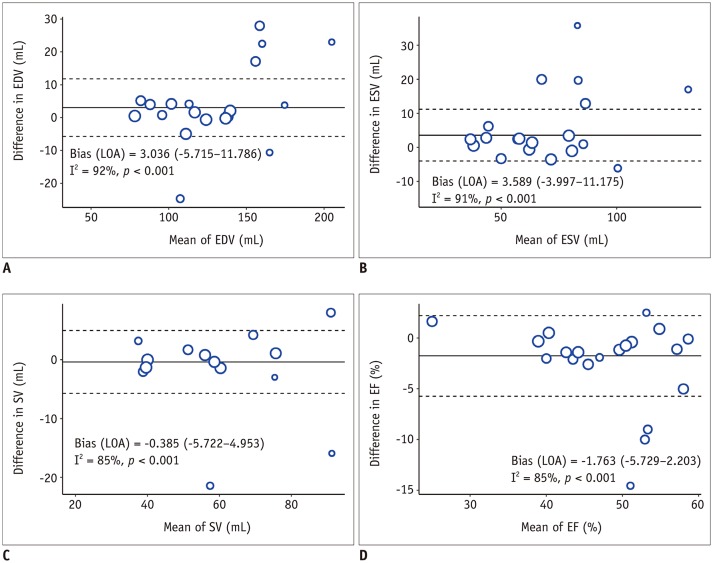
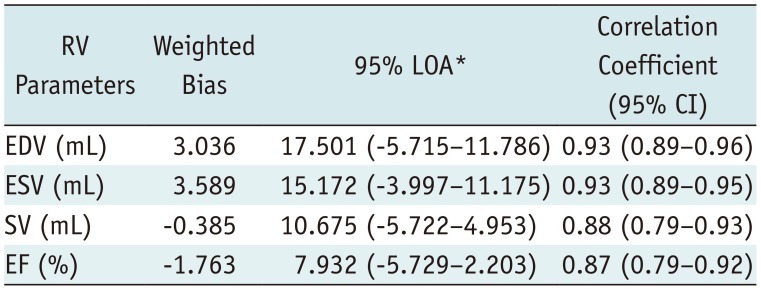
Fig. 2
Modified Blan–Altman plot for agreement between CT and CMRI for RV parameters.
A. EDV. B. ESV. C. SV. D. EF. CMRI = cardiac MRI, EDV = end-diastolic volume, EF = ejection fraction, ESV = end-systolic volume, LOA = limits of agreement, RV = right ventricle, SV = stroke volume
![]()
Table 2
Weighted Bias with LOA and Correlation Coefficients of Right Ventricular Function between Cardiac CT and CMRI
![]()
Correlation between CT and MRI for Measurements of RV Volume and Function
Table 2 summarizes the pooled correlation coefficient of each RV volumetric parameter, and Supplementary Figure 1 summarizes the forest plots. The pooled correlation coefficients of EDV, ESV, SV, and EF were 0.93 (95% confidence interval [CI]: 0.89–0.96), 0.93 (95% CI: 0.89–0.95), 0.88 (95% CI: 0.79–0.93), and 0.87 (95% CI: 0.79–0.92), respectively. Heterogeneity was observed in all studies (I2 > 50%, p < 0.1).
Subgroup Analysis
Table 3 presents the weighted bias and LOA of subgroup analyses, and Supplementary Figure 2 presents the forest plots for correlation coefficients in subgroup analyses. For correlation coefficients, there were no significant differences in heterogeneity between the subgroups for any parameter, and no significant factors affecting heterogeneity were revealed in the meta-regression (p > 0.05) (Supplementary Table 2).
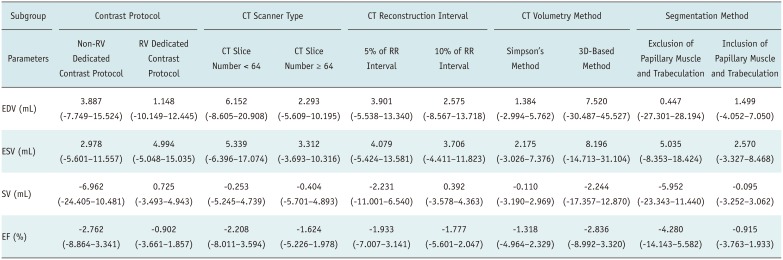
Table 3
Weighted Bias with LOA of RV Function between Cardiac CT and MRI in Subgroup Analysis
![]()
Among the 20 studies, 7 studies (11202223242729) used an RV-dedicated CT contrast administration protocol and 11 studies (612131417181921252628) used the non-RV-dedicated contrast protocol. Two studies did not accurately describe the contrast protocol (1516). Studies with RV-dedicated CT contrast protocols showed a lower weighted bias and narrower LOA in EDV and SV compared to those with non-RV-dedicated contrast protocols. The weighted bias and LOA of ESV and EF were smaller between the subgroups. The highest correlation coefficient was observed for EDV and ESV with an RV-dedicated contrast protocol (r = 0.95 for both). Other RV volume and function parameters showed very strong correlations (r > 0.8), regardless of the contrast protocol.
The number of CT slices was ≥ 64 (15181920212223242526272829) in 13 studies and < 64 in 7 studies. In studies with ≥ 64 CT slices (6111213141617), EDV and ESV showed a lower weighted bias and narrower LOA than in studies with < 64 CT slices. SV and EF showed similar values of weighted bias and LOA between the subgroups. All parameters showed very strong correlations (r > 0.8); however, studies with ≥ 64 CT slices showed higher correlation coefficients than those with < 64 CT slices. The CT reconstruction interval was 10% and 5% of the RR intervals in 10 studies (6111317181921222327) and 9 studies (121415162021252829), respectively. One study did not demonstrate the exact reconstruction interval (24). There were no parameters showing difference in agreement between the subgroups. The RV parameters showed very strong correlations in both subgroups (r > 0.8).
The Simpson's method was used in 14 studies for RV volume measurement on CT (1213141516171819202224262829), while 3D-based methods were used in 5 studies (621232527), and Koch et al. (11) used both methods in the same study population. Studies using Simpson's method showed a lower bias and narrower LOA for EDV and ESV than those using a 3D-based method. SV and EF showed smaller differences in the pooled bias between the subgroups. The parameters showed very strong correlations in both subgroups (r > 0.8).
Five studies excluded the papillary muscle and trabeculation from the RV cavity (1112161723), while 12 studies included them in contouring of the RV endocardial border (615181920212224262728). Three studies did not mention the segmentation method (131425). With including the papillary muscle and trabeculation, ESV, SV, and EF showed a lower bias and narrow LOA. EDV showed similar values of bias and LOA between the subgroups. The parameters showed strong correlations (r ≥ 0.8), except SV and EF using the exclusion method (r = 0.79 and 0.76).
Quality of Studies
Figure 3 summarizes the findings for the domains of the QUADAS-2 checklist. Most studies (95%) enrolled consecutive patients. One study did not explain the patient enrollment method (12). The risk of bias was judged as “unclear” in “index test” or “reference standard” domains in eight studies (40%), because there was no mention of whether the CT and CMRI results were interpreted with knowledge of each other (1116182224262729). Four studies (20%) showed a high risk of bias in the “flow” and “timing” domains, as some patients were excluded from the analysis (11132425). Concerns regarding applicability were rated “low” in all the domains.
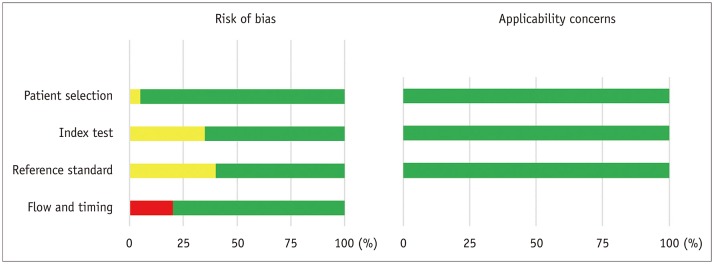
Fig. 3
Quality assessment of included studies.
Risk of bias and applicability of concerns domains are presented as percentages based on modified Quality Assessment of Diagnostic Accuracy Studies-2 tool. Each bar shows percentage of studies with high (red), unclear (yellow), and low (green) risks of bias and applicability of concerns.
![]()
Publication Bias
Supplementary Figure 3 presents the funnel plots of each parameter. EDV and SV showed relatively symmetric funnel plots without significant publication bias (p > 0.05); however, ESV and EF showed significant publication bias (p = 0.02 and p = 0.01, respectively).
DISCUSSION
Our meta-analysis demonstrates that evaluation of RV functional parameters on CT shows good agreement and very strong correlations with CMRI, although significant heterogeneities are observed in the studies. The RV parameters show a weighted bias < 4, with overestimation of EDV and ESV and underestimation of EF on CT, and a correlation coefficient > 0.8. Regarding factors affecting the measurements of RV volume and function, the RV-dedicated CT contrast protocol, CT scanner type with number of slices ≥ 64, use of CT segmentation with the Simpson's method, and inclusion of the papillary muscle and trabeculation for contouring the RV endocardial border contribute to better agreement between CT and CMRI.
A previous meta-analysis reported a good agreement and strong correlation between cardiac CT and CMRI for measurement of EF (pooled bias, 4.67%; LOA, 3.71–5.62%; correlation coefficient, 0.79) (42). However, the accuracy of other RV functional parameters, such as EDV, ESV, and SV, was not analyzed using the meta-analytic method before.
Echocardiography is the first-line method for functional evaluation of RV; however, it has limitations because of the position and complex geometry of RV (4344). Furthermore, 2D-based fractional area changes on echocardiography cannot fully represent RV global function, and Doppler-derived parameters have an angle dependency (44). Although recent studies reported that 3D echocardiography can accurately measure RV volume, it depends on the image quality, and it underestimates RV volume in comparison with CMRI (45).
CMRI is considered as the reference standard; however, the technique is contraindicated in some patients, such as those with implantable or supporting devices and claustrophobia (46). With the development of ECG-gated cardiac CT, 3D volumetric images of the heart can be obtained with high spatial resolution within a short scan acquisition time; therefore, CT can be an alternative tool for cardiac chamber function evaluation in patients who cannot undergo CMRI (4748). Although the use of iodinated contrast media and radiation exposure can be disadvantages of CT, recent developments in dose reduction techniques (e.g., image acquisition at low tube voltages with automated exposure control of tube current combined with iterative reconstruction) and low-dose contrast agent administration combined with low tube voltage acquisition can reduce these concerns (495051).
Therefore, many individual studies investigated the agreement between CT and CMRI for volume and functional measurement of cardiac chambers, including RV (611121314151617181920212223242526272829). However, the results for agreement and difference between the two modalities varied across studies. Therefore, we conducted a subgroup analysis based on the factors affecting RV volume and function measurements on CT. Protocols for image reconstruction and segmentation of the RV were almost uniform for CMRI among the included studies. In contrast, CT protocols vary based on the purpose of the exam or depend on the individual institution (52).
Accurate delineation of the RV endocardial contour requires homogeneous enhancement of the RV cavity (48). Since routine coronary CT protocol targets optimal enhancement of the coronary arteries and aorta, a contrast administration protocol focusing on visualizing the right cardiac chamber, such as multiphasic contrast injection or split-bolus technique, can help accurately draw the RV endocardial contour (53). In our study, EDV and SV showed better agreement in the subgroup of RV-dedicated contrast protocol. A contrast protocol focused on RV can be important for accurate evaluation of volume and function. Moreover, the inferior temporal resolution of CT to CMRI may lead to inaccurate ventricular volumetry values, which may be more prominent in previous CT scanners with < 64 slices. In this meta-analysis, studies with ≥ 64 CT slices showed better agreement of EDV and ESV than studies with < 64 CT slices.
The correct determination of end-diastolic and end-systolic phases is important for accurate measurement of ventricular volume (3254). The optimal reconstruction interval of cardiac CT has not been established, but it usually differs by 5% or 10% of the RR interval. Although the 5% interval reconstruction method may be expected to help accurate selection of the end-diastolic/end-systolic phase of the cardiac cycle better than the 10% interval, this meta-analysis showed that the reconstruction interval did not affect the evaluation of RV function on CT.
The volumetry method can be divided into the 2D-based Simpson's method and 3D-based method. In CMRI measurement, the 2D-based Simpson's method is commonly used. However, it shows disadvantages such as incorrect basal slice selection and respiratory misregistration artifacts. Nevertheless, agreement was better in the RV functional parameters when the same method as CMRI (Simpson's method) was used in CT volumetry. Moreover, there was a tendency for overestimation of EDV and ESV in the 3D-based method on CT compared to 2D-based CMRI. This result mainly depends on the difference in principles between the two volumetry methods, since the 2D-based Simpson's method calculates the chamber volume by multiplying the cross-sectional area of each short-axis slice by slice thickness plus inter-slice gap and fails to truly reflect the full anatomical detail of RV. In this context, we should note that 2D CMRI may not represent the actual volume of the cardiac chamber because it mainly relies on the Simpson's method, as shown in a phantom study (6), even CMRI is currently accepted as the reference standard. In addition to the volumetry method, the early timing of the end-diastolic phase with CMRI compared with cardiac CT and the partial volume effects of CT segmentation could be factors resulting in the overestimation of volume with CT, particularly with right ventricular EDV (54).
Moreover, CT attenuation of RV can be a contributing factor, since 3D-based volumetry methods are mostly performed using a threshold-based, region-growing method, which relies on CT attenuation of the RV cavity after contrast administration. However, segmentation with CT images can lead to blurring of the endocardial contour and contain larger parts of the myocardium in the RV cavity in comparison with CMRI, especially in cases of the CT contrast protocol focused on examining the coronary artery (25). Koch et al. (11) compared the two methods in the same patient population and showed insufficient correlation in the 3D-based method, with inhomogeneous contrast enhancement of RV as the probable reason.
Previous studies on ventricular volumetry with CMRI reported that inclusion of the papillary muscle and trabeculation resulted in significant differences in left ventricular volume measurement, up to 25% for EDV and 68% for ESV, and in RV volume measurement, up to 15% for the EDV index and 21% for ESV (30335556). Although the inclusion of the papillary muscle may overestimate the RV volume, most studies in this meta-analysis included the papillary muscle and trabeculation in the RV cavity with CMRI, while the methods used with CT differed among studies. This meta-analysis showed better agreement in all RV functional parameters when the papillary muscle and trabeculation were included in the RV cavity on CT, probably because of the same segmentation method used in CT and CMRI.
There are several limitations in this meta-analysis. First, the patient characteristics including disease category were different among studies. Second, other variables that could affect the accuracy of RV volume, such as slice thicknesses of CT and CMRI and magnetic field strength of CMRI, were not considered, as most included studies applied the same slices for image reconstruction in CT and CMRI, and used the 1.5T MRI scanner. Third, significant heterogeneity was observed in all studies in this meta-analysis. Although we performed a subgroup analysis for the associated factors, heterogeneity in all subgroups was significant. Finally, the segmentation methods used with CMRI were uniform in this study, and studies with 3D-CMRI were not included because no study met the eligibility criteria.
In conclusion, cardiac CT is reliable for measurement of RV volume and function compared to CMRI, although significant inter-study heterogeneity is observed. Moreover, an RV-dedicated CT contrast protocol, ≥ 64 CT slices, and use of the same CT volumetric method as CMRI (Simpson's method and inclusion of the papillary muscle and trabeculation in the RV cavity) can improve agreement with CMRI.
 XML Download