

 PDF
PDF ePub
ePub Citation
 Print
Print


INTRODUCTION
Ultrasound elastography is a non-invasive imaging technique that can be used to visualize the tissue stiffness that is associated with various pathologic states (123). Therefore, elastography has various applications such as the differential diagnosis of malignancy and hepatobiliary diseases including liver fibrosis, atherosclerosis, myocardial disease, and muscle and joint disease (2456). In the case of breast masses, it is useful for differential diagnosis, improves diagnostic performance, and reduces the number of unnecessary biopsies (178). Recently, elastography has been widely applied as a complementary tool to conventional ultrasonography (US) and has been added as an associated finding with standardization of the color scale in the new edition of the American College of Radiology breast imaging reporting and data system (ACR BI-RADS) US classification (9).
Elastography applies compressive force to breast tissue and measures lesion stiffness. This method is because cancer tends to be stiffer than surrounding normal tissue and the strain of stiffer tissue is less than that of soft tissue (310). Tissue stiffness can be estimated using qualitative and quantitative elasticity scores of strain ratios, respectively (1112), which have been shown to have good sensitivity and specificity for the detection of malignant breast masses (181314). Since elasticity scores are qualitative, significant interobserver variability in image acquisition and pattern analysis of color maps has been found (151617). To overcome this limitation, the strain ratio (the ratio of strain measured in a target lesion region of interest [ROI] to strain measured in an ROI containing surrounding reference tissue) was introduced as a semi-quantitative analysis measure to interpret sono-elastographic images. Usually, strain ratios are calculated from two manually defined ROIs: one consisting of the target lesion and one reference consisting of the surrounding fat tissue, known as the 2-ROI method. Due to the manually defined ROIs, this method shows performance differences between observers (171819), as the reference strain measurement affects the strain ratio. Recently, a semi-automated strain ratio measurement algorithm using one ROI at the target lesion, known as the 1-ROI method, was suggested to reduce operator dependency when calculating strain ratios (192021). The 1-ROI strain ratio has shown significantly higher specificity than conventional US for the differential diagnosis of breast masses (22). However, few studies have evaluated the interobserver variability or the diagnostic performance of strain ratios between the 1-ROI and 2-ROI methods (2022). Moreover, to the best of our knowledge, no studies compared the diagnostic performance and interobserver variability in multiple readers between the 1- and 2-ROI methods. Thus, the purpose of this study was to compare the diagnostic performance of the strain ratio obtained using 1-ROI on breast elastography with 2-ROI and to compare the interobserver variability between multiple readers.
Go to : 
MATERIALS AND METHODS
Study Population and Mass Characteristics
This study was approved by our Institutional Review Board, and written informed consent was waived due to the retrospective nature of the study. From April to May 2016, percutaneous breast biopsies were performed in 201 breast masses from 173 consecutive women with ACR BI-RADS category 4 or 5 lesions, and in patients with ACR BI-RADS category 3 masses who requested biopsy confirmation. These symptomatic or screen-detected masses underwent conventional US and strain elastography. Forty biopsy-confirmed benign lesions in 33 patients were excluded, as no follow-up US data were available. In women with multiple lesions, only the largest one was included; therefore, 21 co-existing lesions were excluded. Finally, 140 breast masses from 140 women were included in the final analysis.
Image Acquisition
Conventional B-mode US and strain elastography were performed using a US scanner (RS80 A with Prestige, Samsung Medison Co. Ltd., Seoul, Korea) with a 4–13-MHz linear array transducer. Real-time whole breast US examination was performed by one of three experienced, board-certified radiologists with different levels of experience in breast imaging (6, 10, and 15 years, respectively). Subsequently, the same radiologist performed elastography examination of the target lesion. US elastography examinations were performed using a freehand technique, compressing the breast vertically, and applying the transducer under very light, constant pressure. For acquisition of strain elastography, a target lesion was located at the center of an elasticity box. The top of the box was set to include the subcutaneous fat, the bottom was set to include the pectoralis muscle, and the lateral borders were set to include more than 5 mm of normal breast parenchyma from the lesion's boundary. Real-time elastography images were visualized using a 256-color map showing the degree of displacement for all pixels within the ROI, representing the amount of strain in a scale ranging from red (greatest strain, softest area) to green (average strain, intermediate component) to blue (no strain, hardest area) (23). Dedicated software (ElastoScan TM, Samsung Medison Co. Ltd.) provided feedback regarding the use of adequate compression and elastographic quality. Static and cine images with pressures ranging from 2 to 3 on the pressure indicator and homogenous color mapping within the ROI represented optimal quality elastography images. For both conventional and elastography US images of target lesions, transverse and longitudinal static images were captured and recorded as video files by the operator.
Image Analysis
Recorded conventional and elastography US images were independently analyzed by three radiologists with more than five years of experience in breast elastography one year after the image acquisition day. All radiologists were blinded to clinical information, mammography features, and final pathologic outcomes. First, static, and cine B-mode images of the lesions were reviewed. Each lesion was categorized using the ACR BI-RADS lexicon of ultrasonographic descriptors of lesion features (echo pattern, shape, orientation, margin, and posterior acoustic). One month later, elastography image analyses and strain ratio measurements were conducted using the static and cine elastography images. Before obtaining the strain ratio, each radiologist selected an image slice of the highest quality from the cine elastography image with a low noise level and consistent strain information, with reference to the high-quality image from the study by Chang et al. (24). The strain ratio was measured twice by applying the semi-automated 1-ROI and manual 2-ROI method to the selected image slice. In the 2-ROI method, two round or oval ROIs were manually superimposed on the target lesion (as large as possible) within the mass, and on the lateral subcutaneous fat tissue at a similar depth as the target lesion using a similar ROI size, as recommended. However, if the appropriate fat was not located at the same level or was not as big as the target lesion, the depth or size of the reference ROI was modified to fit the location of the nearby subcutaneous fat tissue. In the 1-ROI method, one ROI was manually drawn on the target lesion and then a reference ROI was placed semi-automatically after a short acquisition time. The reference fat region around a target lesion was automatically identified at the level of or above the lesion ROI (Fig. 1). The mean strain within the reference was calculated as the mean strain of the fat located at the level of and above the ROI set for the mass, excluding the strain measured within the ROI set for the mass measurement (Fig. 1). The strain ratio was automatically calculated by the US unit (2022).
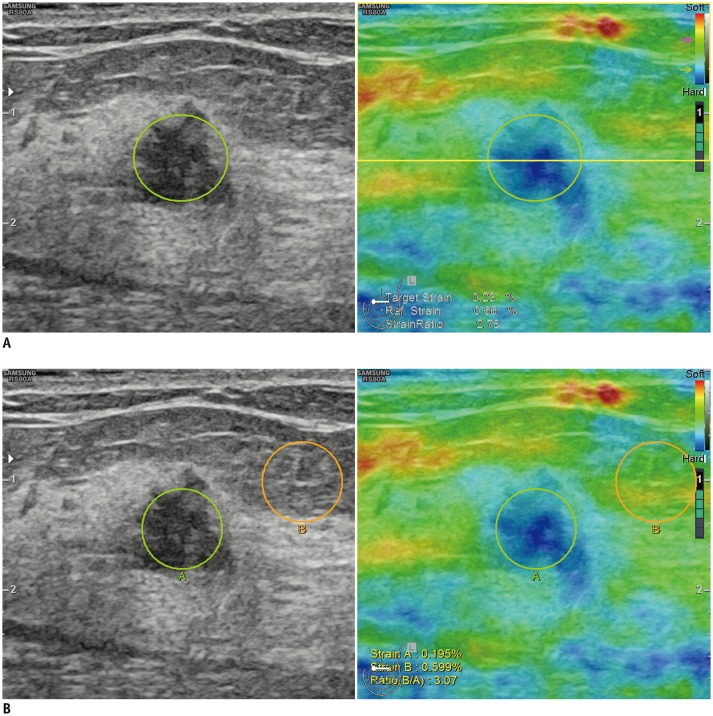 | Fig. 1Representative images showing ROI used to obtain strain ratio using 1-ROI (A) and 2-ROI methods (B).
A. For 1-ROI method, oval ROI was set to include mass (green circle) in which US unit automatically calculated and visualized strain ratio as mean strain within ROI drawn along border of mass divided by mean strain of fat located at and above level of ROI set for mass strain measurement, excluding strain measured within ROI set for mass measurement (yellow box). B. For 2-ROI method, one ROI was drawn along border of targeted breast mass (green circle) and another was drawn in lateral subcutaneous fat tissue located near target lesion (orange circle). Reference strain for 2-ROI method (B) was measured as average strain within orange circle. ROI = region of interest, US = ultrasonography
|
Pathological Examination and Follow-Up
After elastography examination, all 140 lesions were histopathologically confirmed by US-guided core needle biopsy (CNB). All malignant or high-risk masses, such as atypical ductal hyperplasia (ADH) and benign masses that needed surgical resection (e.g., phyllodes tumors), underwent surgery. For cases in which the imaging and histologic diagnoses were both benign, follow-up US was recommended at 6-month intervals.
Statistical Analysis
Clinical, radiological, and pathological data were collected using a commercially available computerized spreadsheet (Excel 2016, Microsoft Corporation, Redmond, WA, USA). Final histopathology results from US-guided CNB or surgical excision were considered the reference.
Diagnostic performance parameters including sensitivity, specificity, positive predictive value (PPV), negative predictive value (NPV), and accuracy of conventional US, combined US with strain ratio using 1- or 2-ROI methods were calculated and compared using the generalized estimating equation for the three radiologists. Youden's index was used to calculate the optimal cut-off value of the strain ratio in differentiating between benign and malignant breast masses. We compared the ability of the two ROI methods to differentiate between malignant and benign masses using receiver operating characteristic (ROC) curve analysis and compared their areas under the ROC curve (AUC) using the z test. For statistical analysis, the ACR BI-RADS final assessment categories were provided in a dichotomized form as “possibly benign” for categories 2 and 3, and “possibly malignant” for categories 4a to 5. With the calculated cut-off values, McNemar's test was used to estimate the differences in assessment between the two ROI methods, when dichotomously divided into negative and positive results.
We used three statistical methods to assess reliability and agreement between the two ROI measurement methods. Intraclass correlation coefficient (ICC) values were used to quantify the interobserver agreement for each ROI method. ICC values of 0.00–0.20, 0.21–0.40, 0.41–0.60, 0.61–0.80, and 0.81–1.00 indicate poor, fair, moderate, substantial, and excellent to perfect agreement, respectively (25). The ICCs were reported with a 95% confidence interval (CI). A Bland-Altman plot was used to analyze agreement between readers using the 1- and 2-ROI method with mean differences between the measurements, which represent estimated bias and upper and lower limits of the 95% agreement limit (26). Finally, the coefficient of variation and the mean strain ratio of benign and malignant tumors obtained using the 1- and 2-ROI methods were recorded for each radiologist.
Statistical analysis was performed using STATA software version 14.0 (StataCorp LLC, College Station, TX, USA) and MedCalc (MedCalc Software, Mariakerke, Belgium). P < 0.05 was considered statistically significant.
Go to :
RESULTS
Demographics of the Study Population
The patient demographics are shown in Table 1. The mean patient age was 48.1 ± 11.8 (range 30–82) years. Among the 140 breast masses, 65 (46.4%) were diagnosed as malignant and 75 (53.6%) were benign using US-guided CNB. Surgery was performed for 61 malignant masses and for 16 benign masses based on CNB results. Three patients who were diagnosed with either ADH or atypical apocrine hyperplasia on CNB were upgraded to ductal carcinoma in situ and the remaining 13 benign masses were proven benign masses (five phyllodes tumor, three fibroadenoma, one ADH, one flat epithelial atypia, one diabetic myopathy, one duct ectasia, and one inflammation) after surgical excision. Fifty-nine benign masses were followed up 11 months later, on average (range, 6–15 months), and showed no change.
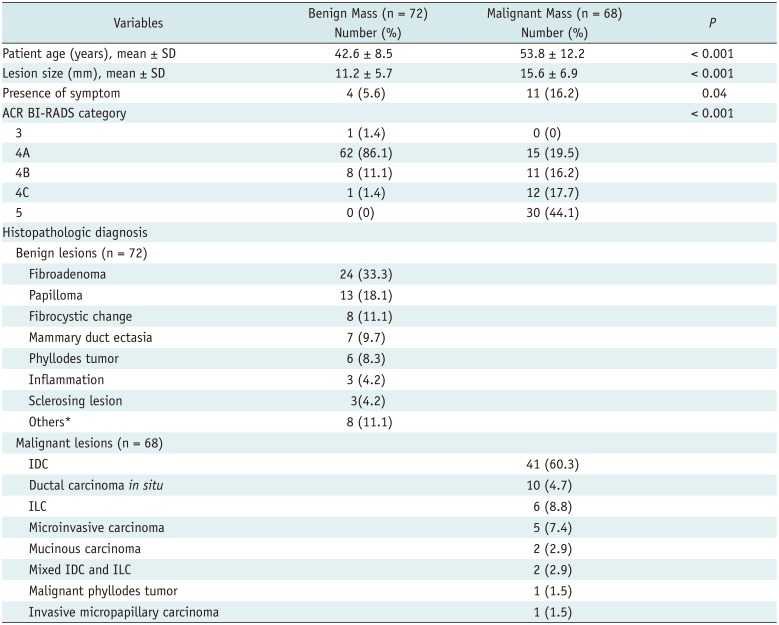
Table 1
Patient Demographics and Lesion Characteristics
*Diabetic mastopathy, lactating adenoma, pseudoangiomatous stromal hyperplasia, tubular adenoma, mucocele like tumor, atypical ductal hyperplasia, and flat epithelial atypia. ACR BI-RADS = American College of Radiology breast imaging reporting and data system, IDC = invasive ductal carcinoma, ILC = invasive lobular carcinoma, SD = standard deviation
![]()
The mean size of breast masses was 13.3 mm (range, 4–30 mm). The mean size of malignant masses was significantly larger than that of benign ones (15.6 ± 6.9 mm and 11.2 ± 5.7 mm, respectively; p < 0.001). Of the 140 patients, 125 (89.3%) had no symptoms, 14 (10%) had a lump, and one (0.7%) had discharge. Malignant lesions were more frequently symptomatic (16.2%) than benign lesions (5.6%) (p = 0.04).
Diagnostic Performances
Table 2 shows the mean strain ratio of benign and malignant masses. Malignant masses had significantly higher average strain ratios than benign masses for both ROI methods, for all radiologists. Table 3 summarizes the optimal cut-off value of the strain ratio to achieve the maximal sum of sensitivity and specificity for the two ROI methods, as well as the distribution of pathologic results for breast masses according to the strain ratio. The optimal cut-off values of the strain ratio calculated for the 2-ROI method were always higher than the 1-ROI method (7.7, 3.0, and 3.5 vs. 4.2, 2.1, and 2.4). AUC showed no significant difference between the two ROI methods in differentiating benign and malignant masses when the optimal strain ratio cut-off value was used (p = 0.81, p = 0.49, and p = 0.87 for the three radiologists).
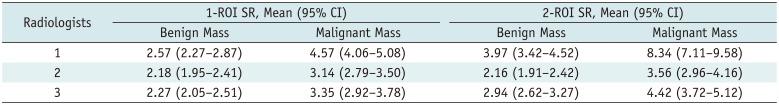
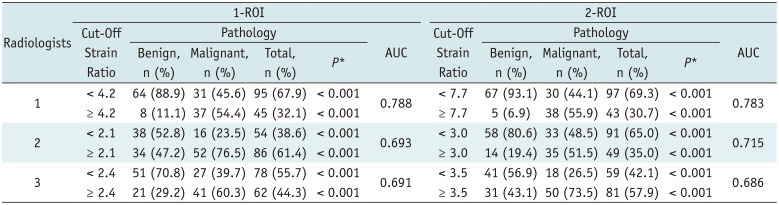
Table 2
Mean Strain Ratio of Benign and Malignant Masses Measured by 1- and 2-ROI Methods
![]()
Table 3
Cut-Off Strain Ratios Obtained by Two ROI Methods by Three Radiologists and Proportion of Benign and Malignant Breast Masses
![]()
The diagnostic performances of conventional and combined US with strain elastography are summarized in Table 4. For all three radiologists, combined US with strain elastography had significantly higher specificity, PPV, and accuracy regardless of the ROI measurement method, with a trade-off for lower sensitivity compared with that of conventional US alone. However, statistically significant differences in sensitivity were seen for all radiologists using the 2-ROI method and for one radiologist using the 1-ROI method. For all radiologists, no significant difference was seen in NPV for either of the two ROI methods. There was no significant difference in NPV between the imaging assessment methods for all radiologists.
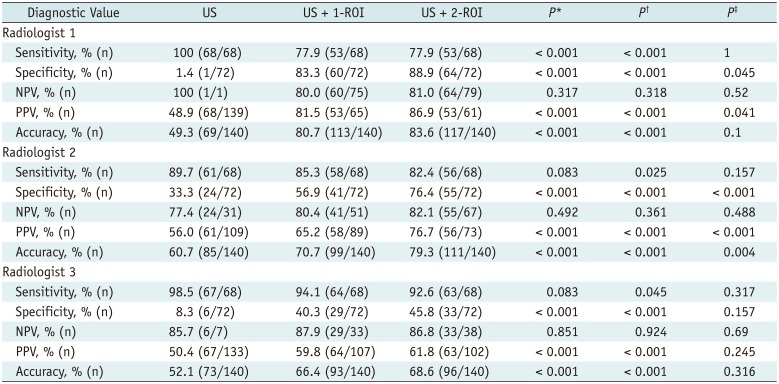
Table 4
Diagnostic Performance of Conventional US and US Combined with 1-ROI or 2-ROI Strain Ratio
*Comparison of US and US + 1-ROI, †Comparison of US and US + 2-ROI, ‡Comparison of US + 1-ROI and US + 2-ROI. NPV = negative predictive value, PPV = positive predictive value, US = ultrasonography, US + 1-ROI = gray-scale US combined with 1-ROI strain ratio, US + 2-ROI = gray-scale US combined with 2-ROI strain ratio
![]()
Compared to conventional US, the overall AUC for US combined with strain elastography significantly improved regardless of the ROI measurement method. The AUC for US vs. US combined with 1-ROI strain ratio was 0.507 vs. 0.806 for radiologist 1, 0.615 vs. 0.711 for radiologist 2, and 0.534 vs. 0.672 for radiologist 3 (all p < 0.001). The AUC for US vs. US combined with 2-ROI strain ratio was 0.507 vs. 0.834 for radiologist 1, 0.615 vs. 0.794 for radiologist 2, and 0.534 vs. 0.692 for radiologist 3 (all p < 0.001). When comparing the two ROI methods, specificity and PPV were higher for the 2-ROI method than for the 1-ROI method with a statistically significant difference between radiologists 1 and 2 (all p < 0.05). Accuracy was significantly higher for the 2-ROI method for radiologist 2 (p = 0.004). No significant difference was found in sensitivity or NPV in all three radiologists.
Interobserver Agreement of Strain Ratios Measured by the 1-ROI and 2-ROI Methods
Both ROI methods showed excellent interobserver agreement of strain ratio between radiologists with ICC = 0.88 (95% CI, 0.842–0.911) for the 1-ROI method and ICC = 0.79 (95% CI, 0.729–0.848) for the 2-ROI method (Fig. 2). Figure 3 shows Bland-Altman plots representing the difference in strain ratio between the two ROI methods for any two of the three radiologists. The mean differences in strain ratio for the 1-ROI method were closer to zero with narrower CIs for the limits of agreement than those of the 2-ROI method. For radiologists 1 and 2, the mean difference of 1-ROI and 2-ROI strain ratios was 0.89 and 3.25, respectively; for radiologists 1 and 3, 0.75 and 2.43, respectively; and for radiologists 2 and 3, −0.14 and −0.82, respectively. Most dots are located within the upper and lower limits of agreement regardless of the ROI measurement method, representing high agreement between any two radiologists. The coefficient of variation for strain ratio in the 2-ROI method was almost twice of that of the 1-ROI method (0.43 vs. 0.24).
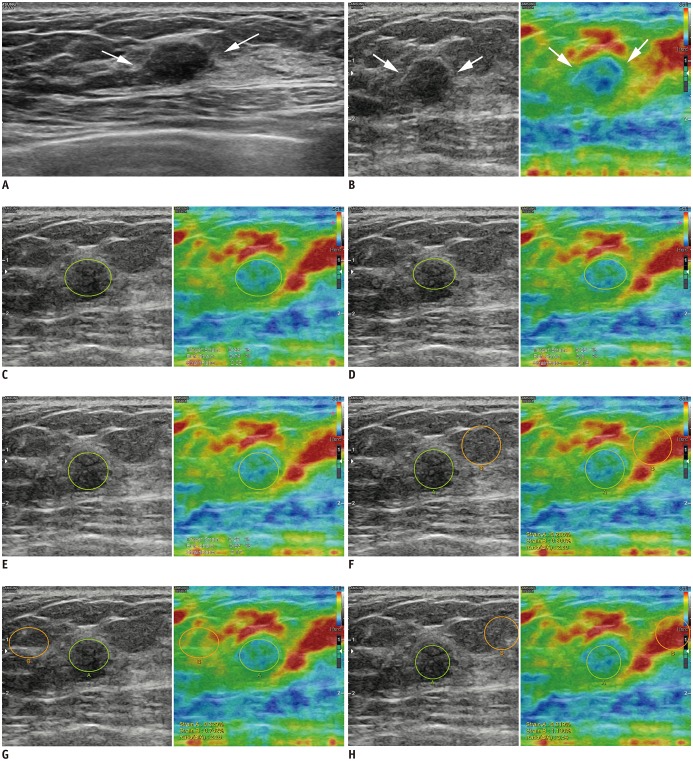 | Fig. 227-year-old woman diagnosed with fibroadenoma on US-guided biopsy was stable during > 2 years of follow-up.
A. Transverse B-mode US image shows 9-mm indistinct oval hypoechoic mass (arrows) in left breast that was categorized as Category 4a by each radiologist. B. Strain elastography showed that mass had some hard areas (arrows). Strain ratios using 1-ROI method were 2.25 (C), 2.16 (D), and 2.17 (E) according to three radiologists (green circle indicated ROI for target lesion). Strain ratios using 2-ROI method were 2.80 (F), 2.26 (G), and 3.54 (H) according to three radiologists (green circle indicated ROI for target lesion, orange circle indicated ROI for reference fat).
|
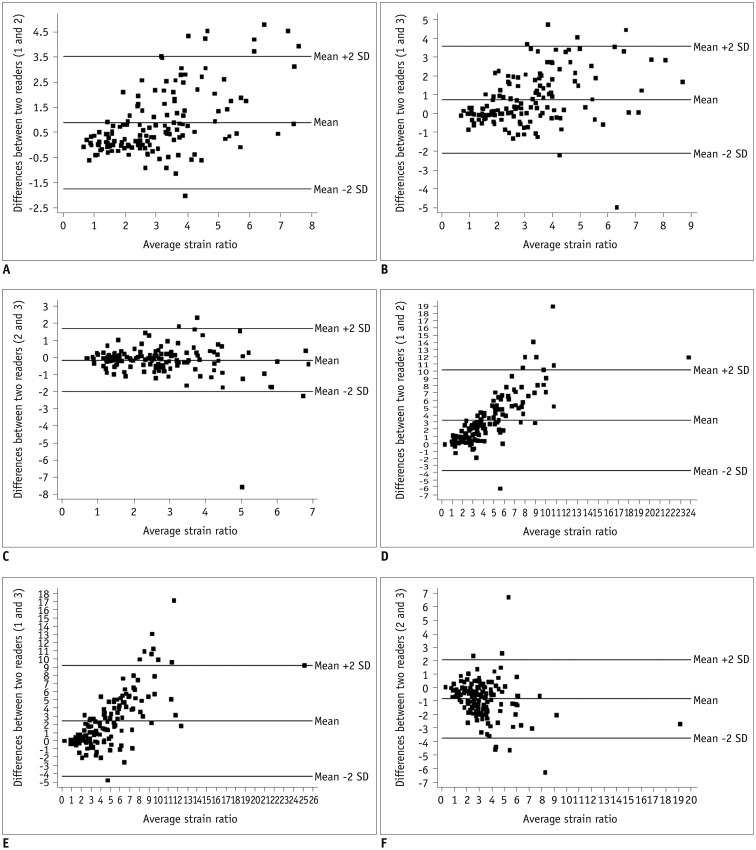 | Fig. 3Series of Bland-Altman plots show interobserver agreement of strain ratios for both 1-ROI (A–C) and 2-ROI methods (D–F).Each dot represents difference in strain ratios between two radiologists measured using same ROI method for each of 140 breast masses. Middle horizontal line represents mean difference in strain ratio, and each line above and below horizontal line represents mean difference between upper and lower limits of 95% agreement limit. For 1-ROI method, mean differences in strain ratios were as follows: (A) 0.891, with upper and lower limits of 3.533 and −1.751 between radiologists 1 and 2; (B) 0.746 with upper and lower limits of 3.599 and −2.108 between radiologists 1 and 3; and (C) −0.145 with upper and lower limits of 1.712 and −2.003 between radiologists 2 and 3. For 2-ROI method, mean differences in strain ratios were as follows: (D) 3.251, with upper and lower limits of 10.228 and −3.726 between radiologists 1 and 2; (E) 2.431 with upper and lower limits of 9.213 and −4.350, between radiologists 1 and 3; and (F) −0.820, with upper and lower limits of 2.106 and −3.746 between radiologists 2 and 3. SD = standard deviation
|
Go to :
DISCUSSION
In this study, when elastography was added to conventional US using strain ratios, both strain ratios measured using 1- and 2-ROI methods had significantly higher specificity, PPV, accuracy, and AUC among all three radiologists without losing NPV. Sensitivity decreased for one radiologist in the 1-ROI method and all radiologists in the 2-ROI methods. Many studies have suggested that the strain ratio is a reliable factor for differentiation between benign and malignant breast masses and improves the overall diagnostic value of conventional US, including specificity and accuracy (7182728). A recent meta-analysis by Gong et al. (8) examined 22 articles (4713 breast nodules) and demonstrated that the strain ratio has a pooled sensitivity of 88% (95% CI, 0.844–0.916) and pooled specificity of 81% (95% CI, 0.844–0.916), with an AUC of 0.93 for diagnosing breast cancers. Further, Yoon et al. (18) showed that the strain ratio using 1- and 2-ROI methods showed significant improvement in specificity, PPV, and accuracy compared to those when using conventional US, in accordance with our results.
The range of cut-off values for the 1- and 2-ROI methods was 2.1 to 4.2, and 3.0 to 7.7, respectively, which showed significant differences between benign and malignant masses in our study. The cut-off value range was larger in the 2-ROI method than in the 1-ROI method. Previously reported cut-off values of strain ratios measured using the 2-ROI method showed a wide variance of 0.5 to 4.5, depending on the study population and specific elastography machine used (9). A narrower cut-off range may indicate more similar strain ratio cut-off values in different populations and performers. Therefore, the 1-ROI method may be more appropriate when standardizing the strain ratio of elastography in the differential diagnosis of breast masses.
When comparing the diagnostic performance of 1- and 2-ROI methods, the 2-ROI method had higher specificity and PPV for two of three radiologists (radiologists 1 and 2) and higher accuracy for one of three radiologists (radiologist 2) (p < 0.05). However, for radiologist 3, there was no significant difference in diagnostic performance between the two ROI methods. Overall, there were no consistent differences in diagnostic performance among the three radiologists between the two ROI methods. Additionally, the AUC showed no significant difference between the two ROI methods in differentiating breast masses when the optimal cut-off value was used. We suggest that both ROI methods can provide a comparable improvement to the diagnostic performance of conventional US.
In this study, each strain ratio measured using the 1- and 2-ROI methods showed excellent agreement between the three radiologists; however, the ICC value was higher for the 1-ROI method (ICC = 0.88 for the 1-ROI method; ICC = 0.79 for the 2-ROI method). The Bland-Altman plot revealed a smaller mean difference for the 1-ROI method than for the 2-ROI method. The mean value of the differences in the strain ratios measured by pairs of radiologists using the 1-ROI method was closer to zero, suggesting that the interobserver agreement is higher for the 1-ROI method. Moreover, the upper and lower limits of the 95% limit of agreement were narrower for the 1-ROI method, for all pairs of radiologists. This suggests that the strain ratio difference measured between radiologists using the 1-ROI method was smaller, indicating higher interobserver agreement, which may lead to consistent management of breast lesions.
One limitation of this study is that the qualitative parameters of strain elastography (e.g., determination of elasticity scores using the Tsukuba score system (3)) were not evaluated. Second, our patients showed a high prevalence of malignancy (46%). As our institution is a tertiary hospital, most patients included in this study were referred for a diagnostic examination including biopsy or for surgery. Thus, the high malignancy prevalence may not be reflective of the general population screened for breast cancer. Third, the intraobserver reproducibility was not evaluated. Fourth, clinical factors, expected to influence the results of elastography, such as lesion size, lesion depth, density, or thickness of the breast, were not analyzed. Fifth, some benign lesions were excluded if they had no available follow-up US data or if a larger coexisting lesion was included, which might have affected the results. Finally, data were derived from a relatively small number of patients and the study had a retrospective design.
In conclusion, the strain ratios obtained using the 1-ROI method showed higher interobserver agreement without a significant difference in the diagnostic performance as reflected by the AUC, compared to those obtained using the 2-ROI method. Considering that the 1-ROI method can reduce performers' efforts, it could have an important role in improving the diagnostic performance of breast US by enabling consistent management of breast lesions.
Go to :
 XML Download