

 PDF
PDF ePub
ePub Citation
 Print
Print


INTRODUCTION
Non-alcoholic fatty liver disease (NAFLD) is a common cause of chronic liver disease, affecting up to 40% of the general population in developed countries (12). NAFLD may progress to cirrhosis and hepatocellular carcinoma (34) and is also associated with metabolic syndrome (5). Due to its high prevalence and asymptomatic presentation, however, NAFLD is often overlooked in healthy controls selected for clinical trials, possibly hampering the validity of study findings (6). Thus, there is a need for a widely applicable, non-invasive screening method allowing for the reliable diagnosis or exclusion of NAFLD.
Liver biopsy is regarded as the gold standard for assessing NAFLD, especially for evaluating inflammation and fibrosis associated with NAFLD. However, the invasiveness of biopsy limits its use in clinical practice and research. Among imaging methods, magnetic resonance (MR) spectroscopy and imaging are the most accurate for quantifying liver fat contents and detecting NAFLD (78). However, these techniques are often unavailable in general practice. Although grayscale ultrasonography (US) is commonly used to screen for NAFLD, it may be subject to inter-observer variability and has limited accuracy in detecting NAFLD (78).
Hepatic steatosis may be quantitatively assessed by measuring hepatic attenuation on non-enhanced computed tomography (CT). CT is more widely available and less expensive than MR imaging and may provide an objective assessment of NAFLD. Thus, non-enhanced CT has been used to assess NAFLD in candidates for living liver donation (79), as well as in cohort studies and clinical trials (101112). Although CT allows for a highly specific diagnosis of moderate to severe fatty liver disease, it is not accurate in detecting a mild degree of fatty liver disease (713). Therefore, it may not be reliable for selecting or excluding subjects with NAFLD. Several clinical prediction models based on demographic, anthropometric, and laboratory characteristics may be used to screen for NAFLD (141516) and have been successfully applied to large-scale cohort studies (517). Thus, we hypothesized that combinations of clinical parameters and CT results may enable more accurate detection of NAFLD compared with clinical indices or CT alone. A simple index based on CT results and routinely accessible clinical data may be useful for detecting NAFLD in clinical practice and research. Furthermore, this index can be applied to pre-existing CT and clinical data to conduct large-scale retrospective cohort studies. The present study was designed to develop and validate a simple index combining CT and standard clinical data for screening for NAFLD in a large cohort of adults with pathologically proven NAFLD.
MATERIALS AND METHODS
This study was approved by the Institutional Review Board of our institution, which waived the requirement for informed consent due to the retrospective nature of this study.
Study Population
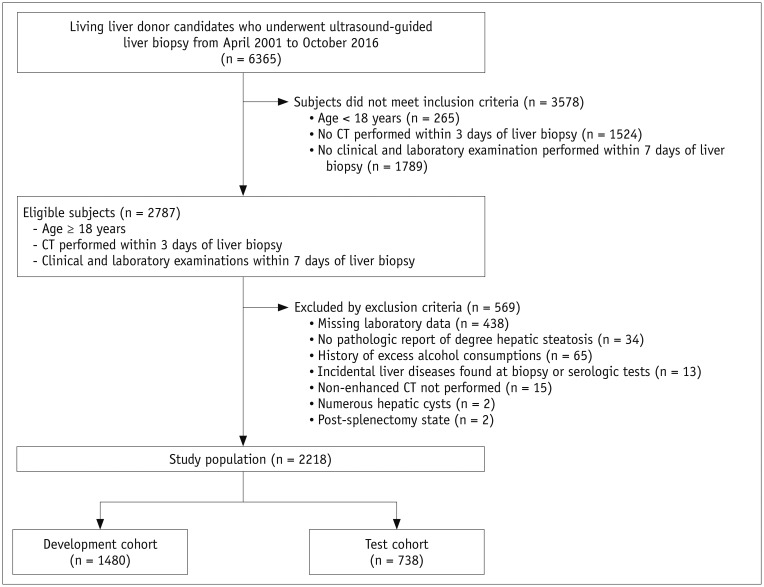
The study population included living liver donor candidates who underwent ultrasound-guided percutaneous liver biopsy as part of a routine donor work-up at our institution between April 2001 and October 2016. Subjects were included if they were aged ≥ 18 years, underwent CT scanning within 3 days of liver biopsy, and underwent clinical and laboratory examinations within 7 days of liver biopsy. Of the 2787 consecutive living liver donor candidates evaluated during the study period, 569 were excluded, including 438 with missing laboratory results (will be discussed later); 34 with pathology reports that did not include the degree of hepatic steatosis; 65 with a history of excess alcohol consumption (i.e., over 20 g of ethanol/day) (18); 13 with liver disease incidentally detected on biopsy or serologic tests; and 19 with conditions that precluded measurement of CT indices, including 15 lacking non-enhanced CT images, two with numerous hepatic cysts, and two with prior splenectomy. The remaining 2218 subjects (1439 men and 779 women; mean age, 31.0 ± 9.0 years; range, 18–62 years) were randomly divided 2:1 into development (n = 1480) and test (n = 738) cohorts. The flow diagram for the study population is shown in Figure 1. The CT data in the study population have been reported previously (13); in that study, the data were used to evaluate the performance of CT indices and determine cutoff values for diagnosing hepatic steatosis.
CT Protocol
Because the CT data in this study were collected over a long period, various CT techniques were used. CT scans were obtained using 4-channel (Lightspeed Qx/i, GE Healthcare, Milwaukee, WI, USA; n = 2), 16-channel (Lightspeed 16, GE Healthcare or Sensation 16, Siemens Healthineers, Erlangen, Germany; n = 1611), 64-channel (Definition AS, Siemens Healthineers; n = 564), and 128-channel (Definition Flash, Siemens Healthineers; n = 41) scanners. Non-enhanced CT images were obtained at beam collimations of 4 × 2.5 mm (Lightspeed Qx/i), 8 × 2.5 mm (Lightspeed 16), 16 × 1.5 mm (Sensation 16), 24 × 1.2 mm (Definition AS), and 64 × 0.6 mm (Definition Flash); at a spiral pitch of 1 to 1.5; at tube voltages of 120 kVp (n = 1672) and 100 kVp (n = 546); and at tube currents of 200 mAs (GE scanners) or variable mAs (Siemens scanners) with an automatic exposure control (Care Dose 4D, Siemens Healthineers; maximum effective dose, 200 mAs). Axial images were reconstructed at section thicknesses of 3 mm (n = 45) and 5 mm (n = 2173), with no gaps. The mean interval between CT and liver biopsy was 0.4 ± 0.7 days (range, 0–3 days), with 1710 (74.8%) subjects undergoing CT scanning and liver biopsy on the same day.
CT Image Analysis
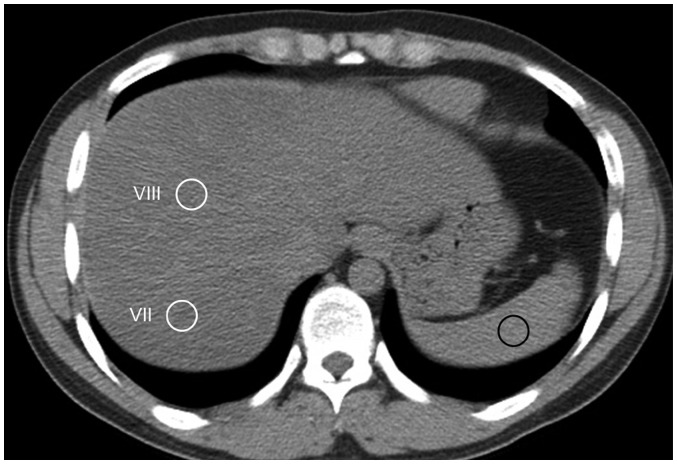
The quantitative CT index used in this study was CTL-S because it was reported to be the most accurate and robust CT index for assessing NAFLD (13). CTL-S was calculated as the mean liver attenuation minus the mean spleen attenuation. Liver and spleen attenuation values on non-enhanced CT images were measured by one of two radiology technicians using in-house software plugged into ImageJ (National Institutes of Health, Bethesda, MD, USA). Liver attenuation was calculated as the average number of Hounsfield units (HU) of eight 1.5 cm2 circular regions of interest (ROIs) of the right hepatic lobe. Splenic attenuation was calculated as the average HU of three 1.5 cm2 circular ROIs of the upper, middle, and lower thirds of the spleen (Fig. 2). The CT images with ROIs were screen-captured and re-evaluated by an abdominal imaging fellow with 2 years of experience in abdominal imaging to reconfirm the adequacy of the ROI locations.
Clinical Parameters
Clinical variables included body mass index (BMI), calculated as body weight (kg)/height m2; age; sex; and serum concentrations of aspartate transaminase (AST), alanine aminotransferase (ALT), bilirubin, alkaline phosphatase, triglyceride (TG), cholesterol, high-density lipoprotein (HDL) cholesterol, glucose, and albumin. These parameters were selected based on variables previously included in clinical models for the diagnosis of NAFLD (14151619). TG, cholesterol, and HDL-cholesterol concentrations were missing from the records of 438 (15.7%) of the 2787 eligible subjects who met the inclusion criteria. Because these variables were frequently included in previous clinical indices and because their rates of absence were too high for reliable data imputation, these subjects were excluded from this study. All laboratory tests were performed after a 12-hour overnight fast. The mean interval between laboratory examination and liver biopsy was 1.4 ± 2.2 days (range, 0–7 days).
Reference Standard
A pathologic diagnosis of NAFLD was defined as the reference standard. All subjects underwent US-guided percutaneous liver biopsy using an 18-gauge needle (Stericut 18G coaxial, TSK Laboratory, Tochigi, Japan), with at least two biopsy specimens measuring approximately 1.5 cm in length each, obtained from different sites in the right hepatic lobe. The biopsy specimens were stained with hematoxylin and eosin, and the degree of parenchymal involvement of macrovesicular steatosis was graded as none (< 5%), mild (5–33%), moderate (34–66%), or severe (> 66%), as defined by the non-alcoholic steatohepatitis Clinical Research Network scoring system (20). NAFLD was defined as the presence of ≥ 5% macrovesicular steatosis (20).
Clinical Indices for Diagnosing NAFLD
Two previously described clinical indices for diagnosing NAFLD, the hepatic steatosis index (HS-I) and fatty liver disease index (FLD-I), were calculated for each subject (1416). The HS-I was calculated as 8 × (ALT / AST) + BMI (+ 2 if diabetic and + 2 if female), and the FLD-I was calculated as BMI + TG + 3 × (ALT/AST) (+ 2 if hyperglycemic, with hyperglycemia defined as a fasting plasma glucose concentration ≥ 126 mg/dL).
Statistical Analysis
Continuous variables in the development and test cohorts were compared using t tests or Mann–Whitney U-tests, whereas categorical variables were compared using the χ2 test or Fisher's exact test. The normality of continuous variables was tested using the Kolmogorov–Smirnov test. Variables not normally distributed were log-transformed. Variables in subjects in the development cohort with and without NAFLD were compared using univariable logistic regression analysis. Candidate predictors were selected among all variables using multivariable logistic regression analysis with 1000-fold bootstrap resampling; variables selected in more than 50% of bootstrap logistic models were chosen as candidate predictors. Variables independently associated with NAFLD were identified using multivariable logistic regression analysis with backward elimination. To construct a simplified predictive model, logistic models that included an increasing number of variables were sequentially developed by one-by-one addition of independent variables to CTL-S. The diagnostic performance of each logistic model was assessed by calculating the area under the receiver operating characteristic curve (AUC). This procedure was continued until model performance did not improve the AUC by at least 0.005 upon the inclusion of an additional variable. A formula for the clinical-CT index was derived using the variables in the final logistic model and the proportions of the corresponding regression coefficients. The diagnostic performances of the clinical-CT index and CTL-S were evaluated by comparing the AUCs using Delong's method (21). The incremental difference between the clinical-CT index and CTL-S alone was evaluated by calculating the net reclassification improvement (NRI) and integrated discrimination improvement (IDI) (2223). The NRI is used to evaluate the net proportion of subjects reclassified correctly using the new model (i.e., the clinical-CT index) relative to the baseline model (i.e., CTL-S), whereas the IDI measures the improvement in sensitivity of the new model relative to the baseline model without a loss in specificity (2223). Positive NRI and IDI values indicate the superiority of the new model relative to the baseline model for correct classification. Cutoffs were selected for the clinical-CT index and CTL-S for 90% sensitivity and 90% specificity in diagnosing NAFLD, thus reliably detecting and ruling out NAFLD, and the corresponding sensitivities, specificities, and accuracies were calculated. The diagnostic performance of the clinical-CT index and CTL-S in the test cohort were compared using the AUCs, NRI, and IDI, whereas the diagnostic performances of the clinical-CT index and CTL-S were compared with those of the HS-I and FLD-I using the AUC. The sensitivities, specificities, and accuracies in diagnosing NAFLD were evaluated in the test cohort using the cutoff values for the clinical-CT index and CTL-S determined in the development cohort. A p value less than 0.05 was considered statistically significant. All statistical analyses were performed using SAS software version 9.3 (SAS Institute Inc., Cary, NC, USA).
RESULTS
Patient Characteristics
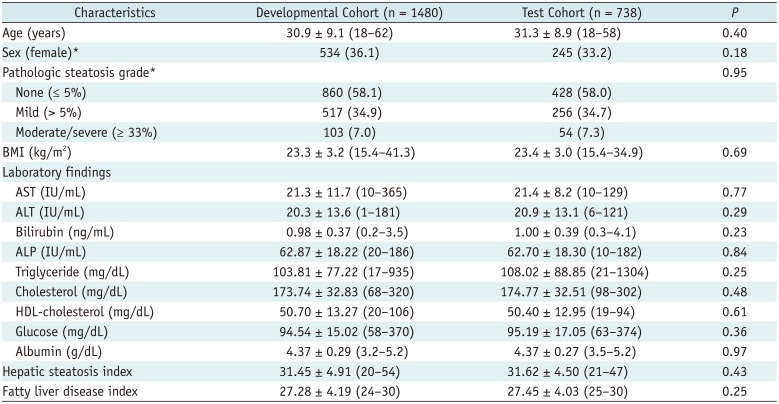
Table 1 summarizes the characteristics of the study population. NAFLD was present in 620 (41.9%) of the 1480 subjects in the development cohort and in 310 (42.0%) of the 738 in the test cohort. None of the clinical and laboratory characteristics assessed differed significantly between the development and test cohorts.
Development of a Simple Clinical-CT Index in the Development Cohort
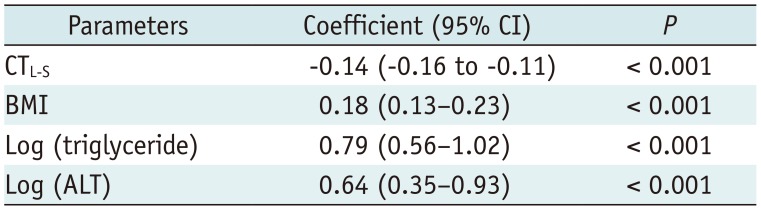
Univariable logistic regression analysis showed that all variables analyzed, except for bilirubin, were significantly associated with NAFLD (Table 2). Multivariable logistic regression analysis followed by candidate predictor selection showed that BMI, ALT, TG, cholesterol, HDL-cholesterol, and CTL-S were independently associated with NAFLD (Supplementary Tables 1, 2). These independent variables were utilized to construct logistic models containing different numbers of variables predictive of NAFLD (Supplementary Table 2). The final logistic models included CTL-S, BMI, TG, and ALT (Table 3). The relationship of the regression coefficients of the final logistic models resulted in a clinical-CT index predictive of NAFLD.
Clinical-CT index for the prediction of NAFLD = 5 × Loge (ALT × TG) + BMI - CTL-S.
Diagnostic Performance of the Clinical-CT Index and CTL-S in the Development Cohort
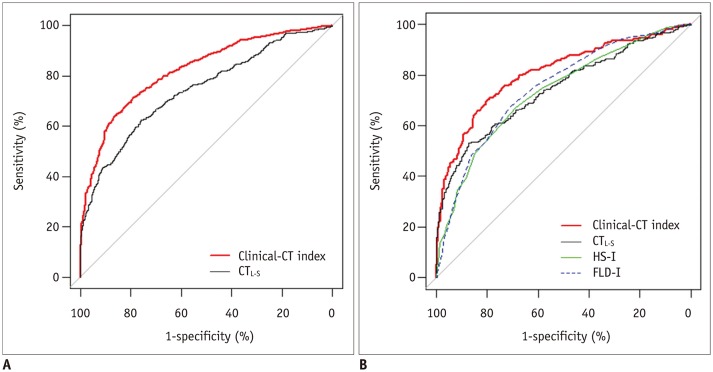
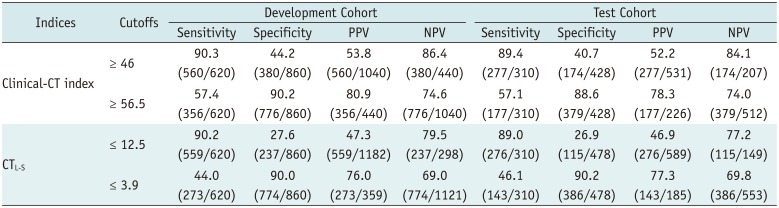
In the development cohort, the AUC for the clinical-CT index was 0.82 (95% confidence interval [CI], 0.80–0.84), which was significantly higher than that of CTL-S (0.74; 95% CI, 0.72–0.76; p < 0.001) (Fig. 3A). The clinical-CT index also showed significant improvement in reclassification (NRI, 0.75; p < 0.001) and discrimination (IDI, 0.12; p < 0.001) over CTL-S. Table 4 summarizes the dual cutoff values for the clinical-CT index and CTL-S for diagnosing NAFLD. A clinical-CT index cutoff of ≥ 46 diagnosed NAFLD with a sensitivity of 90% and specificity of 44%, whereas a CTL-S cutoff of ≤ 12.5 showed a sensitivity of 90% and specificity of 28%. Alternatively, a clinical-CT index cutoff of ≥ 56.5 diagnosed NAFLD with a sensitivity of 57% and specificity of 90%, whereas a CTL-S cutoff of ≤ 3.9 had a sensitivity of 44% and specificity of 90%.
Diagnostic Performances of the Clinical-CT Index and CTL-S in the Test Cohort
The AUC for diagnosing NAFLD in the test cohort was significantly higher for the clinical-CT index (0.81; 95% CI, 0.78–0.84) than for CTL-S (0.74; 95% CI, 0.71–0.78; p < 0.001) (Fig. 3B). In addition, the clinical-CT index had significant incremental value in reclassification (NRI, 0.61; p < 0.001) and discrimination (IDI, 0.09; p < 0.001) over CTL-S. Compared with clinical indices, the clinical-CT index significantly outperformed HS-I (AUC, 0.73; 95% CI, 0.70–0.76; p < 0.001) and FLD-I (AUC, 0.75; 95% CI, 0.72–0.78; p < 0.001) for diagnosing NAFLD, whereas the AUC for CTL-S did not differ significantly from the AUCs for HS-I (p = 0.64) and FLD-I (p = 0.19). The cutoff values for the clinical-CT index and CTL-S from the development cohort performed similarly in the test cohort. A clinical-CT index cutoff of ≥ 46 diagnosed NAFLD with a sensitivity of 89.4% and specificity of 40.7%, whereas a cutoff of ≥ 56.5 had a sensitivity of 57.1% and a specificity of 88.6%. By comparison, a CTL-S cutoff of ≤ 12.5 had a sensitivity of 89% and specificity of 26.9%, whereas a cutoff of ≤ 3.9 had a sensitivity of 46.1% and specificity of 90.2%.
DISCUSSION
The present study describes the development of a simple index, combining the CT index and routinely tested blood and anthropometric parameters, to predict NAFLD. The clinical-CT index outperformed CTL-S for diagnosing NAFLD with significantly higher AUCs and significant improvements in reclassification and discrimination in both the development (AUCs, 0.82 vs. 0.74, p < 0.001; NRI, 0.747, p < 0.001; IDI, 0.121, p < 0.001) and test (AUCs, 0.81 vs. 0.74, p < 0.001; NRI, 0.609, p < 0.001; IDI, 0.089, p < 0.001) cohorts. These findings indicate that adding clinical parameters to the CTL-S improved the ability to diagnose NAFLD. The clinical-CT index also performed better than did the clinical indices for diagnosing NAFLD in the test cohort, whereas the AUC for CTL-S did not differ significantly from the AUCs for the clinical indices. These results suggest that using CT alone for the diagnosis or exclusion of NAFLD is not a reasonable approach, as the performance of clinical indices—which can be determined more easily and at lower cost compared with CTL-S—was similar to that of CTL-S. However, the clinical-CT index, incorporating both CT and clinical parameters, may have clinical utility, allowing for better detection of NAFLD compared with the CT index and individual clinical indices.
Dual cutoff values of the clinical-CT index for diagnosing NAFLD were selected. One of these cutoffs was based on 90% sensitivity, which could be used to define a normal control group by excluding most subjects with NAFLD. In the test cohort, cutoffs of ≥ 46 for the clinical-CT index and ≤ 12.5 for CTL-S resulted in the diagnosis of NAFLD with a sensitivity of approximately 90% and specificities of 40.7% and 26.9%, respectively. The other cutoff, based on 90% specificity, could be used to identify a cohort of subjects with NAFLD for clinical research. In the test cohort, cutoffs of ≥ 56.5 for the clinical-CT index and ≤ 3.9 for CTL-S resulted in the diagnosis of NAFLD with a specificity of approximately 90% and sensitivities of 57.1% and 46.1%, respectively.
Several predictive models based on clinical and laboratory parameters have been developed to distinguish subjects with and without NAFLD. Some of these models, however, included parameters not always routinely measured in clinical practice. For example, models have included serum concentrations of insulin (24), uric acid (25), hemoglobin A1C (19), and haptoglobin (26), as well as waist circumference (1527), which are parameters that may not be easily retrieved from patient databases. This may limit the use of these models in retrospective analyses. Furthermore, many predictive models have been based on the diagnosis of NAFLD using grayscale US (1415162527), despite US diagnosis of NAFLD being operator-dependent and having limited accuracy (7). By contrast, the clinical-CT index for diagnosing NAFLD in our study was based on pathologic proof of NAFLD in a large population.
Given the potential radiation hazard of CT and the availability of other imaging methods for the diagnosis of NAFLD, such as MR imaging, MR spectroscopy, quantitative US methods, and the controlled attenuation parameter of transient elastography (82829), our clinical-CT index may not be an optimal method for identifying patients with NAFLD in clinical practice and in prospective research. However, because of the widespread use of CT, the clinical-CT index described in our study, incorporating routinely measured laboratory and anthropometric parameters, may be useful for constructing large cohorts of subjects with NAFLD and normal controls using pre-existing retrospective CT and clinical data; this may further be useful for conducting large-scale retrospective cohort studies to investigate the natural history and outcome of NAFLD.
This study had several limitations. First, the study population was derived from liver donor candidates, most of whom were young and healthy, and therefore may not fully represent the general population. Second, split-sample validation of the diagnostic accuracy of the clinical-CT indices was performed. External validation in a different test population may have been more conclusive. Third, we excluded subjects with excessive alcohol intake in our study to avoid the confounding effects of alcohol on clinical, CT, and pathologic findings. However, in clinical practice and in retrospective research, information regarding alcohol consumption may not be always available, which may potentially affect the performance of the clinical-CT index.
Finally, although percutaneous needle biopsy is a well-accepted reference method for the diagnosis of NAFLD, it may be subject to some degree of sampling error and inter-observer variability.
In conclusion, a clinical-CT index combining clinical parameters and CTL-S was more accurate in the diagnosis of NAFLD compared with CTL-S or clinical indices alone. This clinical-CT index may have utility in screening for NAFLD in clinical practice and research.

 XML Download