

 PDF
PDF ePub
ePub Citation
 Print
Print


INTRODUCTION
Imaging plays a pivotal role in the evaluation of various liver diseases, including screening, surveillance, diagnosis, and prognostication of diffuse liver disorders and hepatic neoplasms. Recent advances in computer science have enabled the clinical application of computer-assisted analysis in imaging examinations; of which radiomics and deep learning are currently the most actively investigated techniques. Although they involve completely different technical processes, both radiomics and deep learning utilize high-dimensional features extracted from images for diagnostic and predictive tasks. Radiomics and deep learning may also expand the role of imaging in the assessment of various liver diseases beyond the domain of traditional visual image analysis, by obtaining additional diagnostic information from images, assessing image features in a comprehensive and objective manner, and facilitating labor-intensive tasks such as liver segmentation. Hence, the goal of our article is to review the basic technical aspects of radiomics and deep learning and to summarize recent investigations on the application of these techniques in assessing liver disorders.
Go to : 
Radiomics
Radiomics refers to a set of techniques for extracting a large number of quantitative features from medical images (1) and subsequently mining these features to retrieve clinically useful diagnostic and prognostic information. Radiomics has gained considerable attention in the field of oncology as a method for supporting clinical decision-making and precision medicine. This methodology is based on the hypothesis that a radiologic phenotype may reflect genetic alterations in carcinogenesis and tumor biology and may thus be predictive of the biologic behavior of the tumor (12). Radiomics is also an effective method for assessing the morphologic and textural changes of the liver that are associated with various disease processes. Unlike visual assessments of clinical images, it may allow for objective and comprehensive assessments of these changes based on quantitative indices.
Radiomics Features
A number of radiomics features can be extracted from a given volume of interest (VOI) drawn on two-dimensional (2D) images or three-dimensional (3D) volume data. Radiomics features can be divided into morphologic features, histogram features, textural features, and higher-order features.
Morphologic Features
Morphologic features describe the size, volume, and shape of the VOI, usually for tumors. Unlike a visual assessment of tumor morphology by radiologists, morphologic features are expressed as statistical values in radiomics (Fig. 1). For example, the circularity on a 2D image describes the ratio of the area to the perimeter of a given VOI, reflecting how close the VOI is to a complete circle (34).
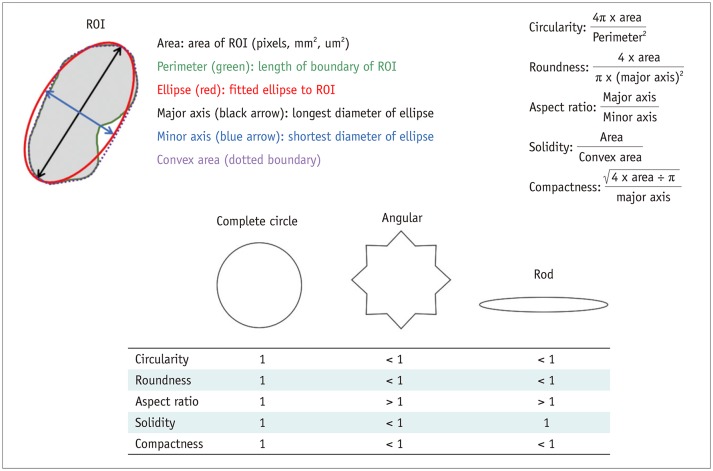 | Fig. 1Schematic description of morphologic features.Area and perimeter are calculated from ROI drawn on image. Ellipse fitted to given ROI is obtained. Then, major and minor axes of ellipse and convex area are calculated. Based on these values, morphologic features (circularity, roundness, aspect ratio, solidity, compactness, and others) are calculated according to equations shown in Figure 1. Values of morphologic features for angular and rod shapes are compared with those for complete circle, which has value of 1 for all morphologic features. ROI = region of interest
|
Histogram Features
A histogram is a plot displaying the pixel frequency in accordance with pixel values. Multiple features can be calculated from a histogram, which describe the magnitude (mean), dispersion (standard deviation), asymmetry (skewness), peakedness or flatness (kurtosis), randomness (entropy), uniformity (energy and uniformity), and dispersion relative to the magnitude (coefficient of variation) of gray-level pixel values. These histogram features describe the distribution pattern of gray-level pixel values within a VOI as a whole, but cannot address the spatial relationship among pixels or the textural pattern (456) (Fig. 2).
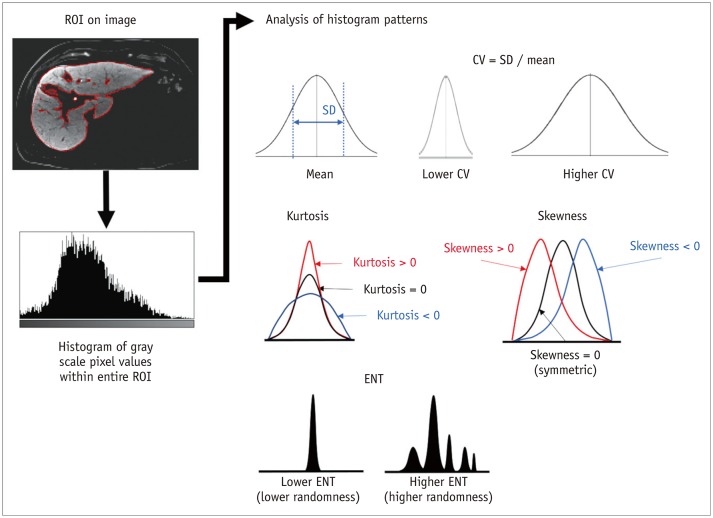 | Fig. 2Schematic description of histogram features.From ROI drawn on image, histogram of gray-scale pixel values is obtained. Then, multiple features are calculated from histogram to describe pattern of distribution of gray-level values within ROI. CV = coefficient of variation, ENT= entropy, SD = standard deviation
|
Textural Features
Textural features are a key component of radiomics features and describe the spatial relationship between each individual pixel and its neighboring pixels. Two commonly used matrices for textural analysis are the gray-level co-occurrence matrix (GLCM) and the gray-level run-length matrix (GLRLM). The GLCM is a matrix describing the frequency of two neighboring pixels with certain gray-level pixel values, while the GLRLM describes the length of a continuous pixel with a certain gray-level pixel value. Both the GLCM and GLRLM are dependent on direction. To improve directional invariance, textural features are calculated by aggregating information from different directional matrices
using several 2D or 3D-based methods (457) (Fig. 3).
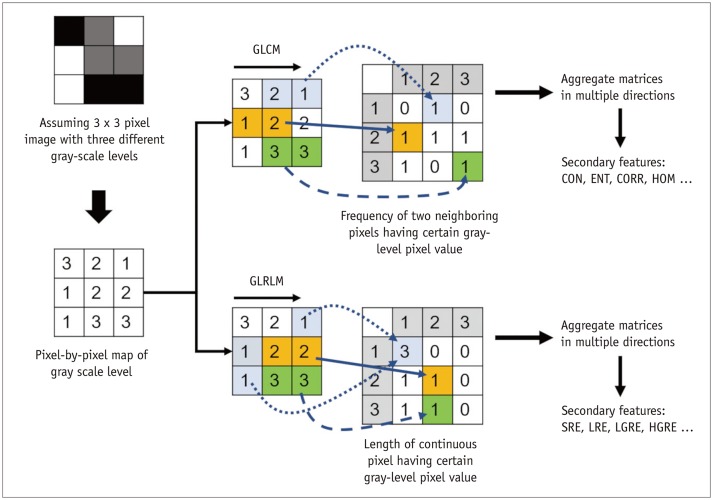 | Fig. 3Schematic description of textural feature extraction assuming 3 × 3-pixel image with three different gray-scale levels.GLCM describes frequency of two neighboring pixels having certain gray-level pixel values, while GLRLM describes length of continuous pixel having certain gray-level pixel value. After aggregating different directional matrices, secondary features are calculated from matrices to describe textural pattern of given image, including CON, ENT, CORR, and HOM, and others from GLCM and SRE, LRE, LGRE, and HGRE, and others for GLRLM. CON = contrast, CORR = correlation, ENT= entropy, GLCM = gray-level co-occurrence matrix, GLRLM = gray-level run-length matrix, HGRE = high gray-level run emphasis, HOM = homogeneity, LGRE = low gray-level run emphasis, LRE = long run emphasis, SRE = short run emphasis
|
Higher-Order Features
Higher-order features refer to textural features extracted from filtered images. Various filters have been used to emphasize the characteristics of images. A Gaussian filter is a smoothing filter that reduces the sensitivity to image noise. A Laplacian filter is an edge-enhancing filter. Since the Laplacian filter enhances any rapid intensity changes on an image, it may amplify image noise as well as edges. A Laplacian of Gaussian filter is a combination of both filters (1) and, thus, is frequently used to enhance edges while preventing amplification of image noise. Wavelets transform images using a matrix of complex linear or radial waves, allowing for the separation and emphasis of a high-frequency component (i.e., edge part) or low-frequency component (i.e., smooth part) of the images (578) (Fig. 4).
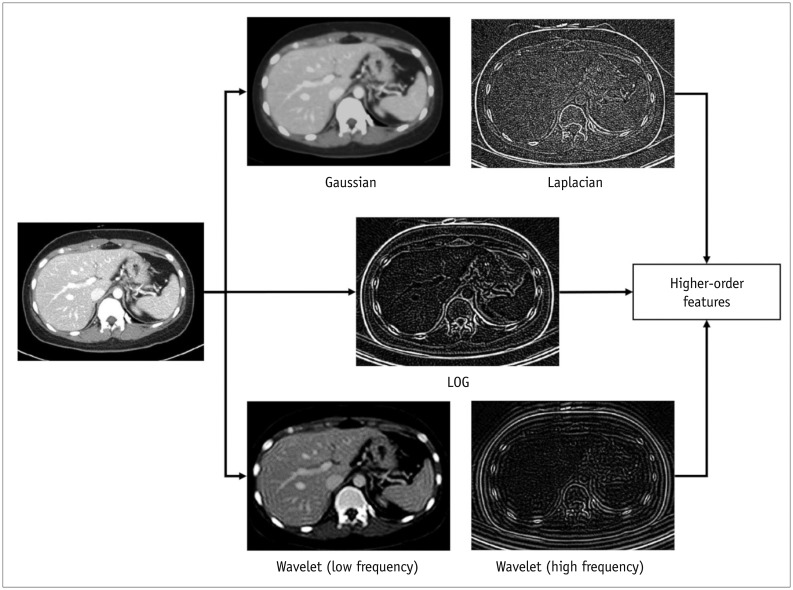 | Fig. 4Example images depicting effects of image filters.Portal venous phase CT image was transformed by using Gaussian, Laplacian, and LOG filters and using wavelet transformation of high-frequency and low-frequency parts. Higher-order features are histogram and textural features extracted from these transformed images. LOG = Laplacian of Gaussian
|
Process of Radiomics Analysis
The radiomics analysis of medical images involves multiple processes, including image preprocessing, segmentation, feature extraction, feature selection, and classification.
Image preprocessing is an important step for achieving valid and reproducible radiomics features. Image normalization may be required to standardize the gray-scale pixel value, and it can be performed based on the histogram distribution of pixel values or internal reference values (i.e., spleen signal value). Since textural and higher-order features are dependent on pixel dimensions, images with non-isometric pixels or variable resolutions may lead to invalid results. In these cases, the image resolution should be standardized by the resampling the images at a fixed isometric resolution. After image preprocessing, the segmentation of VOIs is performed manually or by using an automatic segmentation algorithm to select the volume or area for which the radiomics features are extracted.
Radiomics features can be extracted in 2D or 3D using in-house software (6910111213) or commercial software (1415). The number of extracted features can be variable, largely depending on the number of textural features and the number of filters used for extracting higher-order features.
A larger number of extracted features do not necessarily indicate better-quality measurements. Since radiomics features are highly correlated with each other (16), the analysis of high-dimensional features may lead to problems of multicollinearity and overfitting. A recent phantom study revealed that the information provided by multiple radiomics features could be summarized using only 10 features because of redundancy (16).
Feature selection is a process performed to reduce the dimensionality of features by selecting informative and reliable features and excluding redundant features among the extracted features. Classification is a process used to build a classifier or prediction model using the selected feature to perform a given classification or prediction task. Feature selection and classification can be performed together as a single process or separately using different algorithms. Unreliable features may be excluded prior to feature selection and classification, based on the results of inter- or intra-observer agreement or test-retest repeatability analyses (6111718192021). To reduce redundancy in the features, informative features showing a high dynamic range may be selected among the correlated features in hierarchical feature clustering (1822). Traditional statistical methods may not be successful in dealing with high-dimensional radiomics features (i.e., too many variables relative to the number of observations). A number of machine learning methods have therefore been used for feature selection and/or classification (10212324). Among the methods for feature selection and classification, regression with Ridge, least absolute shrinkage and selection operator (LASSO), and elastic net regularization have been commonly used (61011121317192526), likely because these algorithms allow for the development of a regression model that is more familiar to radiologists than other machine learning classifiers. These regression analyses incorporate regularization and penalization algorithms for correlated variables; the LASSO regression method is robust for feature selection, but the Ridge regression is more effective in dealing with multicollinearity. Elastic net regression takes advantage of both methods (627). Other commonly used classification methods include regression, support vector machine (SVM), decision tree, and random forest. In machine learning, hyperparameters to control the machine learning process need to be optimized to different data patterns. Following hyperparameter optimization, the machine learning algorithm is trained through the learning process using given training data (28). Figure 5 schematically depicts the development process of a radiomics classification model.
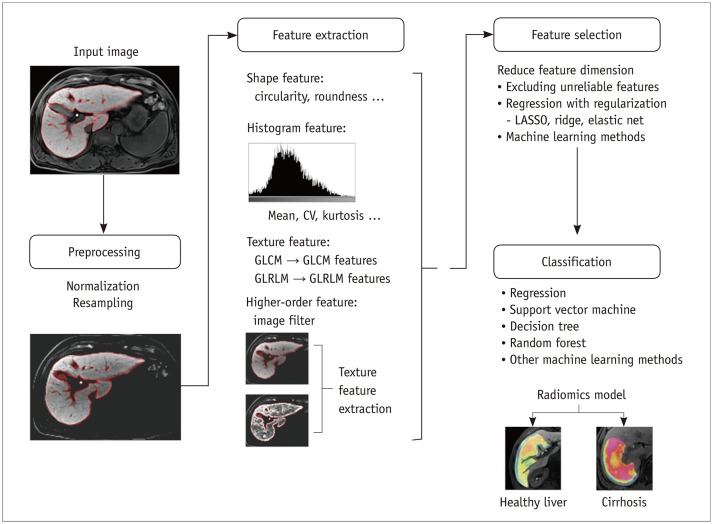 | Fig. 5Schematic description of development process for radiomics classification model.Model for staging liver fibrosis using gadoxetic acid-enhanced hepatobiliary phase magnetic resonance images is assumed for demonstration purposes. Input images undergo preprocessing, including normalization of gray-scale pixel values and image resampling to standardize image resolution. Radiomics features are then extracted, which may include shape, histogram, texture, and high-order features. Feature selection is performed to reduce feature dimension, and classification model is then developed using selected radiomics features. Final radiomics model is used for classification of new input images. LASSO = least absolute shrinkage and selection operator
|
Go to :
Clinical Application of Radiomics in Liver Disease
Radiomics has been used to evaluate the severity of chronic liver disease and assess the prognosis of malignant liver tumors. The study methodology and the results of some representative reports are presented in Table 1.
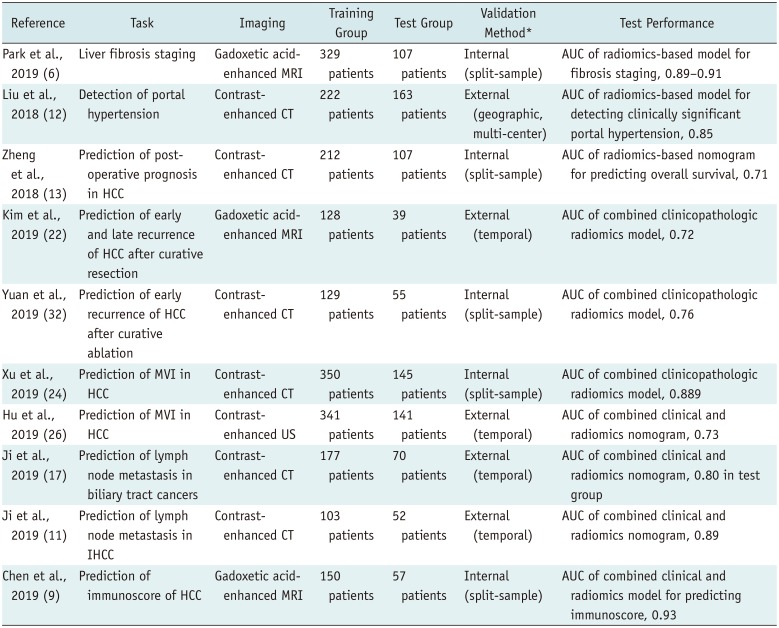
Table 1
Representative Studies on Clinical Application of Radiomics in Liver Disease
| Reference | Task | Imaging | Training Group | Test Group | Validation Method* | Test Performance |
|---|---|---|---|---|---|---|
| Park et al., 2019 (6) | Liver fibrosis staging | Gadoxetic acid-enhanced MRI | 329 patients | 107 patients | Internal (split-sample) | AUC of radiomics-based model for fibrosis staging, 0.89–0.91 |
| Liu et al., 2018 (12) | Detection of portal | Contrast-enhanced CT | 222 patients | 163 patients | External (geographic, multi-center) | AUC of radiomics-based model for detecting clinically significant portal hypertension, 0.85 |
| Zheng et al., 2018 (13) | Prediction of post-operative prognosis in HCC | Contrast-enhanced CT | 212 patients | 107 patients | Internal (split-sample) | AUC of radiomics-based nomogram for predicting overall survival, 0.71 |
| Kim et al., 2019 (22) | Prediction of early and late recurrence of HCC after curative resection | Gadoxetic acid-enhanced MRI | 128 patients | 39 patients | External (temporal) | AUC of combined clinicopathologic radiomics model, 0.72 |
| Yuan et al., 2019 (32) | Prediction of early recurrence of HCC after curative ablation | Contrast-enhanced CT | 129 patients | 55 patients | Internal (split-sample) | AUC of combined clinicopathologic radiomics model, 0.76 |
| Xu et al., 2019 (24) | Prediction of MVI in HCC | Contrast-enhanced CT | 350 patients | 145 patients | Internal (split-sample) | AUC of combined clinicopathologic radiomics model, 0.889 |
| Hu et al., 2019 (26) | Prediction of MVI in HCC | Contrast-enhanced US | 341 patients | 141 patients | External (temporal) | AUC of combined clinical and radiomics nomogram, 0.73 |
| Ji et al., 2019 (17) | Prediction of lymph node metastasis in biliary tract cancers | Contrast-enhanced CT | 177 patients | 70 patients | External (temporal) | AUC of combined clinical and radiomics nomogram, 0.80 in test group |
| Ji et al., 2019 (11) | Prediction of lymph node metastasis in IHCC | Contrast-enhanced CT | 103 patients | 52 patients | External (temporal) | AUC of combined clinical and radiomics nomogram, 0.89 |
| Chen et al., 2019 (9) | Prediction of immunoscore of HCC | Gadoxetic acid-enhanced MRI | 150 patients | 57 patients | Internal (split-sample) | AUC of combined clinical and radiomics model for predicting immunoscore, 0.93 |
*Validation methods were classified as internal (i.e., cross-validation, bootstrapping, and split-sample validation) or external (temporal and geographic validation). AUC = area under curve, HCC = hepatocellular carcinoma, IHCC = intrahepatic cholangiocarcinoma, MVI = microvascular invasion, US = ultrasound
![]()
Chronic Liver Disease
Chronic liver disease is accompanied by changes in liver volume, morphology, and texture. Several recent studies have shown the potential value of radiomics as a method for comprehensive and objective analysis of such changes in the liver using imaging examinations. Park et al. (6) developed a radiomics fibrosis index based on radiomics features extracted from gadoxetic acid-enhanced hepatobiliary phase magnetic resonance (MR) images. They demonstrated that the radiomics fibrosis index had a high diagnostic performance in staging liver fibrosis (area under the receiver-operating curve [AUROC], 0.89–0.91) and significantly outperformed the normalized liver enhancement and serum fibrosis indices. Liu et al. (12) reported the feasibility of CT-based radiomics analysis for the diagnosis of clinically significant portal hypertension. These authors devised a model based on texture features, morphologic features, and the liver and spleen volumes with the hepatic venous pressure gradient as the reference standard. The performance of this model was significantly better than were those of models using liver stiffness measurements as well as other radiologic and clinical indices (12). Several exploratory studies have indicated the potential of radiomics of multiparametric ultrasound (21) and histogram features of CT images (2930) in staging liver fibrosis and in diagnosing nonalcoholic steatohepatitis. However, the results of these studies were not conclusive because of the small study populations and the lack of proper validation (212930).
Prognostication of Malignant Liver Tumors
Radiomics has been applied to determine the prognosis of hepatocellular carcinoma (HCC) after radiofrequency ablation (3132), surgical resection (1322253133), and liver transplantation (20). Zheng et al. (13) developed nomograms incorporating CT-based radiomics and clinical variables to predict recurrence-free and overall survival outcomes after surgical resection of solitary HCC and reported that these nomograms had better prognostic performance than traditional staging. Kim et al. (22) devised radiomics models for predicting the early and late post-surgical recurrence of HCC using gadoxetic acid-enhanced MRI, incorporating variable extents of peritumor border extension. In that study, a radiomics model with 3-mm or 5-mm peritumoral border extension showed a higher prediction performance than the models without a border extension, indicating that the features of a peri-tumor liver parenchyma are important for predicting early or late recurrence in HCC patients. Since microvascular invasion (MVI) is one of the most important prognostic factors for HCC after surgery (343536), several studies have evaluated the potential of using radiomics to predict it (10242637). Xu et al. (24) developed a prediction model combining a CT-based radiomics score, radiologist image analysis, and laboratory findings and demonstrated a high accuracy (AUROC, 0.889) for predicting MVI in a test dataset. In their study, however, subsequent decision curve analysis failed to demonstrate the incremental value of the radiomics score in comparison with conventional visual image analysis. Two prior studies have reported the incremental value of a CT-based radiomics model in predicting lymph node metastases in patients with cholangiocarcinoma, and noted that incorporating a radiomics signature into the CT-reported lymph node status improved the detection of lymph node metastasis (1117). A recent study (9) has also demonstrated the potential role of radiomics features extracted from gadoxetic acid-enhanced hepatobiliary MR images in assisting with precision immunotherapy of HCC. This study showed that a model combining radiomics and clinical variables accurately predicted the immune-score, which is known to be associated with the therapeutic response to an immune checkpoint blockage (9).
Go to :
Pitfalls of Radiomics
There are some disadvantages to using radiomics approaches. These methods are labor-intensive and time-consuming as they involve segmentation, feature extraction, and machine learning or modeling processes. Hence, a radiomics study will only produce real clinical value if it generates incremental diagnostic information beyond that obtained with classic visual image interpretation. Radiomics features are also highly dependent on the imaging protocol, VOI selection, and feature extraction methods. All of these factors may be sources of variation in terms of extracted radiomics features (163839). Radiomics models or classifiers thus have inherent limitations in terms of generalization. Optimal image preprocessing, including gray-level normalization and resolution standardization, may partly overcome the imaging protocol dependency of radiomics features. Recently, an algorithm has been proposed that reduces the variation in radiomics features according to different CT protocols, and thus facilitates radiomics analysis using multicenter image data (40). Further research is warranted to develop an optimal method of minimizing the variations in radiomics features. Textural features are also dependent on settings for feature extraction, such as bin size (i.e., the size of gray-level discretization). Research papers on radiomics should therefore clearly state the methods used for radiomics feature extraction so that they can be replicated. The lack of a standardized method for radiomics feature extraction has been an important cause of the poor generalizability of radiomics studies. To overcome this problem, the Image Biomarker Standardization Initiative recently published consensus guidelines to standardize the methods for image processing, the nomenclature and definitions of radiomics features, and the reporting methods (4). A recent review article has further suggested some strategies for reproducible and generalizable radiomics analysis (39). These methodological guidelines may be useful for improving the generalizability of radiomic studies.
Go to :
Deep Learning
Deep learning is a subset of machine learning, which is based on a neural network structure inspired by the human brain (4142). Unlike radiomics and traditional machine learning, which rely on predefined, hand-engineered features, deep learning is based on representation learning in which the algorithm learns the best features to carry out a given task on its own by navigating the provided data.
Convolutional Neural Network
Convolutional neural network (CNN) is the most popular type of deep learning architecture in medical imaging analysis (4142). A CNN consists of an input layer, hidden layers, and the output layer. The hidden layers may include convolution and pooling layers and fully connected layers. Convolution and pooling layers extract high-dimensional manageable features from given images, which is conceptually similar to the feature extraction process used in radiomics analysis. Convolution operations generate feature maps using a group of filters, followed by activation functions typically using a rectified linear unit. Activation functions add nonlinearity to the outputs of convolutions, allowing the selection of features to pass through to the next layer. Pooling operations reduce the resolution of the feature maps to gain computational performance, obtain spatially invariable features, and reduce the chance of overfitting (4143). The fully connected layers integrate and transform all of the features fed from the convolution and pooling layers into a vector form. The output layer then returns a categorical distribution for class probability through a softmax function. The details of deep learning and CNN can be understood further from previous review articles (4142). Figure 6 schematically presents the architecture and training process of a CNN algorithm.
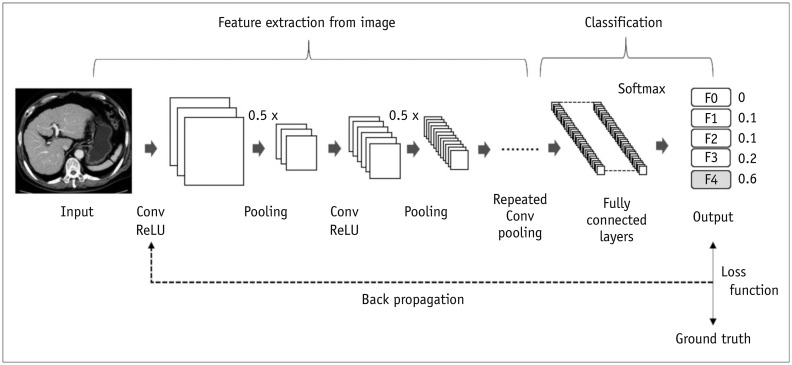 | Fig. 6Schematic depiction of training CNN.From input images, Conv layer extracts feature maps, and pooling layer downsizes feature maps. ReLU is usually followed by Conv layer as activation function. High-level features are extracted through multiple Conv and pooling layers, and then fed into fully connected layer. Fully connected layers integrate all features to perform classification task. In this schematic diagram, liver fibrosis staging using CT images is presented as classification task for demonstration purposes. Using softmax function, fully connected layer returns probability of each class as output. During training phase, output of CNN is compared with ground truth to calculate errors using loss function. Error is then back propagated, and weights of network are adjusted to decrease loss and thereby maximize accuracy of CNN for given classification task. CNN = convolutional neural network, Conv = convolution, ReLU = rectified linear unit
|
Training of a Deep Learning Algorithm
The training of a deep learning algorithm is usually performed with supervised learning using labeled training data. A deep learning algorithm typically requires large volumes of high-quality ground truth training data, although the amount of required data may vary for different deep learning algorithm tasks: an algorithm for a segmentation task may require a smaller dataset, while a classification task requires a much larger dataset (44). When a training dataset is not sufficiently large, data augmentation may be used to enlarge it artificially, which is performed through random transformation of original images by adding random noise, flipping, or rotation (41). Data augmentation may also be required to overcome the potential problems of data imbalance. If the size of the training data is imbalanced across different classes, a classification algorithm may have poor classification accuracy for the minority classes (45). This may be prevented by data augmentation for those classes. Datasets for the development and validation of a deep learning algorithm typically consist of training, validation, and test datasets. The data available for the development of the algorithm may be divided into training and validation datasets. The validation dataset is used for monitoring the performance of the algorithm during the training process and/or comparing multiple models based on different CNN architectures or hyperparameters. Once the final model is selected and all its parameters are fixed, its performance is evaluated in the test dataset. The test dataset is used only at the final step of the study to report the final model performance (41). A deep learning algorithm is trained by adjusting network weights. Starting from a random initial configuration, parameters are adjusted to find a set of parameters that perform best on the training dataset. During the training phase, the output of the algorithm is compared with the ground truth by using a loss function that quantitatively measures the error in the prediction in comparison with the ground truth. The error is then back propagated to optimize network weights (Fig. 6). The training phase continues until the loss function reaches a minimum.
Go to :
Application of Deep Learning in Liver Disease
Deep learning has been widely applied to liver imaging for various tasks, including organ segmentation, staging liver fibrosis, tumor detection, or classification, and improving image quality. The study methodology and the results of some representative studies are summarized in Table 2.
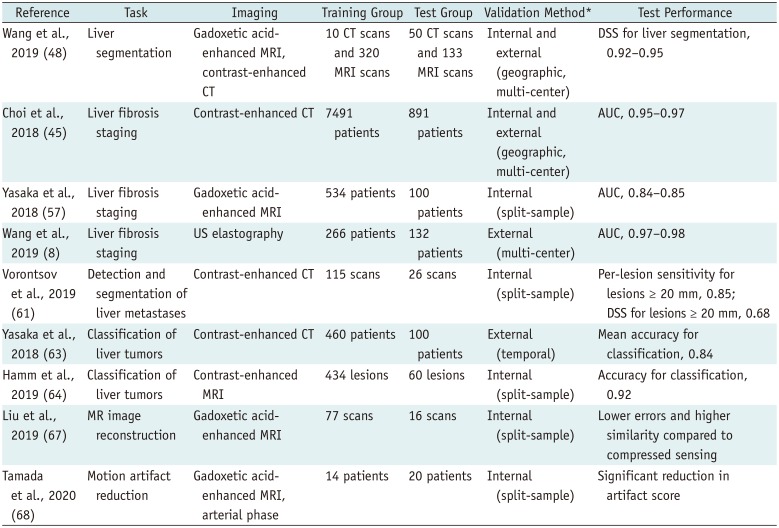
Table 2
Representative Studies on Clinical Application of Deep Learning in Liver Disease
| Reference | Task | Imaging | Training Group | Test Group | Validation Method* | Test Performance |
|---|---|---|---|---|---|---|
| Wang et al., 2019 (48) | Liver segmentation | Gadoxetic acidenhanced MRI, contrast-enhanced CT | 10 CT scans and 320 MRI scans | 50 CT scans and 133 MRI scans | Internal and external (geographic, multi-center) | DSS for liver segmentation, 0.92–0.95 |
| Choi et al., 2018 (45) | Liver fibrosis staging | Contrast-enhanced CT | 7491 patients | 891 patients | Internal and external (geographic, multi-center) | AUC, 0.95–0.97 |
| Yasaka et al., 2018 (57) | Liver fibrosis staging | Gadoxetic acidenhanced MRI | 534 patients | 100 patients | Internal (split-sample) | AUC, 0.84–0.85 |
| Wang et al., 2019 (8) | Liver fibrosis staging | US elastography | 266 patients | 132 patients | External (multi-center) | AUC, 0.97–0.98 |
| Vorontsov et al., 2019 (61) | Detection and segmentation of liver metastases | Contrast-enhanced CT | 115 scans | 26 scans | Internal (split-sample) | Per-lesion sensitivity for lesions ≥ 20 mm, 0.85; DSS for lesions ≥ 20 mm, 0.68 |
| Yasaka et al., 2018 (63) | Classification of liver tumors | Contrast-enhanced CT | 460 patients | 100 patients | External (temporal) | Mean accuracy for classification, 0.84 |
| Hamm et al., 2019 (64) | Classification of liver tumors | Contrast-enhanced MRI | 434 lesions | 60 lesions | Internal (split-sample) | Accuracy for classification, 0.92 |
| Liu et al., 2019 (67) | MR image reconstruction | Gadoxetic acidenhanced MRI | 77 scans | 16 scans | Internal (split-sample) | Lower errors and higher similarity compared to compressed sensing |
| Tamada et al., 2020 (68) | Motion artifact reduction | Gadoxetic acidenhanced MRI, arterial phase | 14 patients | 20 patients | Internal (split-sample) | Significant reduction in artifact score |
![]()
Liver Segmentation
Liver segmentation has direct clinical applications, including liver volume measurement, which is important in pre-operative planning for liver resection (4647), determination of the radiation dose in liver tumor radioembolization, and measurement of quantitative indices such as the proton density fat fraction (PDFF) from the whole liver (48). Notably, however, liver segmentation is labor-intensive and time-consuming, which limits its usage in clinical practice. Thus, deep learning has been applied for automated segmentation of the liver. The U-net architecture is most commonly used for segmentation tasks (49) and consists of a series of contracting and expanding layers that extract and process features from input images and return a pixel-wise probability map. The segmentation performance is typically evaluated using the Dice similarity score (DSS), defined as 2 × true positive pixels / [2 × true positive pixels + false negative pixels + false positive pixels]. Some prior studies have reported the use of deep learning algorithms for automated liver segmentation on CT or MRI (5051525354), and some have utilized a deep learning algorithm combined with image processing methods (5052). All of these studies reported high performance values in liver segmentation, with the reported DSS values ranging from 0.92 to 0.95 (5051525354). Recently, Wang et al. (48) demonstrated the feasibility of generalized CNN, which can be used for liver segmentation on CT scans and various MRI sequences using the transfer learning technique. They reported DSS values ranging from 0.92 to 0.95 for liver segmentation on CT and MR images. Furthermore, these authors demonstrated a close agreement between the PDFF values measured using deep learning-based automatic liver segmentation and those measured by manual liver segmentation, indicating the potential role of deep learning-based liver segmentation for automatic measurement of quantitative indices from the whole liver. Despite these promising results, however, further clinical validation may be required for the actual clinical application of deep learning algorithms for automated liver segmentation. For example, algorithm performance should be evaluated in a healthy liver, fatty liver, and in chronic liver disease and liver cirrhosis. With continued improvements in deep learning-based organ segmentation methods, it is expected that fully automated liver segmentation would become clinically available in the near future.
Liver Fibrosis Staging
A few deep learning algorithms for liver fibrosis staging have been reported, to date. Liu et al. (55) proposed sequential algorithms to diagnose cirrhosis using ultrasound images, which first detect liver capsules on the images by using a sliding window detector, extract features from image patches by using a CNN algorithm, and finally classify an image as indicative of cirrhosis or not by using an SVM. In that report, CNN was used only for feature extraction whereas classification was performed with the SVM because of the small amount of training data. Yasaka et al. (56) developed CNN algorithms for liver fibrosis staging using cropped CT images and cropped gadoxetic acid-enhanced hepatobiliary phase MR images (57). They reported area under the curves (AUCs) of 0.73–0.76 for the CT-based algorithm and 0.84–0.85 for the MRI-based algorithm in staging liver fibrosis. However, the use of a small test dataset (100 patients) and lack of any external validation limited the generalizability of their study results. Choi et al. (45) reported the use of a deep learning algorithm for fully automated liver fibrosis staging using portal venous phase CT images. Using a large training dataset (7491 patients) and internal and external test data (891 patients), these authors reported a high accuracy (AUCs, 0.95–0.97) of the deep learning algorithm in liver fibrosis staging, surpassing that of the serum fibrosis indices and visual image analyses by radiologists. A recent multicenter prospective study reported a higher accuracy (AUCs, 0.97–0.98) with a deep learning algorithm using cropped 2D shear wave elastographic images in staging liver fibrosis in comparison with liver stiffness measurement results (8).
Diagnosis of Fatty Liver Disease
The feasibility of using deep learning for the diagnosis and grading of fatty liver disease using ultrasound images has been evaluated in several previous reports (585960). Although these prior studies demonstrated the technical feasibility of deep learning, its clinical applicability has not been well proven because of the small size of the test data, lack of external validation, and the use of a less reliable reference standard (i.e., ultrasound determined fatty liver grade).
Detection, Segmentation, and Classification of Liver Tumors
Vorontsov et al. (61) have reported the use of a deep learning algorithm for the automatic detection and segmentation of malignant liver tumors on CT images. In a small test dataset (26 CT examinations) in that study, the algorithm showed high accuracy in detecting liver lesions larger than 2 cm with a sensitivity of 85% and positive predictive value of 94%, whereas it was not accurate in the detection of small lesions (sensitivity, 10% for lesions < 1 cm) or in automatic tumor segmentation (DSS of 0.14–0.68). Schmauch et al. (62) also described the technical feasibility of applying deep learning to the detection of focal liver lesions using ultrasound images. The potential utility of deep learning for the classification of focal hepatic lesions has now been evaluated in several studies, all of which devised deep learning algorithms to classify liver lesions into five to six predefined categories based on manually cropped CT or MR images containing these lesions (6364). Yasaka et al. (63) developed an algorithm for classifying liver masses using multi-phasic CT images and reported an accuracy of 84% in the test dataset. Hamm et al. (64) reported the results of algorithms based on multiphasic MRI, describing an accuracy of 90% for lesion diagnosis and 92% for lesion categorization based on the liver imaging reporting and data system. The same researchers (54) also demonstrated the feasibility of deep learning in identifying individual radiologic features of focal hepatic lesions on MR images, reporting a sensitivity of 82.9% and positive predictive value of 76.5% for the algorithm. Despite these promising results, however, all prior studies on the application of deep learning to liver lesion detection and characterization are considered preliminary. These earlier reports focused mainly on the technical feasibility of deep learning, since the algorithms used involved data processes not suitable for a real clinical workflow (e.g., image cropping by radiologists) and were not fully validated using a large-scale external dataset.
Image Quality Improvement and Image Synthesis
Deep learning has now been used for automatic evaluation of image quality (6566). Ma et al. (65) reported a deep learning algorithm to identify technically optimal portal venous phase CT images. Esses et al. (66) described an algorithm to discriminate diagnostic and nondiagnostic T2-weighted MR images. With further improvements, these techniques may be clinically usable for real-time scanning optimization through automatic image quality monitoring. Recent research findings have further suggested the potential utility of deep learning as a method to improve MR image quality (6768). Tamada et al. (68) presented a method to reduce respiratory motion artifacts in gadoxetic acid-enhanced arterial phase MR images using a CNN algorithm. Liu et al. (67) developed a deep-learning-based MR image reconstruction algorithm by adopting generative adversarial networks (GANs). These authors demonstrated that their GAN-based reconstruction algorithm produced superior image quality in comparison with a reconstruction algorithm based on compressed sensing and parallel imaging. This suggested the potential of deep learning-based image reconstruction combined with data under-sampling for fast MRI.
Go to :
Clinical Validation of Radiomics Models and Deep Learning Algorithms
Radiomics models and deep learning algorithms are subject to the overfitting problem since they are based on numerous image-derived parameters. Overfitting refers to a condition whereby a model customizes itself too much to the training data, to the extent that it explains not only generalizable patterns but also noise and idiosyncratic statistical variations of the training data (6970). An overfitted model performs well on the training data but poorly on other data, reducing the generalizability of the model. Rigorous clinical validation is therefore required for all radiomics and deep learning algorithms. Internal validation methods such as cross-validation, bootstrapping, and split-sample validation (i.e., splitting the entire dataset randomly into training and the validation data) may not sufficiently guarantee the generalizability of radiomics models or deep learning algorithms (7071). External validation using a separate dataset is preferred, which may be conducted using data collected from a different site (i.e., geographic validation) or during a different period from the training data (i.e., temporal validation). In addition, clinical validation needs to be performed in a relevant clinical setting where the radiomics models or deep learning algorithms are actually applied. Further details regarding the clinical validation of artificial intelligence models can be found in previous reviews (7072). Guidelines for transparent reporting of a multivariable prediction model (717374) can also be used as references for choosing proper methods for model development and validation.
Go to :
CONCLUSION
Radiomics and deep learning are promising techniques for imaging assessment of liver diseases. Recent research findings have demonstrated the potential utility of radiomics and deep learning in staging liver fibrosis, detecting portal hypertension, characterizing focal hepatic lesions, prognosticating malignant hepatic tumors, and segmenting liver and liver tumors. However, as reported in a recent study (75), most previous investigations have focused mainly on the technical feasibility of using radiomics or deep learning algorithms, whereas their applicability and generalizability to actual clinical practice has not been fully evaluated. For radiomics or deep learning algorithms to become a valid clinical tool, their performance should be validated through properly conducted clinical tests. In addition, future research endeavors need to address the clinical impact of radiomics and deep learning and determine how these techniques can be incorporated into real-world clinical practice.
Go to :
 XML Download