

 PDF
PDF ePub
ePub Citation
 Print
Print


Introduction
Ultrasonography is widely used for the prenatal evaluation of fetal weight, achieved through various morphometric formulae. Most of these formulae combine basic biometric parameters such as biparietal diameter (BPD), head circumference (HC), abdominal circumference (AC) and femur length (FL).1 The Hadlock and Shepard methods are the most commonly used, with a limitation of 62% sensitivity and 93% specificity for the Hadlock method for the prediction of fetal macrosomia, and a 21% sensitivity and 99% specificity for the Shepard method.2 Consequently, other sonographic parameters with higher predictive values for fetal weight are required. Formulae using fetal parameters such as liver dimension, cerebellar diameter, kidney length, upper arm soft tissue thickness, femur volume, and cheek-to-cheek diameter have been developed but are not always accurate.2345
Fat content is related to energy source and fat mass is often used in the evaluation of nutritional status. Fat constitutes 12 to 14% of the birth weight (BW) and has been demonstrated to account for 46% of the variance noted in neonatal weight.6 Some previous studies assessed the relationship between ultrasonography fat mass and neonatal BW.789 These ultrasonography-derived anthropometric evaluations of fetal body fat composition showed significant correlations with BW and estimated fetal weight (EFW).
Fetal subcutaneous tissue thickness (SCTT) observed on ultrasonography examination in the second or third trimester has not been clarified, although it is an indicator of poor perinatal and neonatal outcomes. Moreover, there is a lack of information on SCTT detected during pregnancy in the normal maternal condition. Some studies focused on SCTT measurement for assessing BW;1011 however, in these studies, specific areas such as mid-arm, mid-thigh, or subscapular fat mass were measured. Thus, we evaluated BW considering SCTT in Hadlock biometry method which are using in widely.
Therefore, in this study, we measured the third trimester SCTT on routine ultrasonography fetal biometry during normal pregnancy. We compare the perinatal and neonatal outcomes of fetuses and the differences between BW and EFW in fetuses with or without SCTT.
Methods
1. Patients
This was a retrospective observational study that enrolled pregnant women with fetuses of gestational ages between 37+0 and 41+6 weeks. Gestational age was determined based on the last menstrual period and confirmed via an early ultrasonography scan in all cases. The women visited the outpatient obstetrics ultrasonography clinic of Konkuk University Medical Center between 1st January 2013 and 31st December 2015. The inclusion criteria were a healthy singleton pregnancy, the absence of fetal anomalies, and the absence of abnormalities during delivery. The exclusion criteria were preterm delivery, multiple pregnancies, preeclampsia, maternal diabetes mellitus, maternal gestational diabetes mellitus, maternal chronic hypertension, fetal growth restriction, and fetal anomalies. In total, 856 women were recruited and divided in two groups as follows: SCTT group (n=46) and non-SCTT group (n=810).
2. Ultrasonography scans
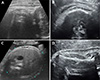
Data from routine ultrasonography examinations performed the week before delivery were reviewed and compared. Ultrasonography biometric parameters were measured, including BPD, HC, AC, FL, and humerus length (HL) to calculate EFW. Additionally, SCTT was defined as the thickest inner-to-inner distance of sonolucent areas under the skin level in the routine biometric parameters of fetal BPD, HC, AC, FL and HL during ultrasonography measurement. All measured values were averaged with respect to each individual. If SCTT was observed in two or more sites during measurement, the average SCTT was calculated (Fig. 1). Positive SCTT group was defined as prominent SCTT measurement group. Negative SCTT group was defined as non measureable SCTT group due to abscent or minimal to visualization. This study was approved by the Institutional Review Board of Konkuk University Hospital (project number: KUH1040062).
3. Statistical analysis
Differences in clinical characteristics and neonatal outcomes were analyzed using the Chi-squared test and Mann-Whitney U test. To compare differences between BW and EFW, the Wilcoxon signed-rank test and paired t-test were used. To assess the relationship among BW, SCTT, and EFW, Spearman's correlation was used, and linear regression was used for the equation model of BW. The data analysis was performed using the Statistical Package for Social Sciences for Windows, version 18.0 (SPSS Inc., Chicago, IL, USA). A P-value of <0.05 was considered statistically significant.
Results
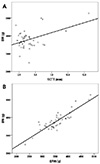
The incidence of SCTT was 5.4% and the averaged SCTT ranged from 2.6 to 13.4 mm. The clinical characteristics of both groups before delivery are summarized in Table 1. EFW determined by ultrasonography, amniotic fluid index, and cesarean section rate was higher in the SCTT group than in the non-SCTT group. No significant differences in parity, maternal age, maternal pre-pregnancy body mass index, maternal glucose levels, or gestational age at delivery were found between the groups. Uterine artery Doppler ultrasonography and fetal middle cerebral artery Doppler ultrasonography showed no abnormal findings in either group. The postpartum outcomes of the SCTT and non-SCTT groups are summarized in Table 2. No significant differences were found in Apgar score, neonatal intensive care unit admission rate, meconium staining, or neonatal hemoglobin levels between the groups. However, neonatal BW was significantly higher in the SCTT group than in the non-SCTT group (3,714 vs. 3,140 g, P<0.001). Differences between the mean EFW determined by ultrasonography and BW were statistically noted in the SCTT group but not in the non-SCTT group (SCTT group: EFW 3,460±472 g, BW 3,779±496 g, P=0.013; non-SCTT group; EFW 3,011±436 g, BW 3,090±468 g, P=0.324) (Table 3). Moreover, in the SCTT group, positive correlations were noted between BW and EFW or SCTT (EFW: r=0.443, P<0.001; SCTT: r=0.443, P<0.001) (Fig. 2). The regression model equation was as follows: BW=623.8+0.855*EFW+33.0*SCTT (adjusted R2=0.770, F=76.3, P<0.001) (Table 4).
Discussion
Various ultrasonography formulae have been used to estimate fetal weight. EFW is generally calculated using the Hadlock formula, which involves ultrasonography parameters such as BPD, HC, AC, and FL.12 However, EFW and especially AC show a wide error range (±10%), which may affect clinical evaluation.111314 This error may have several contributing factors. For one, fat constitutes 12 to 14% of BW,15 and fetal fat tissue is detected on ultrasonography as SCTT, seen as hypoechoic lesions under the skin, similar to fetal SCTT. Therefore, estimating the amount of subcutaneous fat tissue via ultrasonography may be useful for detecting fetal growth abnormalities.
Several studies suggest that various ultrasonography parameters related to soft tissue thickness are useful for fetal weight estimation.2451617 Forouzmehr et al.16 showed that a strong positive correlation exists between fetal abdominal soft tissue thickness in the third trimester and fetal weight. Chen et al.17 demonstrated that soft tissue thickness at the fetus's abdomen and subscapular area is strongly correlated with fetal age. In the case of SCTT, Larciprete et al.1011 suggested that mid-arm, mid-thigh, abdominal, and subscapular SCTT were gestational age-specific reference values for fetal weight. Based on these studies, several EFW calculation formulae have been suggested.181920 However, these formulae have a large risk of error because identifying the correct ultrasonography plane is difficult with these techniques, and the observations may vary with physician ability. Therefore, we suggest that the ultrasonographic plane routinely used to determine BPD, HC, AC, FL, and HL be used to examine SCTT thickness in the third trimester.
In this study, the SCTT group showed an increased EFW and amniotic fluid index compared to the non-SCTT group. BW were more increased in the SCTT group than in the non-SCTT group. Because of the increased BW, the cesarean section rate was also increased in the SCTT group. Most of the cesarean sections were due to cephalopelvic disproportion. The difference between EFW and BW was significant only in the SCTT group. Additionally, since SCTT and EFW were significantly correlated with BW, an estimated equation for BW using EFW and SCTT was feasible. Therefore, appropriate care should be exercised if fetal SCTT is detected in third trimester biometry. Based on our result, this finding could be a sign that the weight of the fetus at delivery may be higher than that expected based on EFW.
This study was limited by its retrospective design and small size. Thus, analysis based on maternal characteristics including parity and indication of cesarean section will be necessary. Although, there was no difference in neonatal outcomes between the two groups in this study, a future large scale study could estimate adverse neonatal outcomes following the increased incidence of cephalopelvic disproportion and macrosomia. However, this study suggests a definition of SCTT based on the more popular fetal biometric evaluation of the Hadlock formula as against other formulae including specific measures such as mid-arm, mid-thigh or subscapular fat mass. For further study, we have designed a prospective longitudinal study of SCTT from its initial appearance and will suggest cut-off values for macrosomia. Adipose tissues are accumulated in the fetal subcutaneous area21 and some studies have indicated an association between maternal gestational diabetes mellitus or diabetes mellitus and fetal SCTT.2223 Thus, application with respect to maternal gestational diabetes mellitus or diabetes mellitus in pregnancy would be necessary.
In conclusion, fetal SCTT detected during routine biometric ultrasonography evaluation in the third trimester of pregnancy could suggest larger BW than EFW. Therefore, physicians should pay careful attention in such cases during assessments for delivery.


 XML Download