

 PDF
PDF ePub
ePub Citation
 Print
Print


Introduction
Cone-beam computed tomography (CBCT) is an imaging modality that provides a multiplanar view of the maxillofacial structures based on a reconstruction of multiple 2-dimensional images acquired around the patient's head. Even though the indications of CBCT for different diagnostic tasks have been well described, the modality is still inherently affected by the formation of multiple artifacts, such as those caused by high-density materials, the patient's movements, and the projection geometry.123 These artifacts are seen as alterations in the reconstructed image that do not accurately reflect the original situation, and may negatively affect the resulting image and its ability to provide a correct evaluation.2456
Multiple tools have been implemented by the manufacturers of CBCT units to correct different types of artifacts,4789 and variations have been observed in their level of effectiveness.456 The artifacts generated by high-density materials, such as gutta-percha, titanium, and zirconium,81011 pose a major challenge for professionals, and the effectiveness of the available tools is still debatable.568111213 The production of artifacts can be problematic for practitioners due to the way that metal artifact reduction (MAR) algorithms are activated in most machines, as they are either enabled or not before the acquisition begins. In clinical situations, this means that the professional may either choose whether to activate the MAR algorithm before the exam or perform 2 acquisitions to see whether the algorithm was effective or if it compromised the image; however, the latter option is unacceptable due to the unnecessary radiation exposure to the patient.
To balance these needs, some newer units, such as the OP300 Maxio (Instrumentarium Dental, Tuusula, Finland) and Cranex 3Dx (Soredex, Tuusula, Finland) have implemented an option in the unit menu to re-reconstruct the latest acquired image with the MAR algorithm activated or inactivated.13 Therefore, the operator now has 3 options to choose from before an acquisition: a) to perform the acquisition and reconstruction with the MAR algorithm disabled, b) to perform the acquisition and reconstruction with the MAR algorithm enabled, and c) to perform the acquisition and reconstruction with the MAR algorithm turned off, and to reconstruct the same volume a second time with the MAR algorithm turned on if the professional evaluates the exam and perceives that MAR might be useful. This enables the clinician to compare 2 reconstructions of the same volume, and it may be possible to obtain the advantages of the MAR algorithm without a new exam acquisition. The problem is that the manufacturers do not provide detailed information on how these multiple reconstructions work and whether the MAR algorithm is applied in the same way when it is enabled before and after the acquisition, so the real advantages of this possibility remain unknown.
Therefore, the aim of the present study was to evaluate the effectiveness of enabling the MAR algorithm before and after the acquisition on the reduction of artifacts in the tissue around a zirconium implant.
Materials and Methods
This study was conducted after receiving approval from the local research ethics committee (protocol number # 2.163.038).
Phantom
The phantom used in this study was a partially edentulous macerated human mandible. A zirconium oxide implant (Z-Look 3, Z-systems, Oensingen, Switzerland), measuring 4 mm×11 mm, was installed in the alveolus of the right first molar tooth. An epoxy resin-based bone substitute block (ERB) (18 mm×10 mm×7 mm) was placed in contact with the buccal cortical plate at the height of the middle level of the implant in the right mandibular first molar region with the aid of wax. The use of an ERB is important for the standardized selection of axial images evaluated without the presence of the implant. In addition, another ERB block of the same size was fixed in the buccal cortical plate of the most anterior region of the mandible to serve as a control area, free of pronounced effects from the artifacts.
CBCT scanning
The images were obtained with an OP300 Maxio unit (Instrumentarium Dental, Tuusula, Finland). The same acquisition parameters were used for all the scans: 90 kVp; 5 mA; voxel size, 0.2 mm; and field of view (FOV), 6×8 cm.
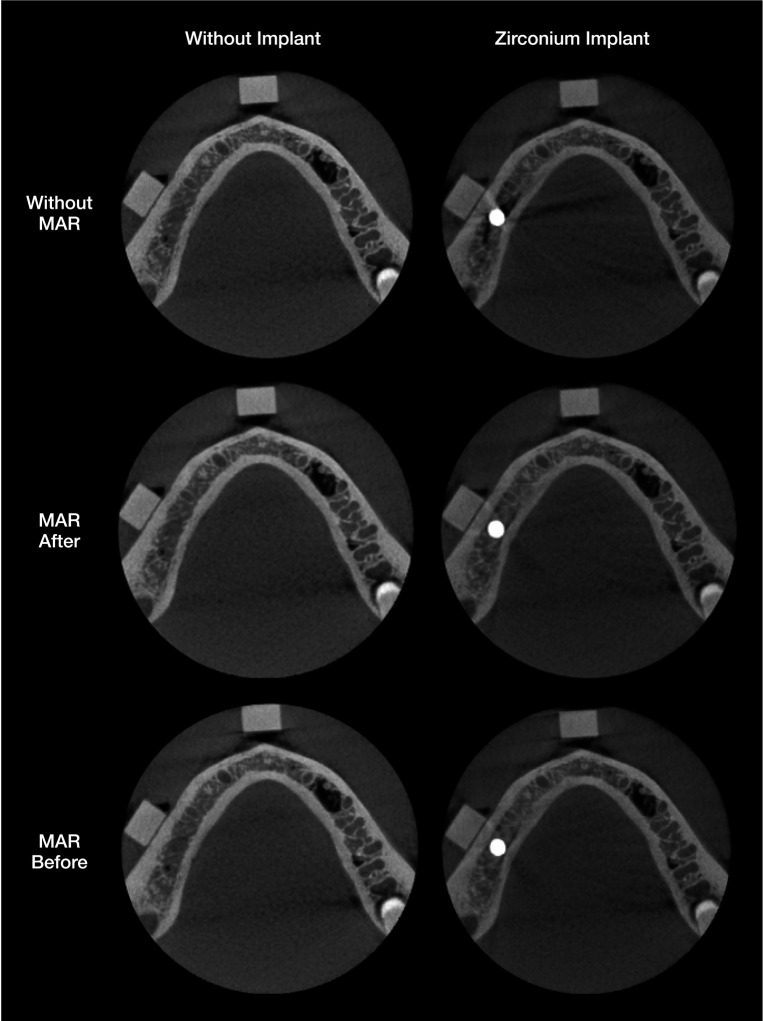
In this CBCT unit, 3 modes of using the MAR algorithm are available. All options were selected at different moments, resulting in 3 sets of images: no activation of the MAR algorithm, activation of the MAR algorithm immediately after the image acquisition, and activation of the MAR algorithm before the scan. Figure 1 presents sets of axial images from the control group (without the implant) and the zirconium implant group with the various MAR options used.
Prior to the CBCT scans, the phantom was inserted into a cylindric plastic container (16 cm in diameter) with the aid of an impression material, and it was filled with water in order to simulate in vivo interactions between the X-ray beam and soft tissues. Subsequently, this phantom was positioned on the platform of the OP300 Maxio unit and centered in the FOV with the aid of light orientation guides. Images were obtained of the implant group and the control group for the 3 conditions tested. To evaluate the reproducibility of the study, 5 acquisitions were obtained for each set of conditions: implant (with or without) and MAR options (without MAR, MAR after and MAR before the scans). This resulted in a total of 30 scans (2 implant conditions×3 MAR options×5 repetitions).
Image analysis
Artifacts were objectively evaluated performed using ImageJ software (National Institutes of Health, Bethesda, MD, USA). First, for each CBCT volume, 1 axial image was selected at the level where it was possible to visualize the upper level of the ERB block fixed in the buccal cortical plate near the implant area. This objective analysis was conducted by an oral radiologist with experience in image quality analysis under dim light conditions.
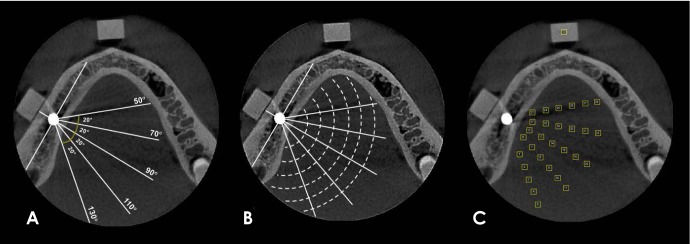
Subsequently, 29 regions of interest (ROIs) with the same size (2 mm×2 mm) were established on the axial image selected, using the ROI manager tool. The use of this tool is indispensable for the standardization of the position of ROIs. To determine the position of the ROIs, lines with different angulations in relation to the dental implant position and circles with different radii that were centered on the dental implant were established according to previously described methodologies.914
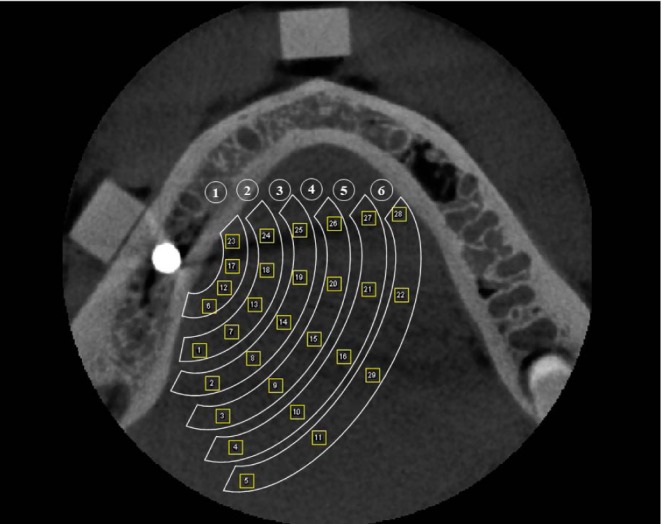
Figure 2 shows the lines and circles distributed around the dental implant according to the angulations and radii used. The 29 ROIs were distributed in 6 regions according to the length of the radius from the implant (region 1, 10 mm; region 2, 15 mm; region 3, 20 mm; region 4, 25 mm; region 5, 30 mm; region 6, 35 mm) (Fig. 3). Finally, the standard deviation (SD) values of the mean gray values for each ROI were obtained.
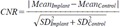
In addition, to calculate the contrast-to-noise ratio (CNR), it was necessary to determine an additional square ROI (Fig. 2C). This ROI was determined in an artifact-free control area located in the ERB block fixed in the most anterior mandibular region. The CNR was calculated according to the following equation:15
The magnitude of the artifacts was evaluated by comparing the SD and mean CNR of the ROIs located in each region.
Statistical analysis
The analysis was carried out using SPSS version 24.0 (IBM Corp., Armonk, NY, USA) and GraphPad Prism version 7.0 (GraphPad Software, La Jolla, CA, USA), with a significance level of 5%. The SD and CNR values of the different groups were compared using multi-way analysis of variance with the post-hoc Tukey test in order to evaluate the effectiveness of the MAR algorithm option in reducing the magnitude of the artifacts generated by the implant. The null hypothesis was that the MAR conditions would not influence the magnitude of the artifacts generated by the zirconium dental implant, as measured by SD and the CNR.
Results
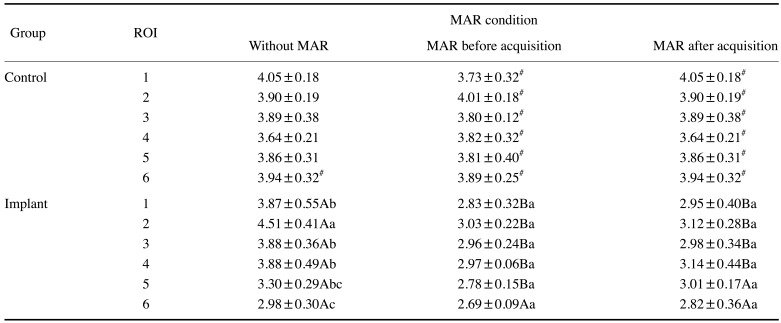
Table 1 shows the mean SD values of the ROIs located at different distances within the scanned volume. In the control group, there were no significant differences among the SD values of regions 1 to 6 in any of the 3 MAR conditions; furthermore, activation of the MAR algorithm did not influence the SD values in this group (P>0.05). For the implant group, in general, the regions closer to the implant (1 to 4) had higher SD values than the farther regions (5 and 6) in the acquisitions without MAR. In contrast, when MAR was activated (before or after), the SD values did not significantly differ among regions 1 to 6 (P>0.05). In addition, the SD values in regions 1 to 4 of the acquisitions with MAR (before or after) were significantly lower than the acquisitions obtained without MAR. In region 5, a lower SD value was found when MAR was activated before the acquisition than in the other 2 conditions, and in region 6, there were no significant differences among the 3 MAR conditions. A comparison between the control and implant groups in each region showed that for the acquisitions without MAR, only region 6 showed a significant difference. For the acquisitions with MAR (activated before or after acquisition), all regions in the implant group had lower SD values than those in the control group (P<0.05).
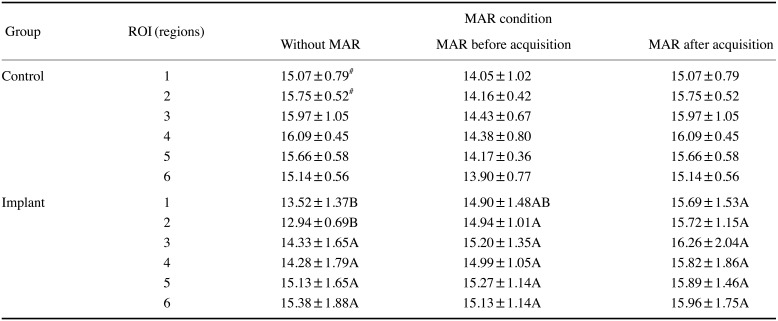
Regarding CNR values (Table 2), the control group showed no significant differences among regions 1 to 6 or among the 3 MAR conditions evaluated (P>0.05). In the implant group, there were no significant differences among the regions within each MAR condition. Region 1 presented a significantly lower CNR in the acquisitions without MAR than in those where MAR was activated after the acquisition (P<0.05), but no statistically significant differences were observed when MAR was activated before the acquisition (P>0.05). In region 2, the CNR was significantly lower (P<0.05) without MAR than in the acquisitions with MAR (before or after, with no significant difference between them, P>0.05). In the other regions (3 to 6), no significant differences were found between the acquisitions with or without MAR (P>0.05). The control and implant groups showed statistically significant differences in regions 1 and 2 for the acquisitions without MAR, with higher CNR values observed in the control group (P<0.05).
Discussion
The impact of artifacts in regions adjacent to dental implants on CBCT images is well established in the literature.610161718 Recently, it has been found that the production of these artifacts is not restricted only to circumstances when a high-atomic-number object is adjacent.14 However, alterations in the acquisition protocol, such as increased peak kilovoltage and the activation of the MAR algorithm can improve the image quality by reducing artifact generation.9 Although higher kVp values cause an increase in the radiation dose to which the patient is exposed,19 the same does not occur as a consequence of activating the MAR algorithm, since its application is unrelated to the acquisition parameters involving energy.11
The present study is pioneering, since 3 conditions of the MAR algorithm (no activation, activation before image acquisition, and activation after image acquisition) were tested in relation to artifact production in different regions of the scanned volume. This analysis is important because new CBCT units offer these MAR algorithm activation options and many patients undergoing a CBCT scan have implants or other high-density materials within the FOV. Previous studies have investigated the influence of artifact production on the outcomes of various diagnostic tasks in teeth that were located close to a generator-artifact object. 20,21 The results obtained showed discrepancies regarding the MAR algorithm. For the diagnosis of vertical root fractures, MAR activation was effective in improving the diagnosis, resulting in increased sensitivity values.20 However, MAR activation did not influence the diagnosis of external root resorption.21 Although those studies evaluated only 1 MAR activation mode, the discrepancies in their results reinforce the clinical relevance of studying alternatives to reduce the expression of artifacts of all magnitudes.
According to our findings, artifacts were more strongly expressed in the regions adjacent to the dental implant (regions 1–4), since higher SD values were found. In addition, regardless of whether it was activated before or after image acquisition, the MAR algorithm was effective in reducing artifact generation. To our best knowledge, only a single previous study has evaluated the effectiveness of the MAR algorithm in relation to the magnitude of artifacts generated by a zirconium implant in CBCT images.9 As in our results, activating the MAR algorithm led to a significant reduction in SD values, especially in regions where the artifacts were more pronounced. However, a distinctive feature of the present study is that it evaluated 2 different modes of MAR activation, whereas the previous study only evaluated the mode in which the MAR algorithm was activated before image acquisition.9
The literature contains limited studies on the performance of different activation modes of the MAR tool. A previous study evaluated the different modes of MAR activation in cortical plates close to a dental implant, and obtained results comparable to ours, with no significant differences in SD and CNR values between both modes.13 In the present study, a single ROI (5) for the implant group presented statistically significant different SD values between both MAR modes, but this can probably be explained as resulting from normal variations in voxel values between multiple acquisitions.22
Regarding the CNR results, the regions closer to the implant (1 and 2) showed stronger expression of artifacts (lower CNR values), and the MAR algorithm was effective. Conversely, no effect of MAR was observed in the other regions (3–6). We believe that this finding reflects the fact that artifacts were present to a lesser degree in the farther regions; consequently, the MAR algorithm would be expected not to have any effect, since it would not identify significant changes in gray values.910
Despite the limited information provided by the manufacturers of CBCT units regarding the operation of the MAR algorithm, it is believed that its activation results in the application of a threshold of gray values in the image, changing the extreme values that correspond to hypodense bands or hyperdense streaks of metal artifacts. However, little is known about what occurs when this algorithm is activated after image acquisition, as it is more commonly selected together with the acquisition parameters, prior to the acquisition. In this sense, an interesting result observed by the present study is that the values of the control group were identical without MAR and when MAR was activated after acquisition. This might imply that the software analyzes the images to assess whether there are artifacts and whether there is a need to apply any correction.
The CBCT unit tested in the present study was chosen because it allows the MAR algorithm to be activated before and after image acquisition. Since each CBCT unit has unique aspects in relation to the MAR algorithm, we encourage researchers to conduct future studies with other units that allow different modes of activation of the MAR algorithm. Thus, our results can serve as a reference for future studies conducted with different equipment and artifact-generating materials.
In conclusion, for the equipment tested, both modes of MAR activation were effective in decreasing CBCT artifacts of all magnitudes, especially when the effects of the artifacts were more noticeable. Therefore, the practitioner can choose when to activate the MAR algorithm according to his or her clinical preferences.
 XML Download