

 PDF
PDF ePub
ePub Citation
 Print
Print


INTRODUCTION
Prostate cancer, the most frequent solid malignancy among men, has become the third leading cause of cancer-associated deaths worldwide [12]. An accurate preoperative assessment of the tumor stage plays an crucial role for therapy planning, and radical prostatectomy is a extensively used potentially curative strategy [3]. While the detection of serum prostate specific antigen (PSA) levels has led to earlier diagnosis of prostate cancer [4], the conventional imaging modalities, including computed tomography (CT), magnetic resonance imaging (MRI), choline-based positron emission tomography (PET)/CT as well as 99mTc-methylene diphosphate bone scan, are more likely to be used for evaluating local tumor stage, seminal vesicle invasion, lymph node metastases (LNMs), and skeleton metastatic lesions. However, regardless of promising results that the conventional imaging techniques including MRI have performed, a wide range of reported sensitivities and specificities still exhibit their limitations in the current clinical scenarios [5].
Prostate-specific membrane antigen (PSMA), a transmembrane protein over-expressed in prostate cancer, has increasingly attracted the interest as a newly emerging approach for clinical imaging. Evidences have shown that the expression of PSMA in prostate cancer is 100- to 1,000-fold higher than that in normal tissues [67], and higher levels of PSMA expression have been demonstrated to be associated with increasing stage, Gleason grade and PSA level in prostate cancer [68]. To date, various PET ligands have been applied for the detection of prostate cancer [9], and despite the most common ligands 11 C- or 18 F-choline, a late-model probe named 68Gallium labelled prostate-PSMA ligands (68Ga-PSMA) recently has drawn a concentration of researchers [1011]. It has been well reported that 68Ga-PSMA-PET has superior sensitivity and specificity when comparing with choline-based PET [12]. Besides, a rising number of evidence has suggested that this targeted modality may provide more precise imaging for detecting prostate cancer [1314].
Perera et al [15] have previously performed a systematic review and meta-analysis to identify the sensitivity and specificity in advanced prostate cancer, indicating its high level of accuracy as a predictor. However, no relevant systematical review and meta-analysis over the comparison between 68Ga-PSMA-PET and the conventional imaging modalities has been yet published. The utility of 68Ga-PSMA PET imaging in intermediate- and high-risk prostate cancer outlined in studies were systematically reviewed. Hence, we decided to perform this meta-analysis. Because the data from multi-central randomized control trials was rare, we collected as many literatures as possible to systematically evaluate the diagnostic accuracy of Ga-PSMA PET imaging and conventional imaging modalities. The aim of our study was to complete a meta-analysis comparing the diagnostic performance of 68Ga-PSMA-PET and the conventional imaging modalities MRI in the detection of LNMs in intermediate- and high-risk preoperative prostate cancer patients.
Go to : 
MATERIALS AND METHODS
1. Data sources and search strategies
A systematic review and meta-analysis was conducted according to Preferred Reporting Items for Systematic Review and Meta-analysis (PRISMA) guidelines [16].
The scientific databases (PubMed, EMBASE, Web of Science, Cochrane Database, Chinese Biomedicine Literature Database) were searched by two authors independently to pick out eligible published articles (up to November 2018) using the combination of several keywords, including: (1) “prostate neoplasms” or “prostatic neoplasm” or “prostate cancer” or “cancer of the prostate” or “prostate malignancy”, (2) “prostate specific membrane antigen” or “PSMA”, (3) “positron emission tomography” or “PET”, (4) “magnetic resonance imaging” or “MRI”. Besides, additional studies were identified from the references of original articles and reviews related to this topic.
2. Study selection criteria
Following were the inclusion criteria: (1) patients should have undergone 68Ga-PSMA PET and/or MRI. (2) Patients should not receive radical prostatectomy or other non-surgical treatment before accepting the imaging modalities above. (3) Patients should have been biopsy-proven intermediate- or high-risk prostate cancer. (4) Histopathology (treated with pelvic lymph node dissection or extended pelvic lymph node dissection) as a golden standard for lymph node detection. (5) A minimum of 10 patients should be included in the study. (6) The numbers of true-positive (TP), false-positive (FP), true-negative (TN), and false-negative (FN) results can be calculated, (7) language of inclusion studies should be either English or Chinese.
Duplicated articles, case reports, review articles, editorials, clinical conference abstracts, cell and animal articles, meta-analysis were excluded to ensure the accuracy of the data.
3. Quality assessment
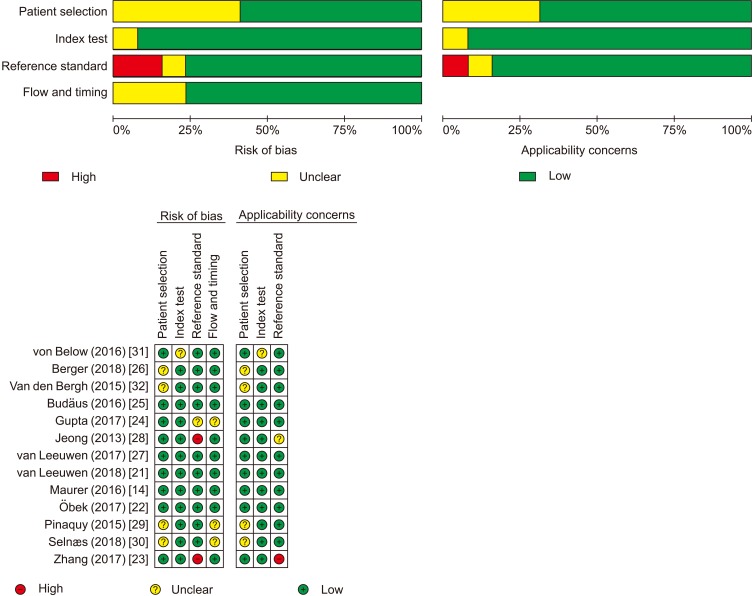
In order to evaluate the methodological quality of the eligible studies, the Quality Assessment Tool for Diagnostic Accuracy Studies version 2 (QUADAS-2) were used by two evaluators independently [17], and any discrepancies were discussed and resolved. The tool assesses the following four domains: patient selection, index test, reference standard, as well as the timing of reference test. The four domains above are all assessed in terms of risk of bias when we also assessed the degree of applicability of first three. Finally, we used Review Manager 5.3 software to evaluate the methodological quality and draw the figures.
4. Data extraction and statistical analysis
The extracted data from the enrolled studies should obtain following basal characteristics: author, year of publication, location, study design, the number of patients, age, pre-PET PSA level, Gleason scores, histopathologic data, rates of imaging modalities (68Ga-PSMA PET and MRI) positivity, the stage and size of tumor. If available, the numbers of TP, FP, FN, and TN from each paper would also be calculated. The numbers were used to measure sensitivity, specificity as well as a corresponding confidence interval (CI). If needed, we would contact the corresponding author for further details and the study would be excluded if there was no response.
To synthesize the data extracted, we used the bivariate mixed-effects regression model [18] in our meta-analysis. Based on the two-dimensional model, we obtained logit sensitivity and specificity with their 95% CIs. Then, pooled analysis of sensitivity, specificity and diagnostic odds ratios (DORs) for 68Ga-PSMA PET and MRI with corresponding 95% CIs was performed. Next, a summary receiver-operating characteristic (SROC) curve was back-transformed from the obtaining summary sensitivity, specificity and DORs. All the data was analyzed through MIDAS module for Stata software version 14.0.
5. Heterogeneity and publication bias
The chi-square test were used to analyze the heterogeneity between the eligible studies. I2 were measured as it lies between 0% and 100%. The respective value were approximately divided into 0%, 25%, 50%, 75%, which indicate no, low, moderate and high heterogeneity [19]. We would choose the random-effects models when I2 was superior to 50%; on the contrary, we preferred to choose the fixed-effects models when I2 was less than 50%. To validate if there existed a threshold which was thought as one of main source of heterogeneity, we performed Spearman correlation coefficients. If the p-value >0.05, there was no threshold.
To test the publication bias in each study, we used the Stata 14.0 software (STATA Corp., College Station, TX, USA) to analyze all included studies according to the Deek's test [20].
6. Ethics statement
All analyses were based on previous published studies, thus no ethical approval and patient consent are required.
Go to :
RESULTS
1. Study selection and the characteristics
We systematically retrieved through the scientific database (PubMed, EMBASE, Web of Science, Cochrane Database, Chinese Biomedicine Literature Database), which identified 3,044 citations. Additional 4 citations were from the references of the eligible articles. Then, 730 duplicated and 2,130 irrelevant studies were excluded by the abstracts screening. The remaining 188 studies were assessed in detail and 175 of them were excluded because (1) the study type was review, case report, comment or meta-analysis (n=70); (2) the language was not English or Chinese (n=1); (3) the raw data could not be extracted from the articles (n=30); (4) the golden standard was not histopathology (n=7); (5) the patients accepted surgery or hormone therapy (n=67). Finally, 13 eligible articles met the inclusion criteria. The flow diagram of the study selection process was shown in Fig. 1.

Thirteen eligible studies containing 1,597 patients who suffered biopsy-proven intermediate- or high-risk prostate cancer were included in our meta-analysis. All the patients were prior to surgery and non-treated with hormone therapy when undergoing the imaging examination method. The age of the patients was ranging from 42 to 84 years; the PSA level from 0.3 to 737 ng/mL; and the patient number ranged from 12 to 922. In total, seven of the eligible studies were retrospective, and the remaining five studies were prospective. Among these studies, 3 were from Australia, 2 were from Germany, and 1 of each was from China, Turkey, Korea, India, France, Sweden, Norway and Belgium. Other critical information is summarized in Table 1.
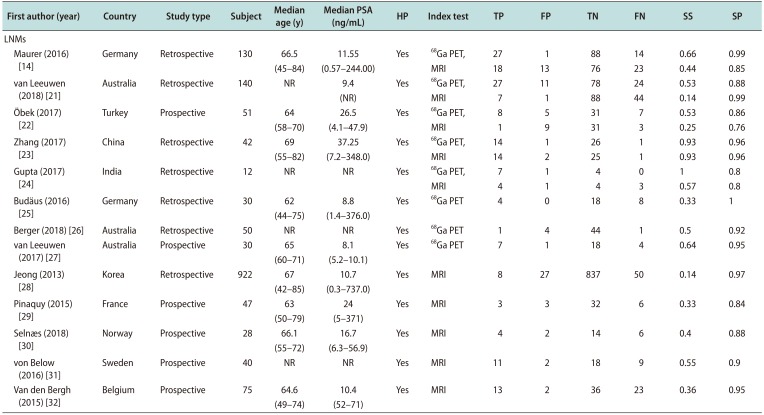
Table 1
Study characteristics
| First author (year) | Country | Study type | Subject | Median age (y) | Median PSA (ng/mL) | HP | Index test | TP | FP | TN |
|---|---|---|---|---|---|---|---|---|---|---|
| LNMs | ||||||||||
| Maurer (2016) [14] | Germany | Retrospective | 130 | 66.5 (45–84) | 11.55 (0.57–244.00) | Yes | 68Ga PET, MRI | 27 | 1 | 88 |
| 18 | 13 | 76 | ||||||||
| van Leeuwen (2018) [21] | Australia | Retrospective | 140 | NR | 9.4 (NR) | Yes | 68Ga PET, MRI | 27 | 11 | 78 |
| 7 | 1 | 88 | ||||||||
| Öbek (2017)[22] | Turkey | Prospective | 51 | 64 (58–70) | 26.5 (4.1–47.9) | Yes | 68Ga PET, MRI | 8 | 5 | 31 |
| 1 | 9 | 31 | ||||||||
| Zhang (2017) [23] | China | Retrospective | 42 | 69 (55–82) | 37.25 (7.2–348.0) | Yes | 68Ga PET, MRI | 14 | 1 | 26 |
| 14 | 2 | 25 | ||||||||
| Gupta (2017) [24] | India | Retrospective | 12 | NR | NR | Yes | 68Ga PET, MRI | 7 | 1 | 4 |
| 4 | 1 | 4 | ||||||||
| Budäus (2016) [25] | Germany | Retrospective | 30 | 62 (44–75) | 8.8 (1.4–376.0) | Yes | 68Ga PET | 4 | 0 | 18 |
| Berger (2018) [26] | Australia | Retrospective | 50 | NR | NR | Yes | 68Ga PET | 1 | 4 | 44 |
| van Leeuwen (2017) [27] | Australia | Prospective | 30 | 65 (60–71) | 8.1 (5.2–10.1) | Yes | 68Ga PET | 7 | 1 | 18 |
| Jeong (2013) [28] | Korea | Retrospective | 922 | 67 (42–85) | 10.7 (0.3–737.0) | Yes | MRI | 8 | 27 | 837 |
| Pinaquy (2015) [29] | France | Prospective | 47 | 63 (50–79) | 24 (5–371) | Yes | MRI | 3 | 3 | 32 |
| Selnæs (2018) [30] | Norway | Prospective | 28 | 66.1 (55–72) | 16.7 (6.3–56.9) | Yes | MRI | 4 | 2 | 14 |
| von Below (2016) [31] | Sweden | Prospective | 40 | NR | NR | Yes | MRI | 11 | 2 | 18 |
| Van den Bergh (2015) [32] | Belgium | Prospective | 75 | 64.6 (49–74) | 10.4 (52–71) | Yes | MRI | 13 | 2 | 36 |
Values are presented as number only, median (range), or percent only.
PSA: prostate specific antigen, HP: histopathology, TP: true positive, FP: false positive, TN: true negative, FN: false negative, SS: sensitivity, SP: specificity, LNMs: lymph node metastases, NR: not reported, 68Ga PET: 68Gallium positron emission tomography, MRI: magnetic resonance imaging.
![]()
2. Methodological quality assessment
Referring to the QUADAS-2 quality assessment tool, seven studies enrolled consecutive patients. The index test was prior to surgery, while postoperative pathology was the only golden standard in all eligible articles, which indicated the reference standard barely influenced the result of the index test. According to the result of assessment, the overall quality of included research was credible. The summary of risk of bias and quality assessment is shown in Fig. 2.
3. Findings
In 68Ga-PSMA PET/CT group, we included eight studies [1421222324252627] which represented 485 patients to identify its efficiency. The forest plot exhibited the results that the sensitivity for 68Ga-PSMA PET/CT ranged from 0.33 to 1.00, as the specificity ranged from 0.69 to 1.00 (Fig. 3A). The summary pooled parameters in 68Ga-PSMA PET/CT group were as follows: sensitivity: 0.65 (95% CI: 0.49–0.79); specificity: 0.94 (95% CI: 0.88–0.97); positive likelihood ratio (LR+): 10.6 (95% CI: 5.1–21.9); negative likelihood ratio (LR−): 0.37 (95% CI: 0.24–0.58); DOR: 29 (95% CI: 10–80).

Meanwhile, in MRI group, ten articles [14212223242829303132] represented 1,487 patients were evaluated. The corresponding values in the forest plot ranged from 0.14 to 0.93 and 0.57 to 0.96 (Fig. 3B). The summary pooled parameters in MRI group were as follows: sensitivity: 0.41 (95% CI: 0.26–0.57); specificity: 0.92 (95% CI: 0.86–0.95); LR+: 4.9 (95% CI: 3.1–7.6); LR−: 0.65 (95% CI: 0.51–0.83); DOR: 8 (95% CI: 4–13).
Comparing the pooled data between 68Ga-PSMA PET/CT and MRI, the overall sensitivity was 0.65 (95% CI: 0.49–0.79) versus 0.41 (95% CI: 0.26–0.57); the overall specificity was 0.94 (95% CI: 0.88–0.97) versus 0.92 (95% CI: 0.86–0.95), respectively; the overall LR+ was 10.6 (95% CI: 5.1–21.9) versus 4.9 (95% CI: 3.1–7.6); the overall LR- was 0.37 (95% CI: 0.24–0.58) versus 0.65 (95% CI: 0.51–0.83); and the DOR was 29 (95% CI: 10–80) versus 8 (95% CI: 4–13). 68Ga-PSMA PET/CT had a higher pooled sensitivity (0.65 versus 0.41) and a close pooled specificity (0.94 versus 0.92) when comparing with MRI. The results above were shown in Fig. 3 and Table 2.
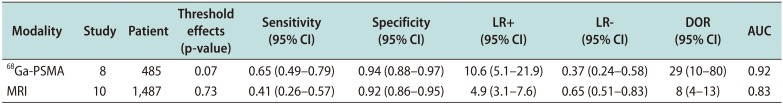
Table 2
Summary of the parameters in 68Ga-PSMA PET/CT and MRI groups
Values are presented as number only, median (range), or index only.
68Ga-PSMA PET/CT: 68Gallium-prostate-specific membrane antigen positron emission tomography/computed tomography, MRI: magnetic resonance imaging, CI: confidence interval, LR+: positive likelihood ratio, LR-: negative likelihood ratio, DOR: diagnostic odds ratio, AUC: area under the curve.
![]()
Moreover, we performed the SROC curve of 68Ga-PSMA PET/CT and MRI (Fig. 4). The area under the curve (AUC) of 68Ga-PSMA PET/CT was larger than that of MRI (0.92 versus 0.83), which suggested 68Ga-PSMA PET/CT a more efficient imaging modality when comparing with MRI.

4. Heterogeneity test
According to the result of the forest plot, the heterogeneity of 68Ga-PSMA PET/CT and MRI was high in both sensitivity (I2=61.08% and 82.84%, respectively) and specificity (I2=58.15% and 86.02%, respectively). For MRI group, meta-regression was used to find out the source of heterogeneity. Subsequently, we found the heterogeneity of specificity might come from the electric field strength (1.5 T or 3.0 T), and the results of meta-regression showed the p-value of specificity in electric field strength was 0.03. However, there was no significant differences between the 1.5 T group and 3.0 T group when we performed a sub-group analysis. Therefore, our results of MRI were reliable. As for 68Ga-PSMA PET/CT, lacking enough included studies (n=8) for meta-regression, we decided to choose a random effects model to pool the data of 68Ga-PSMA PET/CT.
Stata 14.0 software was used to analyze the diagnostic threshold, indicating that the Spearman correlation coefficient was 0.26 and the p-value was 0.07 for 68Ga-PSMA PET/CT. Meanwhile, the corresponding index for MRI was -0.85 and 0.73. No evidence revealed a significant threshold effect existing in our meta-analysis.
5. Publication bias
The results of Deek's funnel plot test revealed that the p-values for 68Ga-PSMA PET/CT and MRI were 0.98 and 0.78, which indicated that there existed no severe publication bias. The results of Deek's funnel plot was shown in Fig. 5.

Go to :
DISCUSSION
Appropriate preoperative evaluation for the LNMs is critical for planning the most efficient prostate-cancer therapy strategy [33]. In the recent clinical scenarios, MRI has been widely applied to predict the primary staging of the patients with prostate cancer. As a standard modality, MRI is indispensable in current practice guidelines, but it still has many deficiencies. In general, MRI excessively relies on pathological changes such as morphological information and the sizes of lymph nodes. By defining pelvic lymph nodes lager than 8 to 10 mm as suspicious lesions [3435], the fact that approximately 80% of them in prostate cancer are smaller than 8 mm [36] results in the low sensitivity of LNMs detection for MRI. Hence, there is an urgent need for a more accurate implement.
As a novel targeted imaging modality, 68Ga-PSMA PET/CT has been well used in numerous published studies. However, in most of outlined data, the utility of 68Ga-PSMA PET just served as a predictor for the secondary staging with biochemical recurrence (BCR). The published studies setting of primary staging without therapy are still limited. Budäus et al [25] previously reported the initial experience on 68Ga-PSMA PET/CT predicting the LNMs in the patients with prostate cancer who were prior to radical surgery. The authors retrospectively analyzed 30 patients and concluded the sensitivity and specificity of 0.33 and 1.00. Later on, in 2017, Gupta et al [24] published a research, indicating the sensitivity and specificity for detection of metastatic lymph nodes were 66.7% and 98.9%. In the same year, Zhang et al [23], a research team from China, delivered the results that the corresponding values changed into 93.3% and 96.6%. However, there are few multicentre prospective randomized studies. A clinical trial protocol for the comparation between 68Ga-PSMA PET and the conventional imaging modalities, which was published by Hofman et al [37], may help promote more research and offer beneficial evidence. According to the varied results, we performed this meta-analysis to identify the true efficiency of 68Ga-PSMA PET/CT.
In our meta-analysis which included 13 studies comprising 1,597 patients, we compared the sensitivity and specificity of 68Ga-PSMA PET/CT and MRI. Previous studies reported the varied sensitivity and specificity of 68Ga-PSMA PET/CT and MRI. For 68Ga-PSMA PET/CT, sensitivity and specificity ranged from 0.33 to 1.00 and 0.82 to 1.00, respectively. The corresponding values of MRI ranged from 0.14 to 0.93 and 0.76 to 0.99, respectively. The pooled results of the eligible studies highlighted that 68Ga-PSMA PET/CT has a higher sensitivity than that of MRI (0.65 versus 0.39), and a comparable specificity (0.94 versus 0.92). When comparing the SROC curve, the results of AUC indicated that 68Ga-PSMA PET/CT was a more effective predictor for LNMs detection in intermediate- and high-risk prostate cancer.
Our results of 68Ga-PSMA PET/CT are different from those of a previously published meta-analysis performed by Perera et al [15]. In this article, they enrolled 16 articles with 1,309 patients, obtaining a pooled sensitivity and specificity of 0.86 and 0.86 for 68Ga-PSMA PET/CT, respectively. Moreover, they constructed the SROC curve, indicating 68Ga-PSMA PET/CT a valuable diagnostic method.
Despite the similar result of AUC, we are not surprised by the difference between the two meta-analysis, because the different inclusion criteria resulted in the different pooled data. Specifically, in the patient selection, we only enrolled the preoperative patients without hormone therapy, however, Perera et al [15] included a result of mixed staging patients including primary staging and secondary staging patients with BCR. With regard to the patients with BCR, several previous articles revealed a high sensitivity of LNMs detection, ranging from 77.9% to 98.8% [383940]. The results above prompted us that 68Ga-PSMA PET/CT probably had a superior detection rate in the patients with BCR. Therefore, there is no doubt that the pooled sensitivity of Perera's study [15] is higher than that of our meta-analysis. In addition, referring to the results mentioned above, we conferred that hormone therapy and surgery might influence the exploration ability of 68Ga-PSMA. Hence, we excluded the patients who accepted hormone therapy or radical prostatectomy to dispel the confounding factors which might lead to a potentially rising bias.
As for MRI, dating back to 2008, Hövels et al [34] had already reported a meta-analysis which included 10 studies comprising 628 patients, with a result that the pooled sensitivity and specificity of LNMs detection in prostate cancer were 0.39 (95% CI: 0.19–0.56) and 0.82 (95% CI: 0.73–0.83), respectively. The outlined results above are similar to those in our study, suggesting MRI possess bounded ability in LNMs detection in prostate cancer. Also, MRI has its own advantages when comparing with 68Ga-PSMA PET/CT. On the one hand, the anatomic discriminative resolution of MRI is higher than that of 68Ga-PSMA PET/CT. On the other hand, the price of the two imaging techniques are not comparable. A modest price of MRI makes it a more acceptable diagnostic method for Chinese patients.
In addition, according to the result of I2 value, the heterogeneity of 68Ga-PSMA PET/CT and MRI is high in our study. Therefore, we performed meta-regression and sub-group analysis for MRI, dividing it into 1.5 T MRI and 3.0 T MRI groups, finding no significant differences between the patients receiving 3.0 T MRI and 1.5 T MRI, which demonstrated our results reliable for MRI. As for 68Ga-PSMA PET/CT group, as a result of limited statistical method to explore heterogeneity, we finally choose a random-effect model. Besides, the differences between included studies in both 68Ga-PSMA PET/CT and MRI thresholds for positivity may become the potential source of heterogeneity.
There are a few limitations in our study.
First, without a sufficient evidence from prospective studies, a majority of the included studies for the meta-analysis were providing a small, retrospective data. As what was mentioned above, the multicentre prospective randomized studies will help accelerate the research. Meanwhile, there was still limited data for more subgroup analysis of different characteristics, such as race (black, white and yellow race) or PSA level. Undoubtedly, additional data will be of benefit for consummating the sub-group analysis.
Second, some criteria or definition in our included literature may not conform the same standard, such as imaging protocol or the definition of sensitivity.
Third, we only enrolled published English articles, leaving out non-English or unpublished studies, which might give rise to selection bias.
Go to :
CONCLUSIONS
Our meta-analysis suggested that, when comparing with MRI, 68Ga-PSMA PET had a higher sensitivity and a comparable specificity for staging the preoperative LNMs in the intermediate- and high-risk prostate cancer. The area under the SROC curve indicated that 68Ga-PSMA PET was potentially a more effective and appropriate imaging modality to predict the LNMs prior to a surgery strategy.
Go to :
 XML Download