Journal List > Nutr Res Pract > v.14(2) > 1144021

Han, Moon, Oh, Chang, and Ham: Impacts of menu information quality and nutrition information quality on technology acceptance characteristics and behaviors toward fast food restaurants' kiosk

Abstract

BACKGROUND/OBJECTIVES

With the advances in technologies, self-service kiosks at foodservice operations are becoming a new way of service provision. This study examined the relationships among the menu information quality, nutrition information quality, technology acceptance characteristics, and customer behavioral intention toward the kiosks in fast food restaurants.

SUBJECTS/METHODS

A survey with a self-administered method was distributed online and offline. The sample consisted of customers who had used the kiosks at fast food restaurants in the last six months prior to the survey. The study hypotheses were tested by applying structural equation modeling.

RESULTS

Structural equation modeling revealed the positive impacts of menu information quality and nutrition information quality, technology acceptance characteristics, and behavioral intention toward kiosks at fast food restaurants. On the other hand, one hypothesis (Hypothesis 4) on the impact of nutrition information quality on the perceived usefulness was rejected.

CONCLUSION

The study is the first to investigate nutrition and menu information at foodservice kiosks and relate them to technology acceptance. The study is very timely and adequate in the time of the 4th industrial revolution. The critical importance of the presentation of nutrition information and menu information at the kiosks at fast food restaurants was verified. The academic and industrial implications of the study findings were discussed.

INTRODUCTION

With the recent developments in the information technology (IT) industry, the increase in the introduction of self-service technologies (SSTs) has been noted in many industries. SSTs have partly replaced the role of employees in the service industry [1]. The foodservice industry has also begun to provide convenience to customers by introducing self-service technologies [234]. Although self-service kiosks save labor costs, they are spreading from fast-food restaurants and large-scale franchises, such as coffee shops, and hamburger restaurants to small restaurants, including Udon restaurants and rice noodle restaurants [5].
The kiosk ordering-payment system in fast-food restaurants, as a self-service technology, is being introduced fastest to the foodservice industry [6]. Lotteria and McDonald's, which are major hamburger franchise brands in Korea, are representative examples actively introducing kiosks. As of 2017, 560 Lotteria stores and 190 McDonald's stores have adopted kiosks. The self-service kiosk market is growing in Korea and overseas. By 2020, self-service kiosks will be implemented at all U.S. McDonald's locations [7].
The self-service kiosks provide convenience by reducing the customer's waiting time. In addition, it changes the way customers interact with employees from face-to-face contact to non-personal contact. The self-service kiosks in the foodservice industry are beneficial to both the operators and customers. Self-service kiosks benefit the operators by reducing the ordering time and increasing sales by lowering the labor and operating costs [8]. That is, a self-service kiosk at foodservice operations improves the service speed and quality by reducing the labor costs for service personnel [38]. From the moment of considering the menu to the point of payment, the customers have no contact with the ordering personnel, which provides convenience in ordering and payment [9]. The system also reduces the uncertainty in menu selection in the course of the decision-making processes and improves the level of satisfaction by providing new experiences to the customers [1011]. The use of SSTs offers customers advantages by providing self-control, independence, and autonomy [12]. On the other hand, there are some disadvantages, such as the difficulty of technology use, and time elapse from a failure of using the system, which can result in discomfort and stress [1314].
The kiosks in fast-food restaurants provide menu information, such as the menu name, menu picture, price, and nutrition information (calorie, sugar, sodium content, etc.) for each menu item, which assists in the customers' menu choice. The presentation of such menu and nutrition information on kiosks provides customers with greater visibility while serving as a potential factor in improving the level of customer satisfaction [1516].
Nutrition information provides customers with the right to know about the nutrient contents, which aims to help them select healthy menus [17] based on accurate information and objective knowledge [1819]. Accordingly, the use of nutrition information allows consumers to control their nutrient intake, which has a positive effect on public health [20]. The implementation of nutritional information has been studied widely in many types of restaurants [2122232425262728].
As a measure to combat public obesity, the US Congress proposed Section 4205 of the Patient Protection and Affordable Care Act, “Nutrition labeling of standard menu items at chain restaurants,” in 2010. The section mandates the presentation of nutritional information of standard menu items at chain restaurants with more than 20 outlets throughout the country [29]. The section has been debated for many years in Congress because of the heavy discussions on these issues among industry, consumers, and regulators. Finally, it became effective in 2019 [30]. Such menu labeling laws are also effective in other countries, including Canada (Guidance Document Repository), England (Food Labeling and Safety), Australia (Food Standard Code), Argentina (Chapter 5: Argentina Food Code), and Korea (Special Act on Children's Food Safety and Nutrition) [3132333435].
In Korea, in 2009, under the Special Act on Children's Food Safety and Nutrition Management of Children's Eating, which is one of the comprehensive measures for children's food safety, the labeling of nutrition information became mandatory for fast-food restaurants and other restaurants that sell popular items to children, including hamburger, pizza, confectionary, and ice cream chains [3435]. The law was implemented to reduce the risk of obesity due to the increased frequency of eating out and help the consumer select healthy menus. The law has been expanded not only from mandatory requirements to voluntary participation to foster a healthy eating environment [36]. Some restaurants are voluntarily participating in the menu labeling, such as family restaurants, coffee shops, amusement parks, movie theaters, department food courts, and airport restaurants [34].
The kiosks at fast food restaurants provide information to customers, such as nutrition information and menu information. Providing information through self-service technology kiosks can work effectively in menu selection by increasing the comprehension of menu information and nutrition information [37].
The technology acceptance model (TAM) is the principal theory to explain the causal relationship of users in accepting new technologies and has been verified empirically by several studies [38394041]. Davis [41] suggested the perceived ease of use and perceived usefulness as the characteristics of technology acceptance. These two variables offered the basis of predicting and explaining the users' perception, attitudes, and behaviors toward new technologies. The positive impacts of the perceived ease of use on the perceived usefulness have been reported. The construct of fun was added later to the characteristics of technology acceptance as an importance feature for the use of technology-based services [414243]. Unlike the perceived ease of use and perceived usefulness, which was found to have a direct influence on user acceptance, fun stimulates the inner nature of the user [44].
The adoption of kiosks at fast food restaurants has attracted researchers' attention. Shim and Han [42] reported a significant relationship among the motive, attitudes, and intention of using kiosks when ordering at fast-food restaurants. Oh's study [45] focused on the tourists' adoption of SSTs at resort hotels and found that the perceived usefulness positively affected the use intention of SST. Other studies also provided evidence of a significant positive effect of the perceived usefulness and ease of use on the behavioral intention to continue using something [4647].
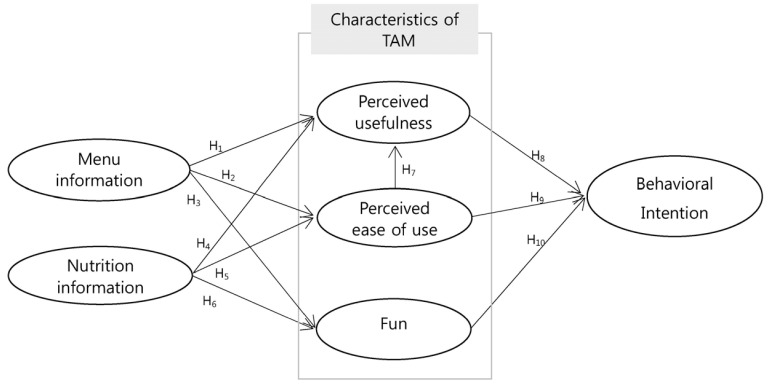
Although studies on the customer behaviors towards fast-food kiosks have been conducted, there has been little research on the nutrition information and menu information provided by kiosks at restaurants, as well as their effects on customers. Therefore, this study examined the relationships among the menu information quality, nutrition information quality, characteristics of technology acceptance, and customer behavioral intention toward fast food kiosks. The kiosks in fast food restaurants were chosen for the study, because fast food restaurants adopted the kiosks first and contain the largest number of kiosks in the restaurant industry. The following hypotheses were proposed based on the literature mentioned above.
  • H1: Menu information quality has a positive impact on the Perceived usefulness.

  • H2: Menu information quality has a positive impact on the Perceived ease-of-use.

  • H3: Menu information quality has a positive impact on Fun.

  • H4: Nutrition information quality has a positive impact on the Perceived usefulness.

  • H5: Nutrition information quality has a positive impact on the Perceived ease-of-use.

  • H6: Nutrition information quality has a positive impact on Fun.

  • H7: Perceived ease of use has a positive impact on the Perceived usefulness.

  • H8: Perceived usefulness has a positive impact on the Behavioral intention.

  • H9: Perceived ease of use has a positive impact on the Behavioral intention.

  • H10: Fun has a positive impact on the Behavioral intention.

Fig. 1 presents an outline of the framework of the study which depicts the relationships of the study variables.

SUBJECTS AND METHODS

Data collection

The study sample consisted of the adult customers who had experienced fast food-ordering kiosks within six months before the survey. One question for eligibility was provided: if they had experienced fast food ordering kiosks within the last six months. If not, they were asked to stop participating in the survey. Data were collected from Nov. 8 to Nov. 22, 2018. After distributing 255 surveys, 250 complete surveys were used for empirical analysis. The finalized survey was verified and approved by Yonsei University, Seoul, Korea, through the Institutional Review Board (IRB) (20101-HR-1356-04).

Research instrument

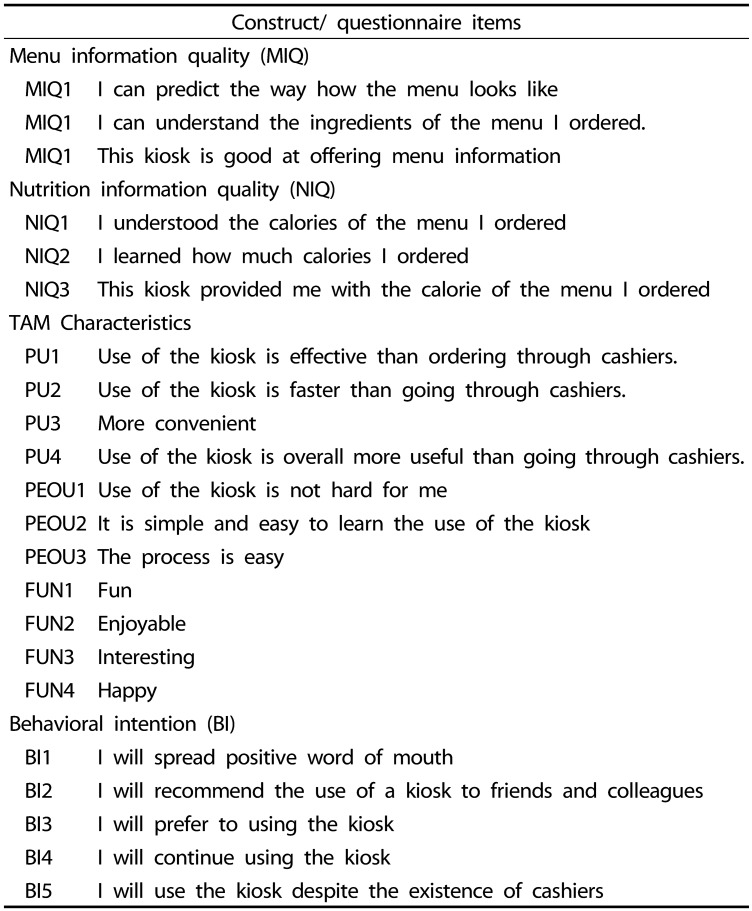
The survey items for this study were derived from previous studies and modified to fit the study context. The questionnaire items were comprised of four parts. Part 1 asked the respondents questions regarding menu information quality and nutrition information quality. The menu information quality items were derived from a previous study [10], which is defined as the customers' perception of the quality of menu information provided through kiosk services, and contained three items. Nutrition information quality, which is defined as the customers' perception of the quality of nutritional information displayed on the kiosk services [10], contained three items. The constructs of the menu information quality and nutrition information quality were measured using a five-point Likert-type scale (one = strongly disagree, five = strongly agree).
Part 2 of the survey was comprised of the technology acceptance characteristics, such as perceived usefulness, perceived ease of use, and fun. The construct of perceived usefulness was defined as the extent to which the use of a kiosk is beneficial to the user [48] and contained four items [48]. The perceived ease of use measured how easy the user learns and uses the kiosk and included three items [48]. The construct of fun was defined as the degree to which the user experiences enjoyment when using the kiosk services, and included four items [43]. The technology acceptance characteristics items were measured using a five-point Likert-type scale (one = strongly disagree, five = strongly agree).
In Part 3, the construct of the behavioral intention was assessed using five items asking the user's willingness to continue using the kiosk services in the future, and was measured on a five-point Likert-type scale (one = strongly disagree, five = strongly agree) [49]. Part 4 collected the respondents' demographics, including gender, age, education, and monthly family income. Table 1 lists the items for the constructs of the survey.

Statistical analysis

The data were analyzed statistically using SPSS 24.0 for Windows and AMOS 22.0. Descriptive statistical analysis was performed on all the variables. Structural equation modeling (SEM) was conducted to test the conceptual framework of the study. Following the suggestion of the two-step approach [505152], confirmatory factor analysis was first performed to test the reliability and validity of the measures. The structural equation model was then used to verify the study hypotheses.

RESULTS

Demographics of the respondents

Of the respondents, 69.2% (n = 173) were female and 30.8% (n = 77) were male. The age distribution was as follows: 20s (54.8%, n = 137), 30s (34.4%, n = 86), and 40s or over (10.8%, n = 27). The education attained was college degree (67.6%, n = 169), high school graduate (9.2%, n = 23), and graduate school degree (10.4%, n = 26). The distribution of family monthly income after tax was as follows: < 2,000,000 won (12.0%, n = 30), 2,000,000–2,999,999 won (21.2%, n = 53), 3,000,000–3,999,999 won (20.8%, n = 52), 4,000,000–4,999,999 won (14.4%, n = 36), and > 5,000,000 won (31.6%, n = 79) (1,150 Korean won is equivalent to US 1 dollar).

Results of the measurement model

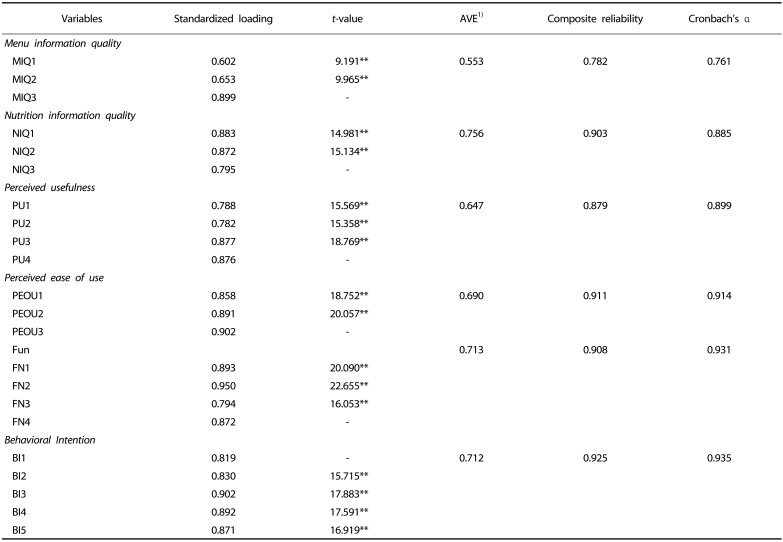
Table 2 lists the results of CFA. The fit of the measurement model was examined using several fit indices. The results were as follows: χ(194)2 = 433.377, χ2/df = 2.234, NFI = 0.908, IFI = 0.947, TLI = 0.937, CFI = 0.947, and RMSEA = 0.070. The Cronbach's alpha value ranged from 0.761 to 0.935, exceeding the 0.7 recommended value, confirming the construct reliability [49]. All the standardized factor loadings for the study constructs, from 0.602 to 0.950, were significant at the 0.01 level [49]. The average variance extracted (AVE) estimates of the four study constructs ranged from 0.553 to 0.756, which indicated higher than the minimum threshold of 0.5 [5152]. The composite reliability (CR) (ranging from 0.782 to 0.925) exceeded the threshold of the acceptance level, 0.7 [5152].
Table 3 lists the correlations, squared correlations, and AVE of all the study constructs. To check the discriminant validity, the AVE of the study construct in the research model was compared with its squared correlation coefficient [5152]. All the diagonal values of the AVE exceeded the squared correlation coefficient between all pairs of constructs, which confirmed the adequacy of the discriminant validity.

Testing the hypotheses using structural equation modeling

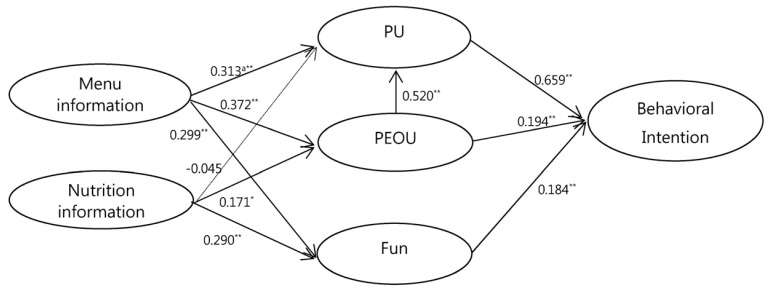
SEM was applied to investigate the relationships among menu information quality, nutrition information quality, perceived usefulness, perceived ease of use, fun, and behavioral intentions toward kiosk-based self-service at fast food restaurants (Fig. 2). The fit indices showed that the fits of the measurement model indicated the covariance matrix drawn from the data at a satisfactory level, which is based on a Chi-squared (χ2) value of 449.279, df = 198, χ2/df = 2.269, NFI = 0.902, IFI = 0.943, TLI = 0.933, CFI = 0.942, and RMSEA = 0.071.
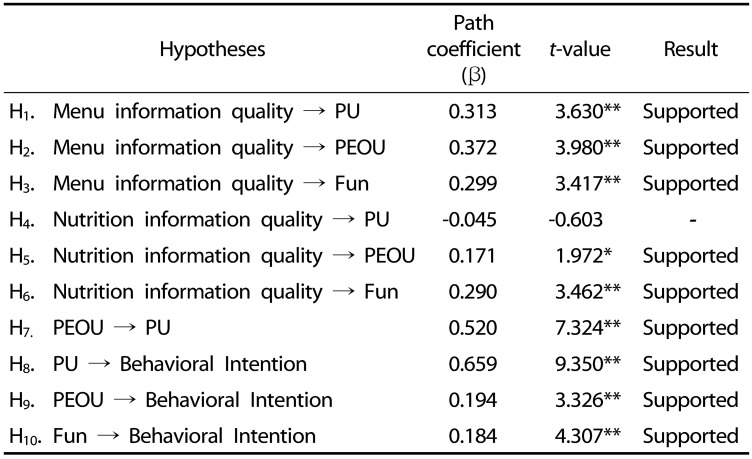
Table 4 shows that the paths for all the hypotheses were significant, except for one. Hypotheses 1, 2, and 3, which predicted that the menu information quality would have a positive influence on the perceived usefulness, perceived ease of use, and fun, were supported by a standardized coefficient of 0.313, 0.372, and 0.299 (P < 0.01). Hypotheses 5 and 6 predicted that nutrition information quality would have a positive influence on the perceived ease of use (β = 0.171, P < 0.05) and fun (β = 0.290, P < 0.01). On the other hand, Hypothesis 4 was not supported empirically. Hypothesis 7, a prediction of a positive impact of the perceived usefulness on perceived ease of use, was also supported (β = 0.520, P < 0.01). Finally, the behavioral intention toward kiosk-based self-service was positively affected by the three characteristics of TAM, such as the perceived usefulness (β = 0.659, P < 0.01), perceived ease of use (β= 0.194, P < 0.01), and fun (β= 0.184, P < 0.01), supporting H8, H9, and H10.

DISCUSSION

With the advances of technologies, self-service kiosks have been introduced to improve the service environment. The SSTs contribute to the service industry by improving the service quality that customers receive and reducing the labor costs to the operators. In particular, the kiosks adopted by the restaurant industry critically elevate the costs and service quality. Despite the dramatic increase in the number of kiosks at restaurants, there has been little research on the use of kiosks, particularly focusing on the information provided by the kiosks. The nutrition information has become a concern for customers, reflecting the heightened interest in health. Herein, the study examined the customers' use of information offered by the kiosks and related to the characteristics of technology acceptance at fast food restaurants.
The major findings of the study were as follows:
  • 1. The menu information quality at fast food kiosks had a positive impact on the users' perceived usefulness (β = 0.313, t = 3.630**), perceived ease of use (β = 0.372, t = 3.980**), and fun (β = 0.299, t = 3.417**).

  • 2. The nutrition information quality at fast food kiosks had a significant positive impact on the users' perceived ease of use (β = 0.171, t = 1.972*) and fun (β = 0.290, t = 3.462**), but it did not have an impact on the perceived usefulness.

  • 3. The perceived ease of use (β = 0.520, t = 7.324**) at kiosks of the fast food restaurants had a positive impact on the perceived usefulness.

  • 4. The perceived usefulness (β = 0.659, t = 9.350**), perceived ease of use (β = 0.194, t = 3.326**), and fun (β = 0.184, t = 4.307**) positively influenced the customer behavioral intention.

These findings also proved the relationships of technology acceptance characteristics and customer use, as reported previously [42454647]. On the other hand, this is significant because it applied the technology acceptance characteristics to fast food restaurants. In particular, this study is unique in examining the effects of the delivery of nutrition information and menu information by kiosks in restaurants. While such information is critical for customers in selecting menus, there has been no study contemplating such information at kiosk studies.
The study also has implications for academia and industry. The scholastic implications to academia are as follows. This study is valuable in that it applied nutrition information and menu information to a technology acceptance model. Therefore, this study verified the relationships of restaurant-kiosk information quality, characteristics of technology acceptance, and customer behaviors. Previous studies examined the customer technology acceptance and behaviors only according to the restaurant classification.
The practical implications for industry are important and clear. This study showed the positive relations of the kiosk-information quality, technology acceptance characteristics, and customer behavioral intention. The nutrition information and menu information offered at the kiosks should be what the customers want and are easy to comprehend. The hypothesis on the impact of the nutritional information quality on the perceived usefulness was not supported. A possible explanation is that the kiosks do not offer the nutritional information customers would like to see. Currently, while the kiosks offer only caloric information, it could provide more information on the nutrients of the menus, which may help customers select healthy foods.
Currently, the menu information includes the menu photos and price, while nutrition information offers calories only. Customers may want to see more nutritional information, such as fat, sugar, or salts. The industry should consider what customers would like to see from the kiosks. The information offered at these kiosks should also be accurate.
Currently, such nutrition information and menu information provided at fast food restaurant kiosks may not be available at other types of restaurants, such as casual-dining and full-service restaurants. Such information can be expanded to different segments of restaurants reflecting the customers' increased interest in health and improved education toward technology.
While this study is the first to investigate the delivery of nutrition and menu information at foodservice kiosks and relate them to technology acceptance, it still had some limitations. As the kiosks are spreading through the various segments of the restaurant industry, the research on kiosks and information can be applied to segments other than fast food operations. As the information on the kiosks at the restaurants affects customer menu selection, it may influence healthy menu choices. Therefore, future studies should be directed at examining further the details of the nutrition information on the kiosks at restaurants. While the use of kiosks and the provision of menu labeling have been expanded to various types of restaurants, similar studies should be conducted on other types of restaurants, such as casual dining, coffee shops, and cafeterias.

Notes

This work was supported by the National Research Foundation of Korea [grant number NRF-2014S1A2A2028667].

CONFLICT OF INTEREST: The authors declare no potential conflicts of interests.

References

1. Choi HS, Jo JE, Ham SP. Self-Service check-in kiosk use behaviour: an application of technology acceptance model. J Tourism Leis Res. 2009; 21:295–315.
2. Tice C. How restaurants are using technology to deliver better customer service [Internet]. Jersey City (NJ): Forbes;2012. cited 2018 October 12. Available from: http://www.forbes.com/sites/caroltice/2012/12/07/how-restaurants-are-using-technology-to-deliver-better-customer-service/#154baelf6b76.
3. Dixon M, Kimes SE, Verma R. Customer preferences for restaurant technology innovations. Cornell Hosp Rep. 2009; 9:6–16.
4. Lee IS, Na YA, Yoon HH. The effects of foodservice consumer's perceived technology-based self-service characteristics on satisfaction and purchase intention: with a focus on an online menu ordering system. Korea J Tourism Hosp Res. 2013; 27:85–100.
5. Jeong SW. The effect of perceived reliability of self-service kiosk on the intention to use [master's thesis]. Seoul: Konkuk University;2018.
6. Song MH. A proposal of multimedia menu system for drive-thru. J Basic Des Art. 2002; 3:87–97.
7. Hafner J, Limbachia D. McDonald's: You buy more from touch-screen kiosks than a person. So expect more kiosks [Internet]. Tysons Corner (VA): USA today;2018. cited 2019 November 11. Available from: https://www.usatoday.com/story/money/nation-now/2018/06/07/mcdonalds-add-kiosks-citing-better-sales-over-face-face-orders/681196002/.
8. Kim YK. Kiosk to accelerate unattended trend [Internet]. Daejeon: ITTP;2017. cited 2018 November 18. Available from: http://www.itfind.or.kr/admin/getFile.htm?identifier=02-001-170404-000003.
9. Kimes SE, Collier JE. How customers view self-service technologies [Internet]. Cambridge (MA): MIT Sloan;2015. cited 2018 October 20. Available from: http://sloanreview.mit.edu/article/how-customers-view-self-service-technologies/.
10. Beldona S, Buchanan N, Miller B. Exploring the promise of e-tablet restaurant menus. Int J Contemp Hosp Manag. 2014; 26:367–382.
crossref
11. Davidge D. 4 reasons why self-service enhances customer experience [Internet]. Seattle (WA): AnswerDash;2016. cited 2018 October 12. Available from: http://www.answerdash.com/blog/4-reasons-why-self-service-enhances-the-way-customers-engage-with-your-services.
12. Dabholkar PA, Bagozzi RP. An attitudinal model of technology-based self-service: moderating effects of consumer traits and situational factors. J Acad Mark Sci. 2002; 30:184–201.
crossref
13. Hilton T, Hughes T, Little E, Marandi E. Adopting self-service technology to do more with less. J Serv Mark. 2013; 27:3–12.
crossref
14. Wei W, Torres E, Hua N. Improving consumer commitment through the integration of self-service technologies: a transcendent consumer experience perspective. Int J Hosp. 2016; 59:105–115.
crossref
15. Kimes SE. The role of technology in restaurant revenue management. Cornell Hosp Q. 2008; 49:297–309.
crossref
16. Yepes MF. Mobile tablet menus: attractiveness and impact of nutrition labeling formats on millennials' food choices. Cornell Hosp Q. 2015; 56:58–67.
17. Pomeranz JL, Brownell KD. Legal and public health considerations affecting the success, reach, and impact of menu-labeling laws. Am J Public Health. 2008; 98:1578–1583. PMID: 18633081.
crossref
18. Drichoutis AC, Lazaridis P, Nayga RM. Consumers' use of nutritional labels: a review of research studies and issues. Acad Mark Sci Rev. 2006; 9:93–118.
19. Jeong YS, Ham SO, Yang IS, Kim HY. Customer awareness of and satisfaction with menu labeling for restaurants. Korean J Hosp Tourism. 2014; 23:221–237.
20. Burton S, Creyer EH, Kees J, Huggins K. Attacking the obesity epidemic: the potential health benefits of providing nutrition information in restaurants. Am J Public Health. 2006; 96:1669–1675. PMID: 16873758.
crossref
21. Kim K, Kim M, Lee KE. Assessment of foodservice quality and identification of improvement strategies using hospital foodservice quality model. Nutr Res Pract. 2010; 4:163–172. PMID: 20461206.
crossref
22. Tandon PS, Zhou C, Chan NL, Lozano P, Couch SC, Glanz K, Krieger J, Saelens BE. The impact of menu labeling on fast-food purchases for children and parents. Am J Prev Med. 2011; 41:434–438. PMID: 21961472.
crossref
23. Auchincloss AH, Mallya GG, Leonberg BL, Ricchezza A, Glanz K, Schwarz DF. Customer responses to mandatory menu labeling at full-service restaurants. Am J Prev Med. 2013; 45:710–719. PMID: 24237912.
crossref
24. Ellison B, Lusk JL, Davis D. Looking at the label and beyond: the effects of calorie labels, health consciousness, and demographics on caloric intake in restaurants. Int J Behav Nutr Phys Act. 2013; 10:21. PMID: 23394433.
crossref
25. Lim HJ, Kim MJ, Kim KW. Factors associated with nutrition label use among female college students applying the theory of planned behavior. Nutr Res Pract. 2015; 9:63–70. PMID: 25671070.
crossref
26. Ahn JY, Park HR, Lee K, Kwon S, Kim S, Yang J, Song KH, Lee Y. The effect of providing nutritional information about fast-food restaurant menus on parents' meal choices for their children. Nutr Res Pract. 2015; 9:667–672. PMID: 26634057.
crossref
27. Lee JE, Lee DE, Kim K, Shim JE, Sung E, Kang JH, Hwang JY. Development of tailored nutrition information messages based on the transtheoretical model for smartphone application of an obesity prevention and management program for elementary-school students. Nutr Res Pract. 2017; 11:247–256. PMID: 28584582.
crossref
28. Lee K, Lee Y. Parents' meal choices for their children at fast food and family restaurants with different menu labeling presentations. Nutr Res Pract. 2018; 12:243–250. PMID: 29854330.
crossref
29. HealthCare.gov (US). Patient protection and affordable care act [Internet]. Baltimore (MD): HealthCare.gov;2010. cited 2019 November 17. Available from: https://www.healthcare.gov/glossary/patient-protection-and-affordable-care-act.
30. U.S. Food & Drug Administration. Changes to the nutrition facts label [Internet]. U.S. Food & Drug Administration;2017. cited 2019 November 17. Available from: https://www.fda.gov/Food/GuidanceRegulation/GuidanceDocumentsRegulatoryInformation/LabelingNutrition/ucm385663.htm#dates.
31. Department of Health (UK). Public health responsibility deal: food pledges. [Internet]. London: Department of Health;2011. cited 2019 November 17. Available from: https://responsibilitydeal.dh.govuk/food-pledges.
32. de Oliveira RC, da Costa Proenca RP, de Salles RK. The right to food and nutrition information in restaurants: a review/O direito a informacao alimentar e nutricional em restaurantes: uma revisao. Dementia. 2012; 7:47.
33. European Food Information Council. Global update on nutrition labeling [Internet]. Brussels: European Food Information Council;2016. cited 2019 November 17. Available from: https://www.eufic.org/images/uploads/files/ExecutiveSummary.pdf.
34. Ministry of Food and Drug Safety (KR). Korean government has enacted the special act on Children's food safety and nutrition [Internet]. Cheongju: Ministry of Food and Drug Safety;2016. cited 2019 November 17. Available from: http://www.kfda.go.kr/nutrition/index.do.
35. Jeong JY, Ham S. Application of the Health Belief Model to customers' use of menu labels in restaurants. Appetite. 2018; 123:208–215. PMID: 29248690.
crossref
36. Ministry of Food and Drug Safety (KR). Source [Internet]. Cheongju: Ministry of Food and Drug Safety;2018. cited 2018 November 20. Available from: mfds.go.kr/index.do.
37. Ministry of Health and Welfare (KR). The 2nd national nutrition management basic plan (2017~2021) [Internet]. Cheongju: Ministry of Health and Welfare;2017. cited 2018 November 23. Available from: http://www.mohw.go.kr/react/jb/sjb030301vw.jsp?PAR_MENU_ID=03&MENU_ID=0319&CONT_SEQ=340125&page=1.
38. Adams DA, Nelson RR, Todd PA. Perceived usefulness, ease of use, and usage of information technology. Manage Inf Syst Q. 1992; 16:227–247.
39. Hendrickson AR, Massey PD, Cronan TP. On the test-retest reliability of perceived usefulness and perceived ease of use scales. Manage Inf Syst Q. 1993; 17:227–230.
crossref
40. Igbaria M, Parasuraman S, Baroudi JJ. A motivational model of microcomputer usage. J Manage Inf Syst. 1996; 13:127–143.
crossref
41. Davis FD. Perceived usefulness, perceived ease of use, and user acceptance of information technology. Manage Inf Syst Q. 1989; 13:319–340.
crossref
42. Shim HS, Han SR. Effects of TR and consumer readiness on SST usage motivation, attitude and intention. Asia Mark J. 2012; 14:25–48.
43. Moon HY. A study on restaurant customer-based IT services: focused on technology acceptance model. J Tourism Leis Res. 2018; 30:325–339.
44. Heijden H. User acceptance of hedonic information systems. Manage Inf Syst Q. 2004; 28:695–704.
45. Oh H, Jeong M, Baloglu S. Tourists' adoption of self-service technologies at resort hotels. J Bus Res. 2013; 66:692–699.
crossref
46. Ku EC, Chen CD. Fitting facilities to self-service technology usage: evidence from kiosks in Taiwan airport. J Air Transp Manage. 2013; 32:87–94.
crossref
47. Venkatesh V, Morris MG. Why don't men ever stop to ask for direction? Gender, social influence, and their role in technology acceptance, and usage behavior. Manage Inf Syst Q. 2000; 24:115–139.
48. Davis FD, Bagozzi RP, Warshaw PR. User acceptance of computer technology: a comparison of two theoretical models. Manage Sci. 1989; 35:982–1003.
crossref
49. Ajzen I, Fishbein M. Predicting and understanding consumer behavior: attitude-behavior correspondence. Understanding Attitudes and Predicting Social Behavior. Englewood Cliffs (NJ): Prentice-Hall;1980. p. 148–172.
50. Burt RS. Interpretational confounding of unobserved variables in structural equation models. Sociol Methods Res. 1976; 5:3–52.
crossref
51. Anderson JC, Gerbing DW. Structural equation modeling in practice: a review and recommended two-step approach. Psychol Bull. 1988; 103:411–423.
crossref
52. Kline RB. Software review: software programs for structural equation modeling: AMOS, EQS, and LISREL. J Psychoed Assess. 1998; 16:343–364.
crossref
Fig. 1

Conceptual Framework of the Study.

TAM: technology acceptance model.
nrp-14-167-g001
Fig. 2

Results of structural model and path coefficients.

Solid lines indicate significant paths, while dotted line indicates non-significant path. a: standardized coefficients. PU, perceived usefulness; PEOU, perceived ease of use. * P < 0.05, ** P < 0.01
nrp-14-167-g002
Table 1

Description of measures

nrp-14-167-i001
Construct/questionnaire items
Menu information quality (MIQ)
 MIQ1 I can predict the way how the menu looks like
 MIQ1 I can understand the ingredients of the menu I ordered.
 MIQ1 This kiosk is good at offering menu information
Nutrition information quality (NIQ)
 NIQ1 I understood the calories of the menu I ordered
 NIQ2 I learned how much calories I ordered
 NIQ3 This kiosk provided me with the calorie of the menu I ordered
TAM Characteristics
 PU1 Use of the kiosk is effective than ordering through cashiers.
 PU2 Use of the kiosk is faster than going through cashiers.
 PU3 More convenient
 PU4 Use of the kiosk is overall more useful than going through cashiers.
 PEOU1 Use of the kiosk is not hard for me
 PEOU2 It is simple and easy to learn the use of the kiosk
 PEOU3 The process is easy
 FUN1 Fun
 FUN2 Enjoyable
 FUN3 Interesting
 FUN4 Happy
Behavioral intention (BI)
 BI1 I will spread positive word of mouth
 BI2 I will recommend the use of a kiosk to friends and colleagues
 BI3 I will prefer to using the kiosk
 BI4 I will continue using the kiosk
 BI5 I will use the kiosk despite the existence of cashiers

TAM, technology acceptance model; PU, perceived usefulness; PEOU, perceived ease of use.

Table 2

Confirmatory factor analysis results

nrp-14-167-i002
Variables Standardized loading t-value AVE1) Composite reliability Cronbach's α
Menu infor mation quality
 MIQ1 0.602 9.191** 0.553 0.782 0.761
 MIQ2 0.653 9.965**
 MIQ3 0.899 -
Nutrition information quality
 NIQ1 0.883 14.981** 0.756 0.903 0.885
 NIQ2 0.872 15.134**
 NIQ3 0.795 -
Perceived usefulness
 PU1 0.788 15.569** 0.647 0.879 0.899
 PU2 0.782 15.358**
 PU3 0.877 18.769**
 PU4 0.876 -
Perceived ease of use
 PEOU1 0.858 18.752** 0.690 0.911 0.914
 PEOU2 0.891 20.057**
 PEOU3 0.902 -
 Fun 0.713 0.908 0.931
 FN1 0.893 20.090**
 FN2 0.950 22.655**
 FN3 0.794 16.053**
 FN4 0.872 -
Behavioral Intention
 BI1 0.819 - 0.712 0.925 0.935
 BI2 0.830 15.715**
 BI3 0.902 17.883**
 BI4 0.892 17.591**
 BI5 0.871 16.919**

** P < 0.01

χ2 = 433.377, df = 194, χ2/df = 2.234, NFI = 0.908, IFI = 0.947, TLI = 0.937, CFI = 0.947, RMSEA = 0.070

1) AVE: average variance extracted

Table 3

Correlation coefficients between variables

nrp-14-167-i003
1 2 3 4 5 6
1. Menu information quality 0.5531) 0.4943) 0.385 0.370 0.360 0.435
2. Nutrition information quality 0.2442) 0.756 0.289 0.354 0.421 0.326
3. Perceived usefulness 0.148 0.084 0.647 0.584 0.453 0.780
4. Perceived ease of use 0.137 0.125 0.341 0.690 0.304 0.618
5. Fun 0.130 0.177 0.205 0.091 0.713 0.524
6. Behavioral intention 0.189 0.106 0.608 0.382 0.275 0.712

1) AVE: average variance extracted

2) Figures refer to the squared values of the correlation coefficients, r2

3) Figures refer to the correlation coefficients, r

Table 4

Results of hypotheses testing

nrp-14-167-i004
Hypotheses Path coefficient (β) t-value Result
H1. Menu information quality → PU 0.313 3.630** Supported
H2. Menu information quality → PEOU 0.372 3.980** Supported
H3. Menu information quality → Fun 0.299 3.417** Supported
H4. Nutrition information quality → PU -0.045 -0.603 -
H5. Nutrition information quality → PEOU 0.171 1.972* Supported
H6. Nutrition information quality → Fun 0.29 3.462** Supported
H7. PEOU → PU 0.52 7.324** Supported
H8. PU → Behavioral Intention 0.659 9.350** Supported
H9. PEOU → Behavioral Intention 0.194 3.326** Supported
H10. Fun → Behavioral Intention 0.184 4.307** Supported

* P < 0.05, ** P < 0.01

PU, Perceived usefulness; PEOU, Perceived ease of use.

χ2 = 449.279, df = 198, χ2/df = 2.269, NFI = 0.902, IFI = 0.943, TLI = 0.933, CFI = 0.942, RMSEA = 0.071

TOOLS
Similar articles