

 PDF
PDF ePub
ePub Citation
 Print
Print


INTRODUCTION
Rapid industrial development and improved economic levels, along with reduced physical activity and Westernized dietary patterns, are fostering an increase in the obese population [1]. According to 2016 National Health Statistics, the obesity rate among adult men and women has been increasing steadily over the past decade. Especially, the severely obese population (with a body mass index, or BMI, of 30 or above) has been reported as 26%-higher than the OECD average (25.6%) [2]. Socioeconomic losses resulting from obesity were assessed at KRW 9.2 trillion in 2015, a twofold increase over the past decade. Costs are expected to accelerate because of such factors as aging [2]. Various chronic diseases, including obesity, diabetes, hypertension, cardiovascular diseases, and cancer, are associated with an overweight condition [34], and an underweight condition is linked to an increase in malnutrition, pulmonary diseases, digestive diseases, and osteoporosis [56]. Additionally, mortality from these conditions is on the rise. Accordingly, maintaining proper weight is very important for reducing the likelihood of disease and related costs and supporting a healthy and longer life.
To maintain proper weight, assessments of environmental and genetic factors that cause energy imbalance are necessary. An appropriate perception of one's weight, efforts to lose weight, the weight loss method, and an analysis of related factors can be used as evidence for suggesting medical, clinical, and nutritional treatments necessary for healthy weight management.
Physical appearance has become a very important means of expressing oneself in modern society. As interest in women's diets-for those who want slim figures-is increasing with the current focus on physical appearance, maintaining a proper weight is becoming difficult. A study regarding the weight control behaviors of college students in 20 countries reported that South Korean female college students are determined to lose weight though often underweight [7]. According to a study by Kim et al., [8] 47.5% of female college students considered themselves obese, although the actual obesity rate was only 4%. Further, 86.2% of the students responded that they needed to lose weight despite normal weight levels. The studies cited above, like most previous studies on body shape perceptions, focused on female college students, and research on body shape perceptions of the elderly is lacking. Accordingly, research on body shape perception by age, gender, and weight control behavior is necessary to develop appropriate nutrition education for healthy weight control.
Results of an analysis of subjective body shape perceptions from the Korea National Health and Nutrition Examination Survey administered from 2001 to 2014 showed that incorrect perceptions of body shape tended to increase as age and body weight increased, and efforts to lose weight also tended to escalate as body weight increased [9]. An analysis of interactions with environmental factors was difficult, however, because attitudes toward weight control and the changing patterns of health-related lifestyle habits based on body shape perceptions were not evaluated in the survey.
Weight is closely related to individual lifestyle, economic level, social status, behavior and dietary patterns influence overweight [10]. Moreover, sleep quality was considered as an important factors of intervention program for prevention and management of obesity [1112]. Therefore, in this study, weight control attitudes, health-related lifestyle habits, sleep quality, economic level, and dietary habits of male and female adults residing in the metropolitan and non-metropolitan area were examined according to body shape perceptions and degree of obesity by age. Then, the basis for desirable dietary behavior and systematic nutrition education aimed at maintaining proper weight was proposed.
SUBJECTS AND METHODS
Subjects and duration
A survey of adults aged 20 to 65 years who were residing in the metropolitan and non-metropolitan area was conducted. The participants were selected on a random basis after taking their voluntary approval. The total number of participants, excluding those whose responses were incomplete, was 536 (209 males, 327 females). The survey was conducted from November 1, 2018, to December 31, 2019. The present study was conducted after obtaining approval (IRB No. EUIRB 2018-111) from the Institutional Review Board (IRB) of Eulji University.
Content and scope of the survey
Existing literature was consulted for developing the questionnaire administered in the present study that inquired about general items, physical measurements, type of residence, perception of one's body shape, weight control, and lifestyle habits (activity level, exercise, frequency of dining out, and sleep quality). The questionnaire was used after dissemination of a preliminary survey and supplementation. Age, type of job, place of residence, and economic level were used as sociodemographic factors. Age categories were 20–29 years, 30–39 years, 40–49 years, 50–59 years, and 60 years or older. Jobs categories were student, blue-collar worker, white-collar worker, and unemployed. Place of residence referred to the metropolitan and non-metropolitan area. Economic levels were as follows: affluent, somewhat affluent, average, somewhat difficult, and very difficult. Categories for subjective body shape perception were dissatisfaction and satisfaction. Using a BMI measurement calculated from one's height and weight, body weight was categorized as either normal (18.5 kg/m2 ≤ BMI ≤ 23.0 kg/m2) or abnormal (BMI ≤ 18.5 kg/m2 or BMI ≥ 23.0 kg/m2) [13]. Weight control was categorized according to the frequency of participants' dieting experiences (i.e., have been on a diet, diets sometimes, has never been on a diet). Categories for frequency of eating out were: almost never, 1–2 times/week, 3–4 times/week, 5 or more times/week. Subjective health status was categorized as “good” (i.e., healthy/no disease, relatively healthy, though with occasional body aches and fever), and “poor” (i.e., no specific disease but tired and somewhat weak or currently diagnosed with a disease). Daily activity level was categorized as low (very light activity), moderate (average level of physical activity and exercise), and high (intense or extreme activity).
Data processing and statistical analysis
All statistical analyses were performed using SAS statistical software version 9.4 (SAS Institute, Cary, NC, USA). A P-value < 0.05 was considered to indicate a statistically significant difference. The distribution of each categorical variable was examined by an analysis of frequencies and percentages, and χ2 tests were performed. T-test dla was also performed for continuous variables to compare mean and standard deviation values. A number of binary logistic regression analyses were performed to determine the influence of BMI and body shape perception on weight control behaviors. The independent variables were BMI and body shape perception, and the dependent variable was the weight control behavior experience. Influence was determined by the odds ratio (OR) of the dependent variable according to the independent variable categories.
RESULTS
Characteristics of subjects' general characteristics based on weight status
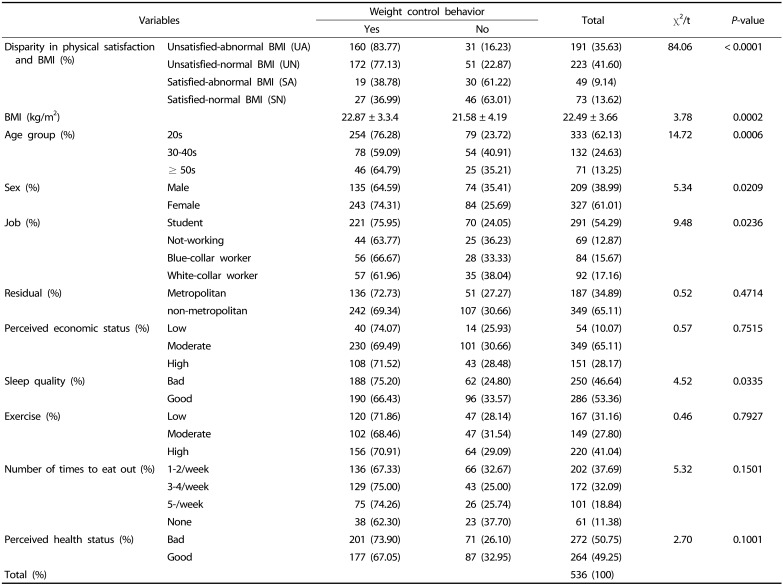
A general characteristics of the subjects according to weight status is presented in Table 1. Males comprised 38.99% of the sample, and female subjects accounted for 61.01%, Most participants were aged 20–29 years (62.13%). Additionally, most participants were students (54.29%), and a higher proportion of the subjects (65.1%) lived outside the metropolitan area. The economic level applicable to the majority of subjects (65.1%) was average (i.e., moderate). Further, 53.4% of the participants reported that their sleep quality was “good” (slightly higher than those who regarded their sleep quality as “bad”). A high level of daily activity (i.e., exercise) was predominant (41.0%), followed by low (31.2%) and average (27.8%) activity levels. In terms of eating out, the most frequent response was 1–2 times per week (37.7%). Regarding individuals' perceived health status, 49.25% of the subjects responded “good” and 50.8% responded “bad.”
Relation of BMI and body shape perception
The relation of body shape perception according to BMI is presented in Table 1. The average BMI of the participants in the survey was within normal limits (22.49 kg/m2). The analysis of body shape perceptions according to BMI showed that 22.76% of the participants, including 73 (13.6%) participants with normal BMIs and 49 (9.1%) with abnormal BMIs, were satisfied with their body shapes, whereas 77.2%-223 subjects (41.6%) with normal BMIs and 191 (35.6%) with abnormal BMIs-were dissatisfied with their body shapes.
Relation of BMI, body shape perception, and weight control behavior
The weight control behaviors based on BMI and body shape perception showed that when participants were satisfied with their body shapes, they typically did not engage in weight control behaviors, unlike those who were dissatisfied with their body shapes regardless of BMI level. Study participants responded that they engaged in weight control behaviors-regardless of BMI level-when they were dissatisfied with their body shapes. An analysis of weight control behavior by age showed that more subjects engaged in weight control behaviors compared to those who did not for all age groups; furthermore, 76.28% of participants in their 20s responded that they engaged in weight control behaviors. The analysis of weight control behavior by gender showed a higher frequency for males and females engaging in such behavior than those who did not, and 74.31% of female participants responded that they made efforts to control their weight (Table 1).
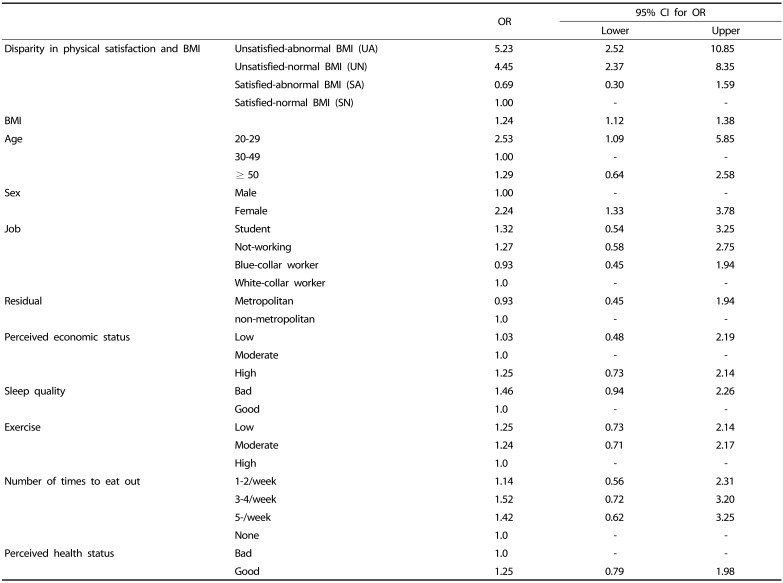
A logistic regression analysis was performed to determine relations between satisfaction with body shape and weight control behavior (Table 2). For the analysis, body shape satisfaction, according to BMI, was set as the variable of interest, and weight control behavior was set as the dependent variable. Participants whose BMIs were abnormal and who were dissatisfied with their body shapes (UA) engaged in weight control behaviors 5.23 times more than those whose BMIs were normal and who were satisfied with their body shapes (SN), whereas participants with normal BMIs but dissatisfaction with their body shapes (UN) engaged in weight control behaviors 4.45 times more. Participants in their 20s engaged in weight control behaviors 2.53 times more than participants in their 30s and 40s. In addition, female participants engaged in weight control behaviors 2.24 times more than male participants (Table 2).
Relation between body shape perception and weight control behavior by age, quality of sleep, and place of residence
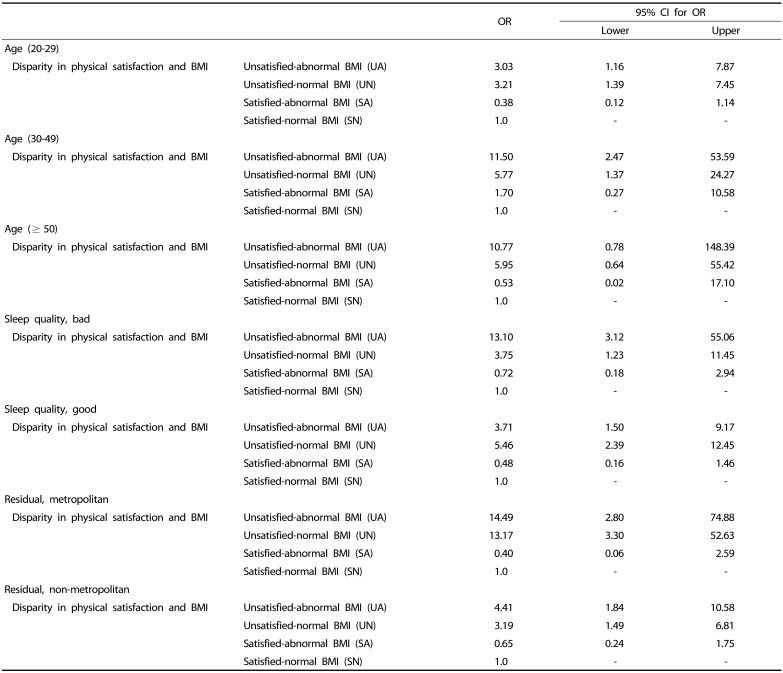
The relation between body shape perception and weight control behavior by age revealed that participants in their 20s who were dissatisfied with their body shapes-regardless of BMI-were found to engage in weight control behaviors 3 times or more than the SN group. Further, the OR for participants in their 30s and 40s who were dissatisfied with their shapes was 5 or more (cross ratio) (Table 3).
An analysis of body shape perceptions and weight control behaviors based on quality of sleep showed that many participants were dissatisfied with their body shapes, regardless of BMI, when their sleep quality was not good. Additionally, they engaged in weight control behaviors at a significantly greater rate compared to participants with the SN group. The UN group is a participant who has experienced “bad” sleep quality and the OR for weight control behavior is 3.75. The OR of the UA group with “bad” sleep quality is 13.1 (Table 3). On the other hand, the results of the SN group were similar regardless of whether the quality of sleep was “good” or “bad”. The UN group with “good” sleep quality had a higher OR than the UA group. Therefore, weight control behavior was determined to be affected by the quality of sleep.
The analysis of body shape perceptions and weight control behaviors according to place of residence showed that participants residing in metropolitan (Seoul) who were dissatisfied with their body shapes, regardless of BMI, engaged in weight control behaviors 13 times or more than SN group residing in metropolitan (Seoul). On the other hand, participants residing in the metropolitan area who were dissatisfied with their body shapes, regardless of BMI, engaged in weight control behaviors 3 times or more than the SN group (Table 3). Therefore, the influence of the place of residence on weight control behavior was confirmed. Specifically, participants who resided in metropolitan and were dissatisfied with their body shapes tended to engage in weight control behaviors to a greater extent than participants who resided in the non-metropolitan area.
DISCUSSION
Obesity is more than a simple issue regarding appearance; it causes physical problems. In serious cases, it is a chronic disease that requires treatment. Obesity has been associated with diabetes, cardiovascular disease, gallbladder disease, colon cancer, and breast cancer [1415]. Moreover, many obese women engage in weight control behaviors to prevent diseases caused by obesity, and even non-obese women diet for health reasons [16].
The present study was conducted to understand and analyze weight control behaviors according to BMI and body shape perception. In studies by Kim et al. [17] and Kim et al. [18], about 43.5% of the subjects correctly perceived their body shapes, whereas about 56.6% of the subjects perceived their shapes as either fatter or slimmer than their actual body shapes. Additionally, the findings of previous studies in which more subjects were dissatisfied with their shapes-regardless of BMI-were similar to that of the present study. For example, Park et al. [19] reported that 41.7% of the subjects viewed their shapes as “average,” followed by “relatively fat,” when asked about their satisfaction with their body shapes (even though their BMIs were within normal limits). In fact, 79% of the subjects wanted to be thinner than they were (Table 1). Subjects assessed their body shapes as fatter or more obese than they were, as seen in the high response rate for “not satisfied” (41.6%) to a question in the present study regarding body shape, despite normal BMIs. Higher rates of dissatisfaction with body shape were noted, indicating the need for an accurate definition of obesity, relevant criteria, and education to inculcate accurate and healthy body images.
Body mass index and self-satisfaction with body shape were set as variables affecting weight control behavior in the present study, and the results confirmed that both factors affect such behaviors (Table 1). The average BMI of the participants who responded that they engaged in weight control behaviors was 22.87 kg/m2, which was significantly higher than 21.58 kg/m2 reported for participants who responded that they did not engage in such behaviors. The finding indicates that participants with higher BMIs were more sensitive regarding weight control behaviors than their counterparts, which is consistent with the finding of Yang et al. [20], who reported that the higher the BMI, the more the subjects tended to engage in weight control behaviors. In the present study, BMI and satisfaction with body shape were divided into four groups to determine their correlations with weight control behaviors. The results showed that participants who were not satisfied with their body shapes were more sensitive about weight control behaviors, regardless of their BMIs, than those with normal BMIs and satisfaction with body shape (SN). The OR for participants whose BMIs were abnormal and who were dissatisfied with their body shapes (UA) was 5.23. Consequently, the findings of the present study indicate that not only adults' BMIs but also satisfaction with body shape are related to weight control behaviors.
In addition, a logistic regression analysis was performed to determine the correlation between weight control behavior, age group, sleep quality, and place of residence according to BMI and satisfaction with body shape. Consequently, the OR by age indicated that participants in their 20s, 30s, and 40s engaged in weight control behaviors if they were dissatisfied with their body shapes, regardless of BMI. Their behaviors contrasted with those of participants with normal BMIs and satisfaction with their body shapes (S-N). Kim et al. [21] also suggested that adults who were 50 or older were in need of education-more so than adults in their 20s-40s-about normal BMI and nutrition. Their study indicated that perceptions of BMI by subjects who were 50 or older were higher than the normal limits.
The OR for participants who responded that their sleep quality was poor and engaged in weight control behaviors was 13.10 and 3.71 times more than those who assessed the quality of their sleep as “good.” Ock et al. [22] reported that the shorter the sleep duration, the higher the risk for obesity. In the present study, the OR for weight control behavior differed according to sleep quality for the group with abnormal BMIs and dissatisfaction with body shape. These findings can be interpreted as emphasizing the importance of proper sleep as an independent health behavior that is distinct from physical activity and eating habits in the prevention and management of obesity. Based on these findings, future research is needed regarding the optimal sleep duration for reducing the risk of obesity; a prospective study would include various aspects of sleep quality.
Furthermore, a review of differences between metropolitan and non-metropolitan areas revealed that participants in the metropolitan area who were dissatisfied with their body shapes engaged in weight control behaviors, regardless of their BMIs; their attempts to control their weight were greater compared to participants with normal BMIs and satisfaction with body shape. The results may possibly be explained by the metropolitan area's more frequent exposure to nutrition education through more diverse content and media than in non-metropolitan areas. The findings indicate that nutrition education currently conducted in the metropolitan area should be expanded to non-metropolitan areas.
A correct perception of one's body shape is an important factor for dietary behavior because body shape perception and weight control behaviors are highly related. A correct perception of body shape, regard for the importance of maintaining normal weight, and nutrition education for desirable weight control are necessary for preventing excessive weight control behaviors when perceptions of body shape are incorrect. Additionally, an accompanying weight control program that addresses a correct perception of body shape is necessary.
 XML Download