

 PDF
PDF ePub
ePub Citation
 Print
Print


INTRODUCTION
Due developments in medical technology, the increasingly wide availability of medical services, and improvements in living standards, life expectancy and the total population have increased worldwide. Korea is experiencing a rapid increase in its elderly population. The elderly population aged 65 or older accounted for 9.1% of the population in 2005 and 14.3% of the population in 2018; this figure is expected to increase to 20.8% in 2026 [12]. In the elderly, oral health is closely related to general health and can cause many problems. With life expectancy increasing rapidly, problems related to the elderly are gradually being recognized as social problems. To maintain the health of the elderly, physical and mental health as well as balanced nutrition are essential. During aging, oral health is closely related to systemic health conditions, and dry mouth increases the risk of dental caries, periodontitis, candidiasis, dental erosion, and demineralization [3] and influences quality of life [4]. Dry mouth syndrome is a major cause of oral health problems in elderly people since it affects salivary function, dysphagia, digestion, taste, and appearance; due to these effects, dry mouth can influence the social lives and interpersonal relationships of the elderly. Overall, there are many ways in which dry mouth influences the quality of life of the elderly. The xerostomia is the subjective feeling of dry mouth in medical terminology. In our study, xerostomia is referred to as dry mouth. Dry mouth can result in the underconsumption of foods due to reduced oral function. The elderly has a higher proportion of dry mouth than other age groups. Elderly individuals with xerostomia-induced dry mouth have limited reduced chewing ability, nutrient deficiencies, food options, low diet quality and poor health [5]. People with decreased salivary flow experience symptoms that may include burning and itching of the oral mucosa and tongue. They also have trouble chewing, tasting, swallowing foods and communicating with others [6]. Moreover, they have difficulty eating, and their sense of taste is usually impaired [7]. Dry mouth was found to be correlated with difficulties wearing dentures and worse diet quality and quantity [8]. Reduced chewing ability limits the amount of food digested and absorbed and results in nutrient deficiencies (malnutrition). Dry mouth occurs as a result of the adverse effects of medication, the toxicity of chemotherapy and/or radiation therapy of the head and neck, autoimmune diseases, other chronic diseases, and nerve damage [9]. Oral health status is related to the nutritional status of the elderly. Previous studies have investigated dry-mouth symptoms in the elderly, but few studies have investigated the correlation between xerostomia-induced dry mouth and nutritional intake in the elderly in Korea. Only one research study was conducted in Japan [10].
Dry mouth includes xerostomia (subjective feeling of dry mouth) and hyposalivation (objectively measured reduction in salivary flow). The prevalence of dry mouth ranges from 0.9% to 46% in elderly individuals over 65 years old [11]. The most common cause of dry mouth is the aging process and taking medications for chronic diseases. A major risk factor for dry mouth is taking multiple medications [12]. The greater the number of drugs, the worse dry mouth becomes. The prevalence differs between men and women. Significantly more women experience dry mouth than men [13]. The elderly generally take several drugs. A few studies have shown that a number of drugs may decrease salivary secretion [14]. Other studies have revealed that cardiovascular medicines reduce the stimulated salivary flow rate [15]. More than 500 drugs are known to cause dry mouth [16], and the use of multiple xerostomic medications is associated with severe dry-mouth symptoms.
Dry mouth may influence dietary intake, resulting in nutritional deficiencies [17]. Nutrition is an important element of health in the older population. In general, older people have reduced oral intake. In a previous study, we found that dry mouth patients (primary those with Sjögren's syndrome) had lower salivary secretion, developed dental caries, and experienced oral inflammatory diseases. In addition, they exhibited dysphagia and dysmotility of the pharynx [18]. Their taste and smell senses were reduced. Dry mouth may reduce appetite and impair salivary secretion [719]. Dry mouth also contributes to difficulties eating and swallowing. People with dry mouth have reduced taste perception and trouble eating dry foods [719]. In Japan, the hyposalivation of 80-year-old subjects was associated with lower intakes of nutrients and food [10].
Motivated by the increase in life expectancy of the global population, we investigated the link between oral health and nutrition in the elderly aged 65 and older. There are many kinds of dental issues, such as chewing ability, dry mouth, dental carries, periodontitis and bleeding gums. Dry mouth is known to be a frequent complaint present in elderly over 65. We chose dry mouth for study because of the increase in the number of the elderly, as problems with systemic diseases increase, and concomitantly, taking medications increases. The number of medications taken associated with systemic diseases gradually increased. Elderly with xerostomia-induced dry mouth was caused by an increase in the number of medications taken among the elderly; therefore, this study was conducted to determine their medication use and nutrient intakes.
The aim of this study was to investigate elderly individuals with dry mouth and the nutrient intakes of the elderly. In addition, we investigated associations between medication use in the elderly and xerostomia-induced dry mouth. We also evaluated the effects of dry mouth on oral health and quality of life.
Go to : 
SUBJECTS AND METHODS
Recruitment process
From September 4 to 19, 2017, a questionnaire was completed by 123 (mean age: 69 ± 1 y) patients who visited the University's dental hospital for a regular examination. The size of the sample was calculated using the G power 3.0 program with a mean effect size of .15, a significance level .05, a statistical power of .80, and independent and categorical variables. Our inclusion criteria for the study participants were the following: 1) ≥ 65 years old; 2) able to read, understand, and answer the questionnaires; and 3) voluntary participation in the study. The exclusion criteria were as follows: for men, an intake of < 800 kcal or ≥ 4,000 kcal; for women, an intake of < 500 kcal or ≥ 3,500 kcal [20]. In addition, subjects with any condition that might change food intake significantly were excluded.
Study procedure
The questionnaire was conducted by a trained surveyor and took 20–30 minutes to complete, depending on the participant. The present study was approved by the Institutional Review Board (DKUDH IRB 2017-08-003). The final number of participants was 120. The participants consisted of 68 men and 52 women, and the ages of the participants ranged from 65 to 86 yrs.
Assessment of demographic, anthropometric and health-related characteristics
We analyzed demographic characteristics such as age, sex, height (cm), weight (kg), body mass index (BMI) (kg/m2), education level, alcohol consumption, cigarette use, physical activity and posterior teeth.
Assessment of living status and meal-related information
Living status was also used to classify the participants into two groups: (1) living alone and (2) living with family. Regarding meals (breakfast, lunch, and dinner), the participants were asked whether they consumed each meal with family, friends, or alone. Meal preparation was assessed in terms of who made the meals, such as the participant, their spouse, their children or a helper. The number of medications taken in one day was reported by a trained staff member during the interview. The number of medications taken by the study participants was categorized into five groups: 0, 1, 2, 3, and 4 ≥ drugs. The questionnaire also included the conditions for which the medication was prescribed by a doctor and taken by the study participants (i.e., hypertension, heart diseases (anticoagulants), hyperlipidemia, diabetes, osteoporosis, prostatitis, arthritis, stomach diseases, nerve diseases, and liver diseases).
Assessment of dietary intake
We obtained the dietary intake data of participants using one day before 24-hr recalls [21]. This method assessed food and beverage consumption during the previous day or the preceding 24 hr. To confirm the amount of food consumed, we showed the participants commonly used containers (e.g., bowls) for rice, soup, kimchi, bean sprouts, spinach, bracken, and side dishes. We recorded the amounts of foods and beverages. We entered the kinds and amounts of foods using Can-pro 5.0 (version) [22]. To measure the volume of foods, we used tools indicating length and weight and three-dimensional models. We analyzed the amounts of energy, macronutrients, vitamins, minerals, and fatty acids in the foods and beverages consumed.
Quality of life related to oral health
The quality of life related to oral health was measured using the Oral Health Impact Profile (the OHIP-14) by Slade [23]. It was composed of seven domains: physical limitation, physical pain, psychological discomfort, physical disability, psychological disability, social disability and handicap. Each of the 7 domains consisted of two questions. Responses were given on a 5-point Likert scale: 1 (never), 2 (hardly ever), 3 (sometimes), 4 (fairly often), and 5 (very often).
Assessment of dry mouth
A questionnaire on subjective dry-mouth feelings was used (including behavior related to oral dryness), and the responses were validated by conducting reliability and validity analyses [24]. A visual analog scale (VAS) was used, and the subjects indicated the degree of oral dryness in a straight line with a V mark. The higher the score, the greater the dryness of the participant's mouth. We categorized the VAS score as 0 points (not at all), 5 points (moderate), and 10 points (maximum imaginable). If the participants answered positively to at least 1 of the 7 questions [25], we evaluated the study participants' self-perceived severity of overall oral dryness on a numeric scale from 0–10. Subjects who responded to one or more of the seven questions in the questionnaire with dry mouth were grouped into the dry-mouth group.
To evaluate the degree of dry mouth, the following factors were assessed: (1) the mouth feels dry at night or upon waking; (2) the mouth feels dry during the day; (3) the mouth feels dry when eating a meal; (4) the mouth feels dry when speaking; (5) there are difficulties swallowing foods; (6) the amount of saliva in the mouth seems to be reduced most of the time; (7) the amount of discomfort in daily life caused by dry-mouth symptoms; (8) the participant wakes up thirsty at night; (9) the participant keeps a glass of water by the bed; (10) the participant needs to sip liquids to aid in swallowing dry foods; and (11) the participant chews gum or uses candy to relieve oral dryness. The subjective feeling of dry mouth was coded by the participants from 0 (no dry mouth) to 10 (severe dry mouth) using a VAS. In the VAS, a score of one or more point was regarded as dry mouth.
Chewing ability
To measure the chewing ability of Korean adults, we used the questionnaires previously developed by Kim [26], which are based on 11 foods that fit the Korean type. Each subject rated his/her ability to chew foods, including water/milk, rice, white egg (boiled), biscuits, kimchi, meat, radish kimchi, apple (sliced), peanuts, dried squid, and candy, on a 5-point Likert scale: 1 (never), 2 (hardly ever), 3 (sometimes), 4 (fairly often), and 5 (very often). The total score was from 1 to 55 points.
Statistical analysis
The participants' characteristics are presented as means and standard deviations (SDs). The level of significance was set at 0.05. Statistical analyses were performed using SPSS version 24.0 for Windows (SPSS Statistics, IBM). A t-test or ANCOVA test was applied. We used t-tests to investigate the mean differences between two groups. Can-pro 5.0 (Korean Nutritional Society) was used for dietary nutrient analysis. The ANCOVA test was used to eliminate the effects of covariates such as age and sex.
Go to :
RESULTS
Demographic and health-related characteristics of the study subjects
The demographic and health-related characteristics of the participants are provided in Table 1. Of the 120 participants, 47.5% were in the dry-mouth group (n = 57) and 52.5% were in the non-dry-mouth group (n = 63). There were no differences in age, height, weight, or BMI between the dry-mouth group and the non-dry-mouth group. The majority of participants (83.3%) were between 65 and 74 years old. A significantly higher female population distribution was observed in the dry-mouth group than in the non-dry-mouth group (56.1% vs. 31.7%) (P = 0.007). The number posterior teeth was not different between the dry-mouth group and non-dry-mouth group.
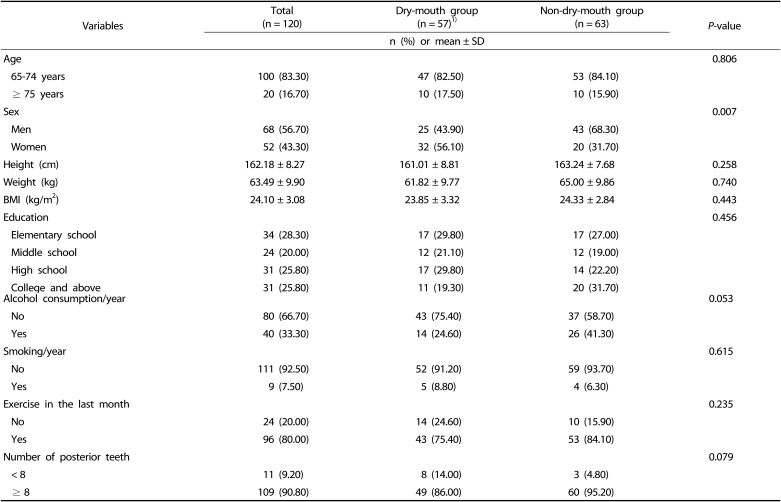
Table 1
Demographic and health-related characteristics of study participants
![]()
Living status and meal-related information
The proportions of participants living and having meals with others were not significantly different between the two groups. The living status and meal-related information of study subjects are shown in Table 2. Most of the participants (83.3%) were living with their family. The majority of participants in the dry-mouth group ate each meal with their family: 80.7% (n = 46) for breakfast, 45.6% (n = 26) for lunch, and 75.4% (n = 43) for dinner. There was a statistically significant association between two qualitative variables, the type of meal preparation and the dry-mouth group, with a markedly high rate (30, 52.6%) observed among those who prepared meals by themselves in the dry-mouth group (P = 0.038).
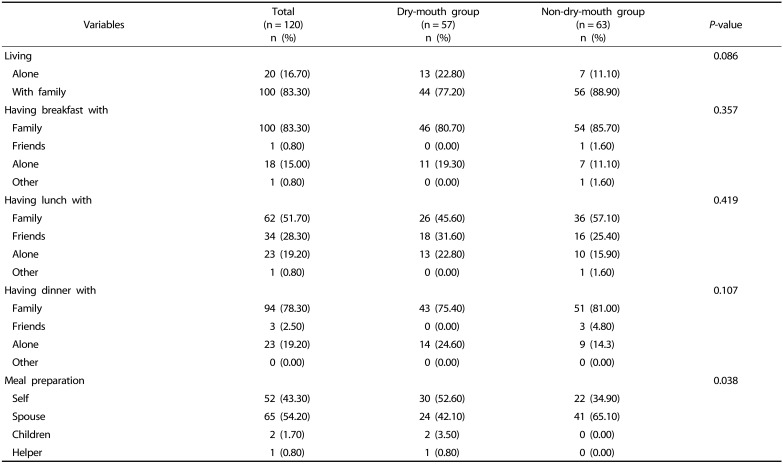
Table 2
Living status and meal-related information of study subjects
![]()
The number of medications and medical conditions
Table 3 presents the number of medications and medical conditions. Taking ≥ 4 medications was significantly more prevalent in the dry-mouth group (73.7%) than in the non-dry-mouth group (50.8%) (P = 0.019). The results indicated that half of the ≥ 65-year-old participants took medications. Between the two groups, significant differences in population distribution were observed among individuals taking medications for hypertension, diabetes, and osteoporosis. In the dry-mouth-group, a significantly higher population distribution was observed for those taking medication for hypertension (70.20%) compared with the non-dry-mouth group (44.40%) (P = 0.005). Additionally, a significantly higher population distribution was observed for those taking medications for diabetes in the dry-mouth group than in the non-dry-mouth group (28.10% vs 9.50%) (P = 0.009). Moreover, a significantly higher population distribution was observed for those taking osteoporosis medications in the dry-mouth group than in the non-dry-mouth group (21.10% vs. 7.90%) (P = 0.040). The mean number of medications taken was significantly higher in the dry-mouth group (5.42 medications) than in the non-dry-mouth group (3.27 medications). In the dry-mouth group, the highest proportion of participants took medications for hypertension (70.20%), followed by heart diseases (anticoagulants) (29.80%) and hyperlipidemia (29.80%).
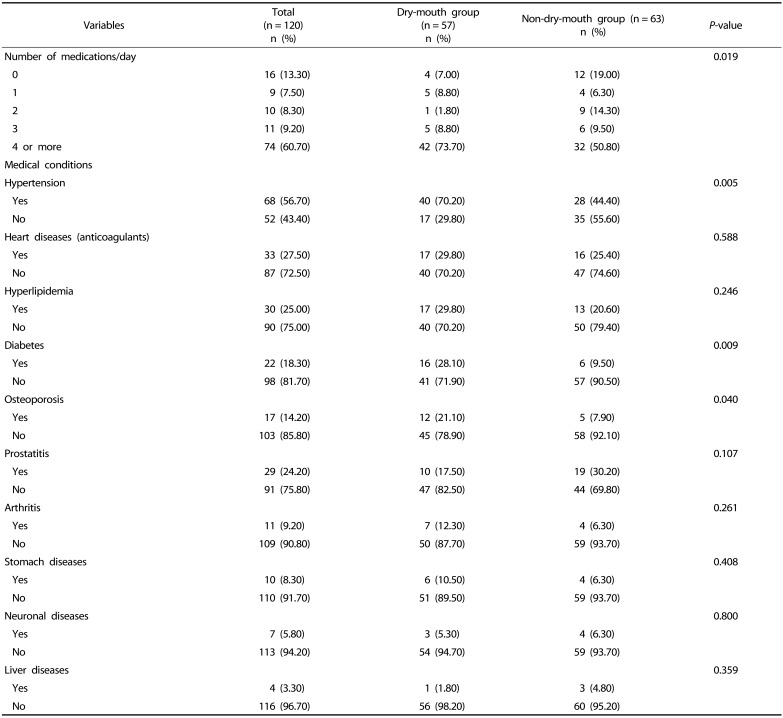
Table 3
Number of medications taken per day and medical conditions
![]()
Macronutrient and vitamin intakes
The macronutrient and vitamin intakes are shown in Table 4. The intake of water in the dry-mouth group (730.85 g) was dry-mouth groups significantly lower than in the non-dry-mouth group (958.77 g) (P = 0.031). There was also a significant difference in vegetable fat consumption between the dry-mouth group (14.41 g) and the non-dry-mouth group (19.43 g) (P = 0.022). The consumption of vitamin E was significantly lower in the dry-mouth group (11.15 mg) than in the non-dry mouth group (15.03 mg) (P = 0.039). Moreover, the consumption of folate was significantly lower in the dry-mouth group (337.22 µg) than in the non-dry mouth group (443.90 µg) (P = 0.005).
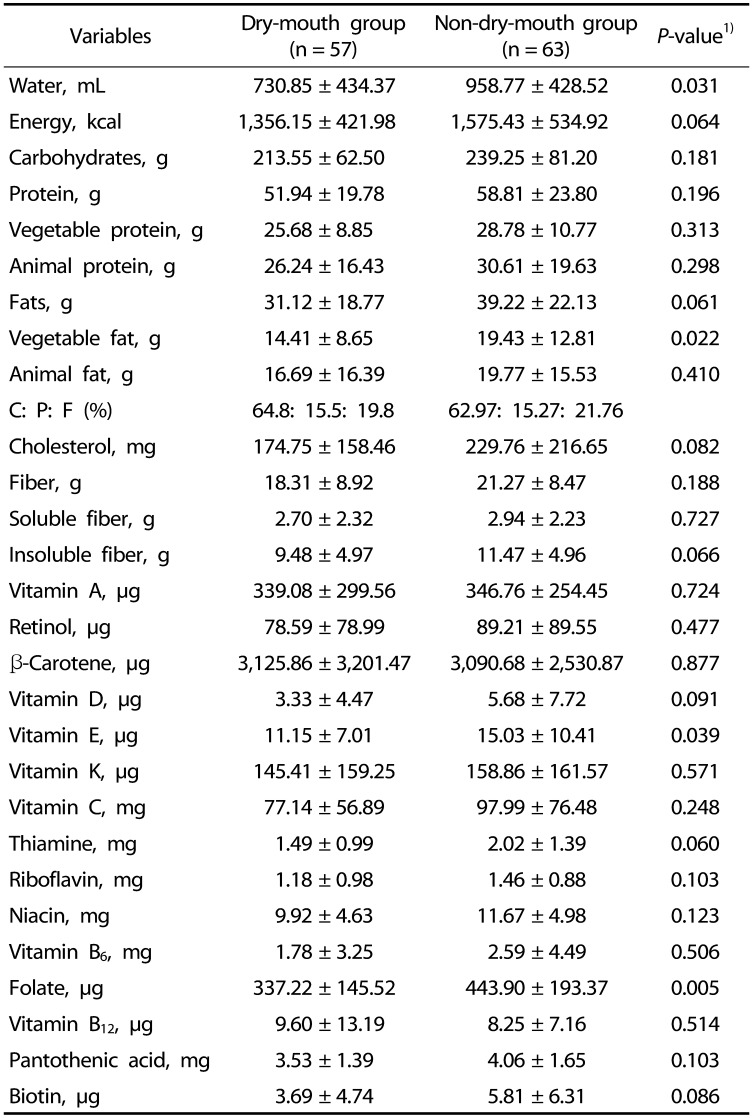
Table 4
Macronutrient and vitamin intakes of the participants
![]()
Mineral intakes
The mineral intakes of the dry-mouth group and the non-dry-mouth group are shown in Table 5. The consumption of fluoride was significantly lower in the dry-mouth group (0.01 mg) than in the non-dry- mouth group (0.02 mg) (P = 0.032).
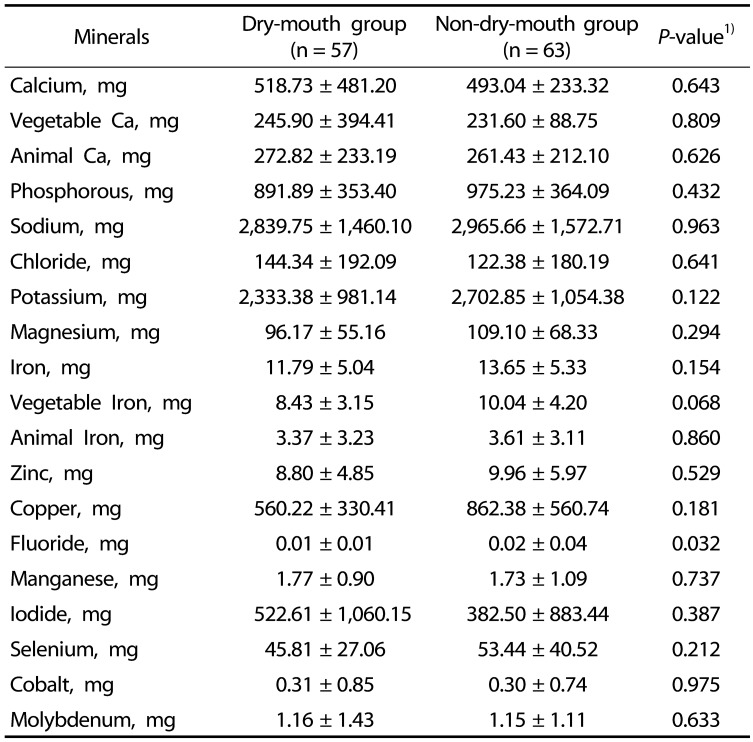
Table 5
Mineral intakes of the dry-mouth and non-dry-mouth groups
![]()
Fatty acids intakes
The fatty acids intakes of the dry-mouth group and the non-dry-mouth group are provided in Table 6. There was a significant difference in ω-3 fatty acids consumption between the dry-mouth group (0.70 g) and the non-dry-mouth group (1.23 g) (P = 0.038).
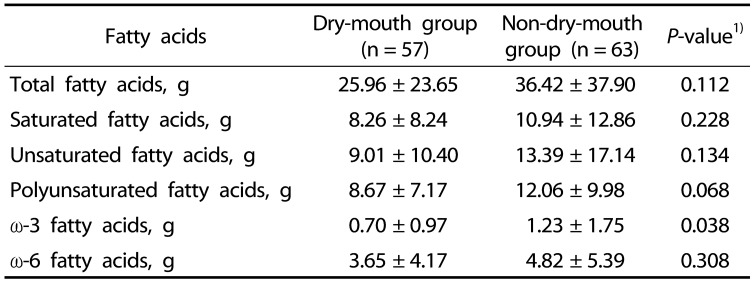
Table 6
Fatty acids intakes of the dry-mouth and non-dry-mouth groups
![]()
Chewing ability
Table 7 shows information for the selected foods of water/milk, rice, white egg (boiled), biscuit, kimchi, meat, radish kimchi, apple (sliced), peanuts, dried squid, and candy. The ability to chew peanuts was significantly lower in the dry-mouth group (3.04) than in the non-dry-mouth group (3.43) (P = 0.041). There was no significant difference in the total chewing ability scores between the dry-mouth group (35.86) and the non-dry-mouth group (37.94).
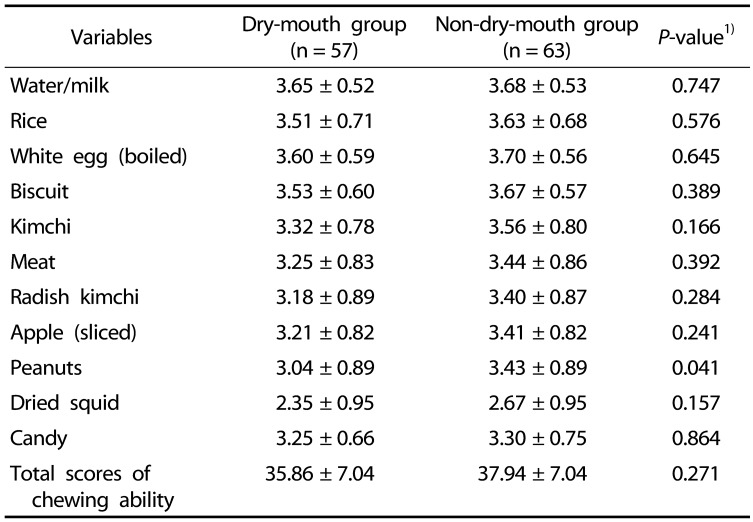
Table 7
Chewing abilities of the dry-mouth and non-dry-mouth groups
![]()
Oral health-related quality of life (OHIP-14)
Table 8 lists the questions included in the OHIP-14. There were significant differences between the two groups in the following parameters: sense of taste was worsened because of problems with individuals' teeth, mouth or dentures (P = 0.003), uncomfortable to eat any foods because of problems with individuals' teeth, mouth or dentures (P = 0.021), an unsatisfactory diet because of individuals' teeth, mouth or dentures (P = 0.006), and interrupted meals because of problems with individuals' teeth, mouth or dentures (P = 0.013).
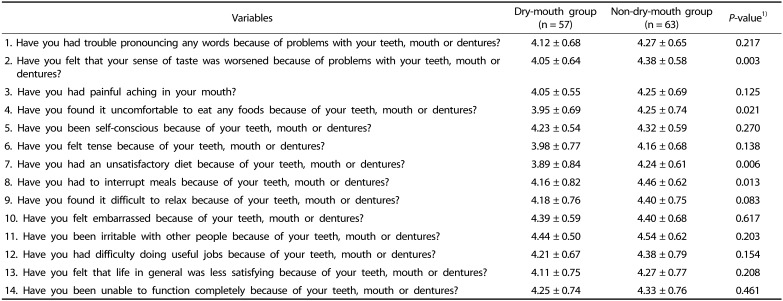
Table 8
Quality of life (OHIP-14) of the study participants
![]()
Go to :
DISCUSSION
The most common cause of dry mouth is the use of multiple medications for systemic diseases. Recently, the prolonged life expectancy has led to an increase in the use of drugs related to systemic diseases, resulting in decreased salivation. Regarding the medications used for systemic diseases, Kana Ichikawa [27] reported that the largest ratio of medications used was cardiovascular drugs (50.3%), followed by gastrointestinal drugs (33.4%) and psychiatric drugs (16.0%). Many authors have found that cardiovascular drugs are the most commonly used medications [28], leading to a reduced stimulated salivary flow rate. Our study showed that of the individuals in the dry-mouth group, 69% took antihypertensive drugs, and 31% took heart disease drugs (anticoagulants) (31.10%), revealing that elderly individuals taking antihypertensive agents, diabetes drugs, and osteoporosis drugs had a high risk of dry mouth. These diseases are the most frequently occurring chronic diseases, as suggested by Park et al. [29].
Johanson et al. [30] reported that the main cause of dry mouth was polypharmacy; research has indicated that taking multiple mediations, including cardiovascular drugs, antidepressants and antipsychotics, results in low salivary secretion. Elderly individuals with systemic diseases are more likely to take many kinds of drugs. The major cause of dry mouth is the decrease in salivary secretion due to medication use [31]. Moreover, the greater the number of drugs taken, the more severe the symptoms of the dry mouth.
Dry mouth is related to poor nutritional intake. If elderly individuals are malnourished, they are more likely to have systemic diseases. Thus, poor nutritional intake can result in individuals taking additional medications, and polypharmacy could result in compromised nutritional status, causing a vicious cycle. We found from this study that the majority of dry-mouth group participants had a lower water intake per day (730.85 mL) compared with the non-dry-mouth group participants (958.77 mL) (P = 0.031). These amounts are far less than the Korean recommended daily intake of water (i.e., 2,100 mL for men and 1,800 mL for women). Additionally, these amounts are far less than the average water intake of 1,098 mL/day for individuals 65 years or older reported by Lee et al. [32] from the Korean National Health and Nutrition Examination Study (KNHANES) from 2012–2018. The reason why individuals who have dry mouth tend to consume an insufficient amount of water is not clear, but we suggest that people taking more medications could have an increased loss of appetite, which might result in a lower consumption of water, eventually causing dry mouth.
Although there are many studies related to oral health diseases, there is a lack of studies focusing on nutrient intakes in elderly individuals with dry mouth. We found differences in nutrition intake and sex in elderly individuals between the dry-mouth group and the non-dry-mouth group. This study indicated that the prevalence of dry mouth was higher in women than in men. Similarly, a Swedish cohort study showed that female elderly individuals had a significantly higher prevalence of dry mouth during the day and at night than male elderly individuals [33]. Our study revealed that the dry-mouth group had a poorer dietary intake than the non-dry-mouth group. Specifically, our results showed that the dry-mouth group consumed significantly less water, vegetable fats, vitamin E, folate, fluoride, and ω-3 fatty acids. Other studies obtained similar results, indicating that the hyposalivation group had a significantly lower intake of many nutrients, including ω-3 polyunsaturated fatty acids, potassium, vitamin D, vitamin E, vitamin B6 and folate, than the group without hyposalivation (P < 0.05) [10].
Dry mouth is the most important predictor of quality of life related to oral health. Locker [34] and Lee [35] reported that dry mouth is related to low quality of life. Fox et al. [36] reported a relationship between dry mouth and mental well-being and quality of life. Decreased salivary secretion led to uncomfortable eating and talking [37], and quality of life was affected by malnutrition, thus resulting in systemic health problems [38]. Steel et al. [39] showed that as age increases, oral diseases become more prevalent, and quality of life worsens. Our research revealed that the dry-mouth group was affected more by the following factors than the non-dry-mouth group: sense of taste, uncomfortable to eat any foods, an unsatisfactory diet and interrupted meals.
This study has a few limitations. First, our research used a 24-hr recall to investigate the nutrient intakes, including water intake, of the study participants, but 24-hr recall could not reflect the habitual intake of the participants. Moreover, additional drinking water consumption was not assessed. We suggest that future studies employ at least 3-day recalls, including 2 weekdays and 1 weekend day with additional water consumption. Second, this study was conducted in the Cheon-An Dental Hospital. Because the research is restricted to one hospital, we cannot generalize our findings to the elderly Korean population. Therefore, we need to conduct a larger study covering all areas of South Korea. Third, dry mouth was assessed by subjective symptoms based on questionnaires [40]. Since we collected subjective feelings of dry mouth based on a questionnaire, the assessment lacked objectivity. For future research, it will be necessary to collect objective data, such as the salivary secretion rate. Fourth, we acquired the reason for taking each medication but not the detailed information about the specific names or doses of the medications because the elderly participants could not recall the names of their medications.
The strength of the study is that it focused on the elderly, who receive little attention in research. Our study is important because it dealt with multidimensional aspects of drugs and oral health, such as dry mouth, nutrient intakes and medications. Research focusing on the relationship between the use of multiple medications and dry mouth among elderly people in Korea is very limited. Previous studies have separately investigated nutrition, medication, and quality of life related to oral health in the elderly [41]. This work is a meaningful comprehensive study that simultaneously investigates nutrition, polypharmacy and oral health and their relationships among the elderly. Most previous studies regarding oral health diseases have been conducted in Western countries [42] and not in Asian countries, especially not in South Korea. Our research also revealed differences in nutrient intakes and oral health between the dry-mouth group and the non-dry-mouth group. We identified the insufficient intake of certain nutrients in the dry-mouth group. It is necessary for the elderly taking multiple medications to increase their water intake. Sufficient water intake is a dietary behavior essential for maintaining oral health.
In conclusion, dry mouth was associated with low nutrient intakes in elderly Korean participants. Our study determined that the dry-mouth elderly group had a lower intake of water than the non-dry-mouth elderly group (P = 0.031). From the physiological mechanism perspective, water intake among the elderly is very important. We found that not only multipharmacy but also drinking less water were important factors for maintaining oral health. We suggest emphasizing intentional water intake and possibly increasing nutrient intakes to improve dry mouth symptoms. Overall, we suggest the need to prevent oral dryness with sufficient intake of water in elderly individuals to improve everyday life.
Go to :
 XML Download