Journal List > Nutr Res Pract > v.14(2) > 1144017

Kim, Lee, and Kim: Comparisons of food security, dietary behaviors and nutrient intakes between adult North Korean Refugees in South Korea and South Koreans

Abstract

BACKGROUND/OBJECTIVES

North Korean refugees (NKRs) in South Korea are a unique population as they must adapt in a new country with similar cultural traits but different social, political, and economic systems, but little research has been conducted on diet and nutrition in this population. This study examined food security, dietary behaviors, and nutrient intakes among adult NKRs living in South Korea and compared them to those of South Koreans.

SUBJECTS/METHODS

The subjects were 139 adult NKRs (25 men, 114 women) living in the Seoul metropolitan area, and 417 age- and sex-matched South Korean controls (SKCs; 75 men, 342 women) selected from the Korea National Health and Nutrition Examination Survey (KNHANES). Food security and dietary behaviors (meal skipping, eating-out, meals with family, nutrition education and counseling, and nutrition label knowledge and utilization) were obtained using self-administered questionnaires. Nutrient intakes were assessed by 24-hr recall. The statistical analysis was performed using IBM SPSS ver. 23.0.

RESULTS

In South Korea, food security had improved over the previous 12 months, but remained significantly poorer for NKR women than SKC women. Meal skipping was three times more frequent than for SKCs and eating-out was rare. Average energy intake was 1,509 kcal for NKR men and 1,344 kcal for NKR women, which was lower than those of SKCs (2,412 kcal and 1,789 kcal, respectively). Significantly more NKRs (men 24.0%, women 21.9%) showed simultaneously deficient intake in energy, calcium, iron, vitamin A, and riboflavin than SKCs (men 2.7% (P = 0.003), women 7.0% (P < 0.001)). NKR women had a significantly higher index of nutrient quality (INQ) for some nutrients than SK women.

CONCLUSIONS

This study reports significant differences in food security, dietary behaviors, and nutrient intakes between NKRs and SKCs. Generally, NKRs reported lower intakes despite improved food security, but relatively good INQs across nutrients. Further research is needed to understand processes of food choice and consumption among NKRs to provide appropriate support aimed at improving diets.

INTRODUCTION

Immigrants and refugees are confronted by difficulties presented by new societies in many aspects of life, including diet. Research studies on diet and nutrition have often examined differences between immigrants and refugees and natives of host countries or changes experienced by immigrants and refugees as they reside in host countries. Such dietary changes are referred to as dietary acculturation [12], which describes changes in food and nutrient consumption and dietary behaviors adopted as immigrants and refugees adapt to new societies [12]. Research indicates immigrants and refugees often have to adapt to food environments that offer diverse foods in larger quantities and to food cultures that involve different food items and food norms [12]. Dietary acculturation generally includes the consumption of more foods rich in sugar and fat and less foods rich in micronutrients [34], more meal skipping [5], and more eating-out [678], as the diets and dietary behaviors of immigrants and refugees tend to shift toward those of people living in host countries. Therefore, a good understanding of dietary acculturation starts with careful appreciation of the differences of diets between immigrants and refugees and natives.
North Korean refugees (NKRs) living in South Korea are somewhat unique. They could be considered both immigrants and refugees [9], that is, they are considered immigrants because many left North Korea of their own will but they are also considered refugees because they cannot return to their home country. Uniquely, South and North Korea share many cultural aspects despite division in 1953. This separation has resulted in different political, economic, and social structures, but the 65 years that have passed after division have not substantially changed basic cultural traits. For example, North Koreans can communicate with South Koreans in the Korean language without difficulty.
Food cultures also appear to be similar [10], though South Korea has actively embraced globalization, and as a result food culture has been westernized and global foods are now widely consumed [11]. Furthermore, although basic food cultures are similar, food environments are quite different in the two countries. In North Korea, food was usually obtained via the Public Distribution System (PDS) of the planned economy system until the mid-1990s when food shortages and economic hardship severely diminished the effectiveness of the PDS. Small black markets, which hinted the beginning of a market economy, started to appear and offered limited additional food choices. The black market has now been allowed to substantially replace the PDS [10]. In contrast, South Korea offers food environments that are not dissimilar from those in the US or Europe. Many South Koreans buy groceries in large marts like COSTCO or Tesco weekly or fortnightly and use cars to transport the relatively large amounts of groceries. Eating-out is also common among South Koreans; 44.3% of South Korean men and 23.2% of South Korean women have been reported to eat out at least once a day [12].
Food availability is the most important difference between food environments in South and North Korea. South Koreans can purchase many diverse foods, and food insecurity is comparatively low at 5.2% [13], whereas North Koreans are still struggling to overcome the food crisis of the mid-1990s, during which severe famine resulted in approximately three million deaths [14] and the stunted growth of 62.3% of North Korean children [1516]. Although the food shortage situation has improved, approximately 40% of North Koreans are still undernourished and 70% receive food aid [17].
The majority of studies on diet and nutrition among immigrants and refugees have been conducted on populations with large economic, social, cultural, and language differences from those in host countries, and relatively few studies have studied immigrants and refugees in a host country with similar food cultures but large economic and social differences. In the present study, we examined food security, dietary habits, and energy and nutrient intakes of North Korean refugees residing in South Korea and compared these with those of South Koreans. The study was undertaken to fill data gap regarding NKRs, who represent a nutritionally vulnerable group in South Korea, and to provide an information source for those devising appropriate interventions to improve nutritional status and health among NKRs and North Koreans.

SUBJECTS AND METHODS

Participants and data collection

This cross-sectional study was based on data obtained during the North Korean Refugee health in South Korea (NORNS) cohort established at Anam Hospital of Korea University. The NORNS cohort aimed to examine the health statuses of adult NKRs (age >19 years) residing in the Seoul metropolitan area and to identify health-related indicators related to adaptation to South Korea. Participants were recruited through NKR-supporting NGOs using the snowball method. Participants in NORNS underwent an initial examination and a follow-up examination approximately 3.5 years later, during which dietary information was collected. Participants were asked to complete a questionnaire and to undergo a full medical check-up. The questionnaire used during the first examination addressed demographic characteristics, migration information, disease history, mental health, health perception and health behaviors, women's health issues, and socio-cultural adaptation. The questionnaire used during the second examination was similar to that used at first examination, but also included type of employment in North Korea, physical characteristics at time of entry, and dietary information while in South Korea. The protocol of NORNS study has been previously reported in detail [18]. In the present study, we analyzed the data of 139 NKRs who participated in first and second examinations between 2012 and 2015. The study protocol was approved by the institutional review board of Anam Hospital of Korea University (No. ED08023).
In addition, the data of 417 age and sex matched South Korean controls was randomly selected from Korea National Health and Nutrition Survey Examination (KNHANES). KNHANES is a nationally representative survey on health and nutrition indicators and includes questionnaires, an interview, a dietary assessment, and a clinical examination [19202122].

Measures

General characteristics of NKRs included date of entry into South Korea, marital status, number of family members, education level, current occupation, and household income. North Korean education levels were reclassified to match those of the South Korean education system. Similarly, the general characteristics of South Koreans, which included number of family members, marital status, education level, economic activity status, and household income, were extracted from KNHANES.
Food security statuses in North Korea, transient countries, and in South Korea were examined using responses to a question in KNHANES regarding food situations during the previous 12 months: The four possible responses were; “All my family members were able to eat various foods that we wanted in sufficient amounts”, “All my family members were able to eat foods that we wanted in sufficient amounts, but choice was limited”, “We sometimes did not have enough food due to economic difficulties”, and “We frequently did not have enough food due to economic difficulties.” This question was chosen specifically to enable comparisons between NKRs and SKCs.
Participants were asked to recall their food security statuses while in North Korea and in transient countries and answer the question above in the questionnaire. Their current status of food security in South Korea was also examined using the same question.
Dietary behavior data were collected using a questionnaire based on the KNHANES questionnaire created for the present study. This questionnaire addressed dietary habits and food security in North Korea, transit countries, and in South Korea. The questionnaire was self-administered and participants were assisted by trained research staff. The specific variables of dietary behaviors addressed were; frequency of skipping breakfast, lunch, and dinner, frequency of eating out, eating breakfast, lunch, and dinner with family, nutrition education and counseling experience, and nutrition label recognition and utilization. Data on the dietary behaviors of SKCs were obtained from KNHANES.
Meal skipping was examined by asking participants whether they had eaten meals the previous day. The question on eating with family members in KNHANES was changed in 2013, and thus, responses after 2013 were re-categorized to match the previous categorization. Nutrition education and counseling experience were determined by asking whether any nutrition education or counseling had been received during the previous year. Nutrition label recognition and utilization were investigated by asking whether NKRs knew what a nutrition label was and whether they used nutrition labels when selecting food. The utilization question was asked if participants knew what a nutrition label was.
Nutrient intake assessments were conducted using a 24-hr recall method by face-to-face interview with trained research staff. Food models and food pictures were used to improve the accuracy of dietary recalls. Energy and nutrient intakes were calculated using CAN Pro ver. 5.0 developed by the Korean Nutrition Society. 2015 Dietary Reference Intakes for Koreans (KDRIs) were used as reference values [23]. Energy intakes were compared with estimated energy requirements (EERs), and other nutrient intakes were compared with recommended nutrient intakes (RNIs) or adequate intakes (AIs, when RNIs were unavailable). Average daily intakes and percentages of 2015 KDRIs for energy, protein, calcium, phosphorus, iron, sodium, potassium, vitamin A, thiamine, riboflavin, niacin, and vitamin C were also examined.
In addition, we determined the proportions of participants with deficient intakes and with overconsumption. Deficient intake was defined as simultaneously having an energy intake of < 75% of EER, calcium, iron, vitamin A, riboflavin, and vitamin C intakes below Estimated Average Requirements (EARs), and a fat energy intake below 15% of total daily energy intake, which is the lower limit of the adult fat energy intake acceptable distribution range (AMDR). Overconsumption was defined as a total energy intake of > 125% of EER and an energy from fat of > 30% of totally daily energy intake (the upper limit for adult fat energy AMDR). These definitions were also used in KNHANES reports [20212223].
Diet quality was examined using nutrition quality index (NQIs), which reflected individual differences in energy consumption level [24]. NQI provides a measure of nutrient intake per 1,000 kcal, and thus, eliminate variations arising from different energy consumption levels. NQIs were calculated for protein, calcium, iron, vitamin A, vitamin B1, vitamin B2, and niacin.

Analysis

Statistical analysis was performed using IBM SPSS ver. 23.0 (IBM SPSS Statistics). Categorical variables, such as general participant characteristics, dietary behaviors, and food security, were expressed as frequencies and percentages, and significance was determined using the Chi-squared test and Fisher's exact test. Continuous variables, such as average daily nutrient intake, were expressed as means and standard deviations, and the significances of differences were determined using the independent sample t-test. Statistical significance was accepted for two-sided P values of < 0.05.
Initially, length of stay was viewed as an important independent factor of dietary behavior and nutrient intake, but no significant association was found. Therefore, only comparison results between NKRs and SKCs are presented here.

RESULTS

General participant characteristics

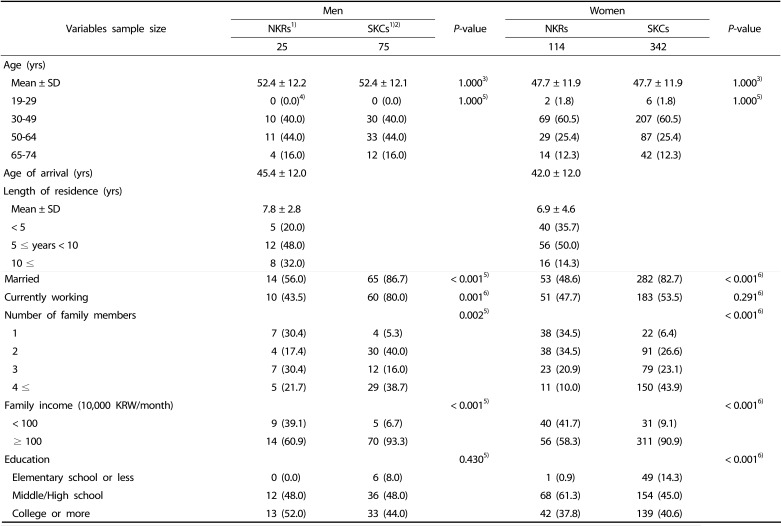
General participant characteristics are shown in Table 1. More NKR women (82%) participated in this study than men. The average ages of NKR men and women were 52 and 47.7 years, respectively, and most of the participants were adults over 30 years old. Average duration of residence in South Korea was 7.8 years for men and 6.9 years for women. Significantly fewer NKR men (56.0%) and women (48.6%) were married than SKC men and women (86.7% and 82.7%, respectively) (P < 0.001). More NKRs tended to live alone and had significantly fewer family members than SKCs regardless of sex (men P = 0.002, women P < 0.001). Significantly fewer NKR men (43.5%) than SKC men (80%) were employed (P = 0.002), and NKRs earned less than SKCs (P < 0.001).

Food security

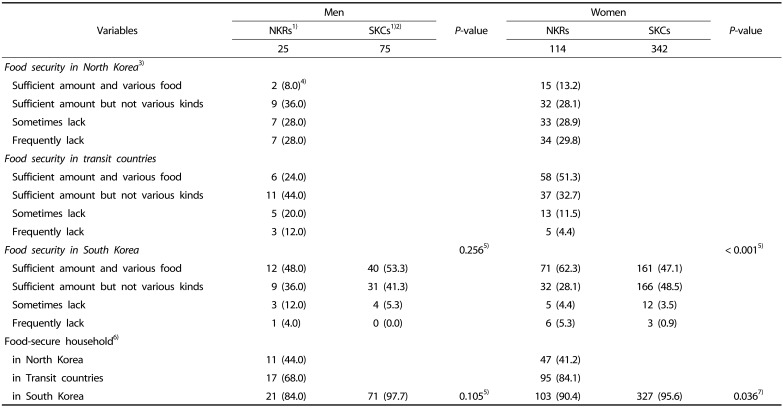
Food security of NKRs increased on moving from North Korea to transient countries and to South Korea for men and women (Table 2). However, a significant difference in food security status was observed between NKR women and SKC women (P < 0.001). Significantly more SK women (95.6%) were food secure than NKR women (90.4%) (P = 0.036).

Dietary behaviors

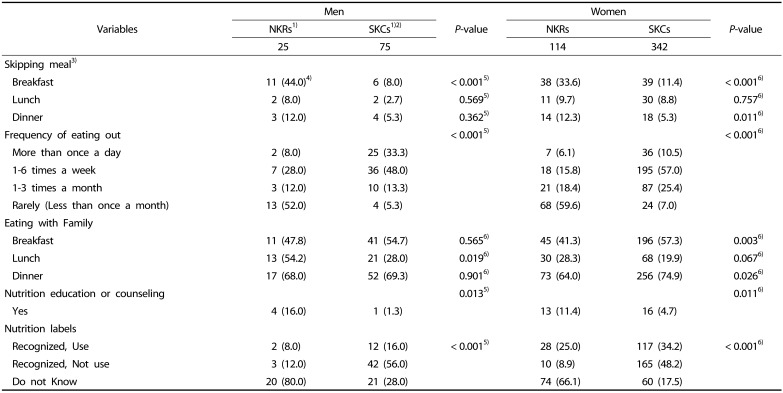
Dietary behaviors are presented in Table 3. Breakfast skipping was significantly more frequent among NKR men (44.0%) and women (33.6%) than among SKC men and women (8.0% and 11.4%, respectively) (P < 0.001). Further analyses on breakfast skipping among NKRs revealed men (OR = 2.85, P = 0.041) and individuals living alone (OR = 3.286, P = 0.006) were more likely to skip breakfast and that older individuals (OR = 0.281, P = 0.005) were less likely to do so. While no significant differences were observed for lunch skipping, dinner skipping was significantly more frequent among NKR women (12.3%) than SKC women (5.3%) (P = 0.011). Eating-out was significantly less frequent among NKR men and women than among SKCs (P < 0.001); 52.0% of NKR men and 59.6% of NKR women reported eating-out less than once a month. Patterns of eating with family differed by sex. NKR women ate breakfast and dinner with family significantly less frequently than SK women (P = 0.003 and P = 0.026, respectively), while NKR men ate lunch with family significantly more frequently than SKC men (P = 0.019). More NKR men and women reported having received nutrition education and counseling than SKC men and women (P = 0.013 and P = 0.011, respectively). More NKRs reported not knowing about nutrition labels, but those that knew tended to use nutrition labels more frequently than SKCs (P < 0.001).

Energy and Nutrient Intakes

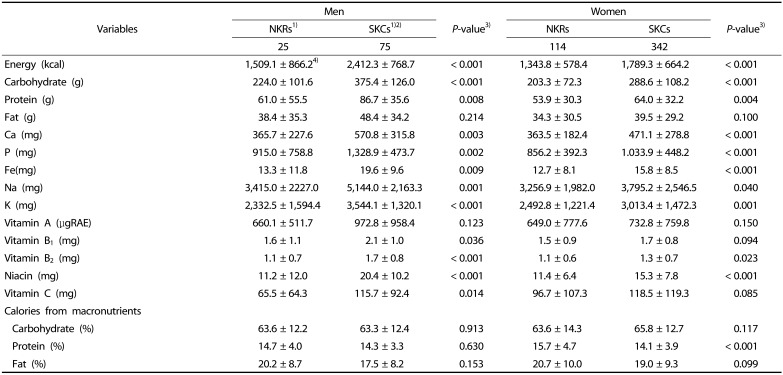
Intakes of energy and most nutrients were significantly differed between NKRs and SKCs. NKRs reporting less intake than SKCs with the exceptions of fat and vitamin A intake for both men and women and vitamin B1 and C intake for women (Table 4). NKR women (15.7%) obtained a greater proportion of energy from protein than SKC women (14.1%) (P < 0.001), whereas proportions of energy obtained from carbohydrate and fat were not different.

Energy and Nutrient Intakes as compared with KDRI

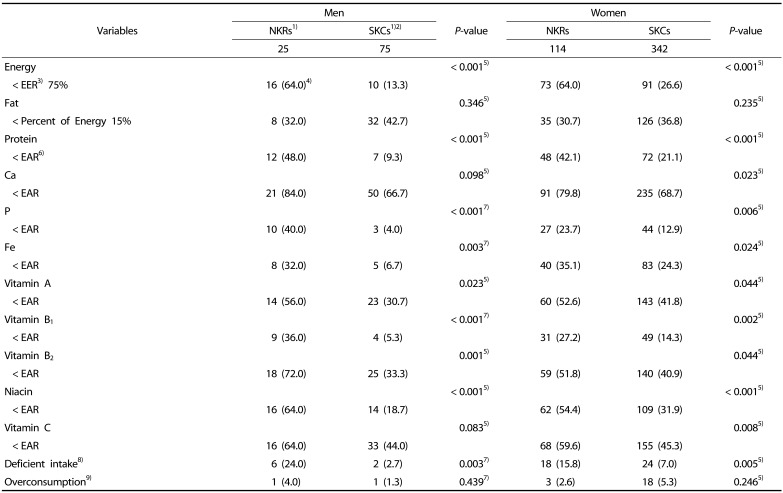
Table 5 shows proportions of NKRs and SKCs that consumed less energy and nutrients than levels recommended by the KDRI (2015). The proportion of participants who obtained energy from fat at < 15% of total daily energy intake was the only variable that did not differ significantly between NKRs and SKCs. More NKR women consumed consistently and significantly lower energy and nutrients than EER and EAR requirements than SK women. More NKR men consumed lower than recommended levels of energy and nutrients than SKC men, but no significant difference was found between NKR men and SKC men in terms of calcium and vitamin C intakes. Overconsumption did not differ significantly between NKRs and SKCs, but deficient intake was significantly more prevalent among NKRs (24.0% vs 2.7% for men and 21.9% vs. 8.5% for women, respectively).

NQI

For most nutrients NQIs were > 1, but neither NKRs nor SKCs achieved this level for calcium (Table 6). No significant differences were found between NKR men and SKC men, except for niacin, for which the NQI was significantly lower for NKR men (P = 0.004). In contrast, NKR women had significantly higher NQIs for protein (P < 0.001), vitamin B2 (P = 0.006), and phosphorus (P = 0.001) than SKC women.

DISCUSSION

This study compared the food security statuses, dietary behaviors, and energy and nutrient intake statuses of adult NK refugees living in South Korea with those of age and sex matched South Korean controls. Food security status improved after leaving North Korea to a transit country and again on moving to South Korea, but NKR women still had a significantly lower food security status than SK women. In general, NKRs exhibited higher frequencies of negative dietary behaviors than SKCs, that is, higher meal skipping rates and fewer meals with family, and were less aware of nutrition labels. Frequency of eating-out was especially lower among NKRs, and NKRs consistently and significantly consumed less energy and nutrients than SKCs; however, nutritional quality of diets was better for NKR women than SKC women.
Dietary behaviors of immigrants and refugees tend toward those of natives in host countries to varying rates and extents [12]. Immigrants and refugees may also try to imitate the diets of affluent individuals in their homelands. NKRs appeared to have different meal regularities and eating-out behaviors, and ate meals less regularly than SKCs and skipped breakfast three times more often, which concurs with previous findings [525]. These high meal skipping rates may be related to the significantly higher proportion of single-person households among NKRs (30.4% for men and 34.5% for women) than among SKCs (5.3% for men and 6.4% for women) (P = 0.002 and P < 0.001, respectively), as others have reported that single-person households have higher breakfast skipping rates than multi-person households regardless of age [272829]. Thus, the high breakfast skipping rate of NKRs may have more to do with socioeconomic factors other than being a refugee or North Korean.
More than 50% of NKRs responded that they rarely eat out, whereas other authors have reported increasing eating-out trends among immigrants [1678]. Income tends to dictate eating-out trends across socioeconomic statuses [29], and income levels among NKRs in the present study were very low; 39.1% of men and 41.7% of women reported household monthly incomes of < $1,000 per month. Furthermore, the strongest driver of eating out among South Koreans in their 30s is socialization or dating and for South Koreans in their 40s eating out is a family event [30], but only 20% of NKRs participated in religious, friendship, community, or leisure group activities according to the 2016 NKRs social integration survey [31]. Furthermore, Moon [32] reported that NKRs prefer passive leisure activities like watching TV, playing a computer game, or relaxing, which probably contributed to the observed low frequency of eating out.
Immigrants and refugees moving to more affluent societies tend to consume more high energy density, processed, and animal foods and less vegetables and whole wheat [12]. This transition, along with higher eating-out rates, would increase energy, fat, and other chronic diseases-related nutrient intakes [34]. However, NKRs that participated in the present study deviated from these trends. Rather we found general inadequacy of energy and nutrient intakes with low average energy intake (1,509 kcal for men and 1,344 kcal for women) and higher proportions (30–80%) with nutrient intakes less than EAR values. These low intake levels may be associated with the above-mentioned meal skipping behavior and greater food insecurity, and similar findings have been reported for other immigrant and refugee populations in South Korea [3334]. Despite low energy and nutrient intakes, nutrient quality as determined using NQIs was relatively good and > 1 for most nutrients. Notably, NKR women had a significantly higher mean NQIs than SK women for protein, phosphorus, and vitamin B2. It may be that the low eating-out rate contributed to this increase in nutrient quality, as foods consumed outside homes have been reported to contain more energy and lower levels of micronutrients [35].
This study had several limitations. First, the total number of NK refugees included was relatively small, which limited statistical power. Nevertheless, statistical power was sufficient to enable significant findings. Second, random sampling of the NKR population was not possible as the list of NK refugees in South Korea is classified for security reasons. However, characteristics of NKRs, such as sex ratio, age, and geographical region of origin, were similar to those found in an investigation of North Korean refugee settlement status carried out by the Korea Hana Foundation in 2014 [31]. Third, we collected 24-hr recall data for one day only, and thus, comparisons were made at the group level and not at the individual level. We tried to duplicate the 24-hr recall method used in KNHANES as much as possible by repeated training of our research team, utilizing similar recall formats, and using visual aids. Nonetheless, the 24-hr recall method is sensitive to researchers, and the use of the fact that different research teams for conducting 24-hr recalls for NKRs in the present study, and for SKCs in KNHANES may have affected nutrient intake data. Forth, the food security status questions put to NKRs addressed the distant past, but they were able to complete these questions without difficulty because the food shortage experiences were still vivid. Most importantly, a lack of dietary data at the time of entry to South Korea prevented further analyses of dietary acculturation, though the findings of the present study provide baseline data on the effects of acculturation on diets.
Despite these limitations, this study is one of the few to report food security, dietary behaviors, and nutrient intakes of NKRs. We found NKRs exhibited more breakfast and dinner skipping and lower levels of eating-out than SKCs. In addition, although NKRs had lower energy and nutrient intakes, the nutrient qualities of their diets were better than those of SKCs. These results show that nutrition intervention based on how to enjoy more diverse diets while maintaining nutrient quality would be helpful and effective among NKRs. Furthermore, such nutrition intervention should consider ways to increase intake levels without increasing the risks of obesity or chronic diseases. Detailed qualitative research on the food choices of NK refugees would be helpful for the development of such nutrition intervention programs for NK refugees [3637].

ACKNOWLEDGMENTS

The authors thank all North Korean refugees that participated in the study and the undergraduates that helped during data collection.

Notes

This study was supported by Inha Faculty Research Grant.

CONFLICT OF INTEREST: The authors declare no potential conflicts of interest.

References

1. Satia JA. Dietary acculturation and the nutrition transition: an overview. Appl Physiol Nutr Metab. 2010; 35:219–223. PMID: 20383236.
2. Lee SK, Sobal J, Frongillo EA Jr. Acculturation, food consumption, and diet-related factors among Korean Americans. J Nutr Educ. 1999; 31:321–330.
crossref
3. Bermúdez OI, Falcón LM, Tucker KL. Intake and food sources of macronutrients among older Hispanic adults: association with ethnicity, acculturation, and length of residence in the United States. J Am Diet Assoc. 2000; 100:665–673. PMID: 10863569.
4. Lee SK, Sobal J, Frongillo EA Jr. Acculturation and dietary practices among Korean Americans. J Am Diet Assoc. 1999; 99:1084–1089. PMID: 10491677.
crossref
5. Pan YL, Dixon Z, Himburg S, Huffman F. Asian students change their eating patterns after living in the United States. J Am Diet Assoc. 1999; 99:54–57. PMID: 9917732.
crossref
6. Lee SK. Acculturation, meal frequency, eating-out, and body weight in Korean Americans. Nutr Res Pract. 2008; 2:269–274. PMID: 20016729.
crossref
7. Ayala GX, Baquero B, Klinger S. A systematic review of the relationship between acculturation and diet among Latinos in the United States: implications for future research. J Am Diet Assoc. 2008; 108:1330–1344. PMID: 18656573.
crossref
8. Kudo Y, Falciglia GA, Couch SC. Evolution of meal patterns and food choices of Japanese-American females born in the United States. Eur J Clin Nutr. 2000; 54:665–670. PMID: 10951516.
crossref
9. Berry JW, Kim U, Minde T, Mok D. Comparative studies of acculturative stress. Int Migr Rev. 1987; 21:491–511.
crossref
10. Lee AR. Changes of the dietary habits of North Koreans before and after the 1990s [doctoral thesis]. Seoul: Ewha Womans University;2009.
11. Duk YJ. Globalization and recent changes to daily life in the Republic of Korea. In : Lewis JB, Sesay A, editors. Korea and Globalization: Politics, Economics and Culture. London: Routledge;2002. p. 10.
12. Korea Centers for Disease Control & Prevention. 2016 Health Behavior and Chronic Disease Statistics. Cheongju: Korea Centers for Disease Control & Prevention;2017.
13. Korea Centers for Disease Control & Prevention. Korea Health Statistics 2016: Korea National Health and Nutrition Examination Survey (KNHANES VII-1). Cheongju: Korea Centers for Disease Control & Prevention;2017.
14. Institute for Unification Education. 2017 Understanding North Korea. Seoul: Institute for Unification Education;2017.
15. Lee JH. Comparison of nutritional status of children in North Korea: analysis of North Korean children's nutrition survey report from 1998 to 2012. KDI Rev the North Korean Econ. 2014; 16:19–30.
16. Park SY. An assessment of the long-term effects of food crisis on children's growth and development in North Korea. Korean Cult Anthropol. 2000; 33:207–240.
17. United Nations in DPR Korea. 2017 DPR Korea: Needs and Priorities. Pyongyang: United Nations in DPR Korea;2017.
18. Lee YH, Lee WJ, Kim YJ, Cho MJ, Kim JH, Lee YJ, Kim HY, Choi DS, Kim SG, Robinson C. North Korean refugee health in South Korea (NORNS) study: study design and methods. BMC Public Health. 2012; 12:172–177. PMID: 22401814.
crossref
19. Ministry of Health and Welfare, Korea Centers for Disease Control & Prevention. The Fifth Korea National Health and Nutrition Examination Survey (KNHANES V-3), 2012. Cheongju: Korea Centers for Disease Control & Prevention;2013.
20. Ministry of Health and Welfare, Korea Centers for Disease Control & Prevention. The Sixth Korea National Health and Nutrition Examination Survey (KNHANES VI-1), 2013. Cheongju: Korea Centers for Disease Control & Prevention;2014.
21. Ministry of Health and Welfare, Korea Centers for Disease Control & Prevention. The Sixth Korea National Health and Nutrition Examination Survey (KNHANES VI-2), 2014. Cheongju: Korea Centers for Disease Control & Prevention;2015.
22. Ministry of Health and Welfare, Korea Centers for Disease Control & Prevention. The Sixth Korea National Health and Nutrition Examination Survey (KNHANES VI-3), 2015. Cheongju: Korea Centers for Disease Control & Prevention;2016.
23. Ministry of Health and Welfare, Korean Nutrition Society. Dietary Reference Intakes for Koreans 2015. Sejong: Ministry of Health and Welfare;2016.
24. Hansen RG, Wyse BW, Sorenson AW. Nutrition Quality Index of Food. Westport (CT): AVI Publishing Co.;1979.
25. Jeong H, Lee SK, Kim SG. Changes in body weight and food security of adult North Korean refugees living in South Korea. Nutr Res Pract. 2017; 11:307–318. PMID: 28765777.
crossref
26. Lee KI, Hwang YJ, Ban HJ, Lim SJ, Jin HJ, Lee HS. Impact of the growth of single-person households on the food market and policy tasks. Korea Rural Economic Institute;2015. 10. Report No. TRKO201600001479.
27. Heo YK, Sim KH. Dietary attitude of single households in metropolitan areas. Korean J Food Nutr. 2016; 29:735–745.
crossref
28. Nam SY. Differences in dietary, nutritional and health status between single-person households and non-single-person households in Korean adults by sex and age group [doctoral thesis]. Incheon: Inha University;2016.
29. Ma H, Huan J, Fuller F, Rozelle S. Getting rich and eating out: consumption of food away from home in urban China. Can J Agric Econ. 2006; 54:101–119.
crossref
30. Yoon HR. The study of dining-out behavior and preference on Korean foods by age groups. Korean J Food Cult. 2005; 20:608–614.
31. Jang IS, Shin HS, Kwon ES, Baek MJ, Yoon SA, Wang YM, Kang MJ, Oh GH, Sung DS. 2016 Investigation on North Korean Refugee Settlement Status. Seoul: Korea HANA Foundation;2016.
32. Moon SI, Song YM, Lee GO. An empirical study on the relation between participation in leisure activities and social adaptability of North Korean refugees. J Tourism Sci. 2015; 29:19–28.
33. Hwang JY, Lee H, Ko A, Han CJ, Chung HW, Chang N. Dietary changes in Vietnamese marriage immigrant women: the KoGES follow-up study. Nutr Res Pract. 2014; 8:319–326. PMID: 24944778.
crossref
34. Yang EJ, Khil JM. Food intake and nutritional status of female marriage immigrants residing in Gwangju, Korea. J Nutr Health. 2016; 49:358–366.
crossref
35. Lachat C, Nago E, Verstraeten R, Roberfroid D, Van Camp J, Kolsteren P. Eating out of home and its association with dietary intake: a systematic review of the evidence. Obes Rev. 2012; 13:329–346. PMID: 22106948.
crossref
36. Sanou D, O'Reilly E, Ngnie-Teta I, Batal M, Mondain N, Andrew C, Newbold BK, Bourgeault IL. Acculturation and nutritional health of immigrants in Canada: a scoping review. J Immigr Minor Health. 2014; 16:24–34. PMID: 23595263.
crossref
37. Patil CL, Hadley C, Nahayo PD. Unpacking dietary acculturation among new Americans: results from formative research with African refugees. J Immigr Minor Health. 2009; 11:342–358. PMID: 18253832.
crossref
Table 1

General characteristics of adult NKRs and SKCs

nrp-14-134-i001
Variables Men P-value Women P-value
NKRs1) SKCs1)2) NKRs SKCs
25 75 114 342
Age (yrs)
 Mean ± SD 52.4 ± 12.2 52.4 ± 12.1 1.0003) 47.7 ± 11.9 47.7 ± 11.9 1.0003)
 19-29 0 (0.0)4) 0 (0.0) 1.0005) 2 (1.8) 6 (1.8) 1.0005)
 30-49 10 (40.0) 30 (40.0) 69 (60.5) 207 (60.5)
 50-64 11 (44.0) 33 (44.0) 29 (25.4) 87 (25.4)
 65-74 4 (16.0) 12 (16.0) 14 (12.3) 42 (12.3)
Age of arrival (yrs) 45.4 ± 12.0 42.0 ± 12.0
Length of residence (yrs)
 Mean ± SD 7.8 ± 2.8 6.9 ± 4.6
 < 5 5 (20.0) 40 (35.7)
 5 ≤ years < 10 12 (48.0) 56 (50.0)
 10 ≤ 8 (32.0) 16 (14.3)
Married 14 (56.0) 65 (86.7) < 0.0015) 53 (48.6) 282 (82.7) < 0.0016)
Currently working 10 (43.5) 60 (80.0) 0.0016) 51 (47.7) 183 (53.5) 0.2916)
Number of family members 0.0025) < 0.0016)
 1 7 (30.4) 4 (5.3) 38 (34.5) 22 (6.4)
 2 4 (17.4) 30 (40.0) 38 (34.5) 91 (26.6)
 3 7 (30.4) 12 (16.0) 23 (20.9) 79 (23.1)
 4 ≤ 5 (21.7) 29 (38.7) 11 (10.0) 150 (43.9)
Family income (10,000 KRW/month) < 0.0015) < 0.0016)
 < 100 9 (39.1) 5 (6.7) 40 (41.7) 31 (9.1)
 ≥ 100 14 (60.9) 70 (93.3) 56 (58.3) 311 (90.9)
Education 0.4305) < 0.0016)
 Elementary school or less 0 (0.0) 6 (8.0) 1 (0.9) 49 (14.3)
 Middle/High school 12 (48.0) 36 (48.0) 68 (61.3) 154 (45.0)
 College or more 13 (52.0) 33 (44.0) 42 (37.8) 139 (40.6)

1)NKRs, North Korean Refugees; SKCs, South Koreans controls

2)2012–2015 Korean National Health and Nutrition Examination Survey

3)Student's T-Test

4)N (%)

5)Fisher's exact test

6)Chi square-test

Table 2

Food security in North Korea, in transit countries, and in South Korea by sex among adult NKRs and SKCs

nrp-14-134-i002
Variables Men P-value3) Women P-value3)
NKRs1) SKCs1)2) NKRs SKCs
25 75 114 342
Food security in North Korea3)
 Sufficient amount and various food 2 (8.0)4) 15 (13.2)
 Sufficient amount but not various kinds 9 (36.0) 32 (28.1)
 Sometimes lack 7 (28.0) 33 (28.9)
 Frequently lack 7 (28.0) 34 (29.8)
Food security in transit countries
 Sufficient amount and various food 6 (24.0) 58 (51.3)
 Sufficient amount but not various kinds 11 (44.0) 37 (32.7)
 Sometimes lack 5 (20.0) 13 (11.5)
 Frequently lack 3 (12.0) 5 (4.4)
Food security in South Korea 0.2565) < 0.0015)
 Sufficient amount and various food 12 (48.0) 40 (53.3) 71 (62.3) 161 (47.1)
 Sufficient amount but not various kinds 9 (36.0) 31 (41.3) 32 (28.1) 166 (48.5)
 Sometimes lack 3 (12.0) 4 (5.3) 5 (4.4) 12 (3.5)
 Frequently lack 1 (4.0) 0 (0.0) 6 (5.3) 3 (0.9)
Food-secure household6)
 in North Korea 11 (44.0) 47 (41.2)
 in Transit countries 17 (68.0) 95 (84.1)
 in South Korea 21 (84.0) 71 (97.7) 0.1055) 103 (90.4) 327 (95.6) 0.0367)

1)NKRs, North Korean Refugees; SKCs, South Koreans controls

2)2012–2015 Korean National Health and Nutrition Examination Survey

3)During the last year “All of my family members were able to eat various the foods that we wanted to eat in sufficient amounts”, “All of my family members were able to eat the foods that we wanted in sufficient amounts, but food choice was restricted”, “We sometimes lacked food due to economic difficulties”, “We frequently lacked food due to economic difficulties”

4)N (%)

5)Fisher's exact test

6)Proportion that answered (“All of my family members were able to eat various foods in sufficient amounts”) + (“All of my family members were able to eat sufficient amounts, but food choice was restricted”)

7)Chi square-test

Table 3

Dietary behaviors by sex among adult NKRs and SKCs

nrp-14-134-i003
Variables Men P-value Women P-value
NKRs1) SKCs1)2) NKRs SKCs
25 75 114 342
Skipping meal3)
 Breakfast 11 (44.0)4) 6 (8.0) < 0.0015) 38 (33.6) 39 (11.4) < 0.0016)
 Lunch 2 (8.0) 2 (2.7) 0.5695) 11 (9.7) 30 (8.8) 0.7576)
 Dinner 3 (12.0) 4 (5.3) 0.3625) 14 (12.3) 18 (5.3) 0.0116)
Frequency of eating out < 0.0015) < 0.0016)
 More than once a day 2 (8.0) 25 (33.3) 7 (6.1) 36 (10.5)
 1-6 times a week 7 (28.0) 36 (48.0) 18 (15.8) 195 (57.0)
 1-3 times a month 3 (12.0) 10 (13.3) 21 (18.4) 87 (25.4)
 Rarely (Less than once a month) 13 (52.0) 4 (5.3) 68 (59.6) 24 (7.0)
Eating with Family
 Breakfast 11 (47.8) 41 (54.7) 0.5656) 45 (41.3) 196 (57.3) 0.0036)
 Lunch 13 (54.2) 21 (28.0) 0.0196) 30 (28.3) 68 (19.9) 0.0676)
 Dinner 17 (68.0) 52 (69.3) 0.9016) 73 (64.0) 256 (74.9) 0.0266)
Nutrition education or counseling 0.0135) 0.0116)
 Yes 4 (16.0) 1 (1.3) 13 (11.4) 16 (4.7)
Nutrition labels
 Recognized, Use 2 (8.0) 12 (16.0) < 0.0015) 28 (25.0) 117 (34.2) < 0.0016)
 Recognized, Not use 3 (12.0) 42 (56.0) 10 (8.9) 165 (48.2)
 Do not Know 20 (80.0) 21 (28.0) 74 (66.1) 60 (17.5)

1)NKRs, North Korean Refugees; SKCs, South Koreans controls

2)2012–2015 Korean National Health and Nutrition Examination Survey

3)Skipping meal rates were calculated using 24-hr recall 1-day data

4)N (%)

5)Fisher's exact test

6)Chi square-test

Table 4

Average intakes of energy and nutrients by sex among adult NKRs and SKCs

nrp-14-134-i004
Variables Men P-value3) Women P-value3)
NKRs1) SKCs1)2) NKRs SKCs
25 75 114 342
Energy (kcal) 1,509.1 ± 866.24) 2,412.3 ± 768.7 < 0.001 1,343.8 ± 578.4 1,789.3 ± 664.2 < 0.001
Carbohydrate (g) 224.0 ± 101.6 375.4 ± 126.0 < 0.001 203.3 ± 72.3 288.6 ± 108.2 < 0.001
Protein (g) 61.0 ± 55.5 86.7 ± 35.6 0.008 53.9 ± 30.3 64.0 ± 32.2 0.004
Fat (g) 38.4 ± 35.3 48.4 ± 34.2 0.214 34.3 ± 30.5 39.5 ± 29.2 0.100
Ca (mg) 365.7 ± 227.6 570.8 ± 315.8 0.003 363.5 ± 182.4 471.1 ± 278.8 < 0.001
P (mg) 915.0 ± 758.8 1,328.9 ± 473.7 0.002 856.2 ± 392.3 1.033.9 ± 448.2 < 0.001
Fe(mg) 13.3 ± 11.8 19.6 ± 9.6 0.009 12.7 ± 8.1 15.8 ± 8.5 < 0.001
Na (mg) 3,415.0 ± 2227.0 5,144.0 ± 2,163.3 0.001 3,256.9 ± 1,982.0 3,795.2 ± 2,546.5 0.040
K (mg) 2,332.5 ± 1,594.4 3,544.1 ± 1,320.1 < 0.001 2,492.8 ± 1,221.4 3,013.4 ± 1,472.3 0.001
Vitamin A (μgRAE) 660.1 ± 511.7 972.8 ± 958.4 0.123 649.0 ± 777.6 732.8 ± 759.8 0.150
Vitamin B1 (mg) 1.6 ± 1.1 2.1 ± 1.0 0.036 1.5 ± 0.9 1.7 ± 0.8 0.094
Vitamin B2 (mg) 1.1 ± 0.7 1.7 ± 0.8 < 0.001 1.1 ± 0.6 1.3 ± 0.7 0.023
Niacin (mg) 11.2 ± 12.0 20.4 ± 10.2 < 0.001 11.4 ± 6.4 15.3 ± 7.8 < 0.001
Vitamin C (mg) 65.5 ± 64.3 115.7 ± 92.4 0.014 96.7 ± 107.3 118.5 ± 119.3 0.085
Calories from macronutrients
 Carbohydrate (%) 63.6 ± 12.2 63.3 ± 12.4 0.913 63.6 ± 14.3 65.8 ± 12.7 0.117
 Protein (%) 14.7 ± 4.0 14.3 ± 3.3 0.630 15.7 ± 4.7 14.1 ± 3.9 < 0.001
 Fat (%) 20.2 ± 8.7 17.5 ± 8.2 0.153 20.7 ± 10.0 19.0 ± 9.3 0.099

1)NKRs, North Korean Refugees; SKCs, South Koreans controls

2)2012–2015 Korean National Health and Nutrition Examination Survey

3)Student's T-Test

4)Mean ± SD

Table 5

Energy and nutrient intake levels by sex among adult NKRs and SKCs

nrp-14-134-i005
Variables Men P-value Women P-value
NKRs1) SKCs1)2) NKRs SKCs
25 75 114 342
Energy < 0.0015) < 0.0015)
 < EER3) 75% 16 (64.0)4) 10 (13.3) 73 (64.0) 91 (26.6)
Fat 0.3465) 0.2355)
 < Percent of Energy 15% 8 (32.0) 32 (42.7) 35 (30.7) 126 (36.8)
Protein < 0.0015) < 0.0015)
 < EAR6) 12 (48.0) 7 (9.3) 48 (42.1) 72 (21.1)
Ca 0.0985) 0.0235)
 < EAR 21 (84.0) 50 (66.7) 91 (79.8) 235 (68.7)
P < 0.0017) 0.0065)
 < EAR 10 (40.0) 3 (4.0) 27 (23.7) 44 (12.9)
Fe 0.0037) 0.0245)
 < EAR 8 (32.0) 5 (6.7) 40 (35.1) 83 (24.3)
Vitamin A 0.0235) 0.0445)
 < EAR 14 (56.0) 23 (30.7) 60 (52.6) 143 (41.8)
Vitamin B1 < 0.0017) 0.0025)
 < EAR 9 (36.0) 4 (5.3) 31 (27.2) 49 (14.3)
Vitamin B2 0.0015) 0.0445)
 < EAR 18 (72.0) 25 (33.3) 59 (51.8) 140 (40.9)
Niacin < 0.0015) < 0.0015)
 < EAR 16 (64.0) 14 (18.7) 62 (54.4) 109 (31.9)
Vitamin C 0.0835) 0.0085)
 < EAR 16 (64.0) 33 (44.0) 68 (59.6) 155 (45.3)
Deficient intake8) 6 (24.0) 2 (2.7) 0.0037) 18 (15.8) 24 (7.0) 0.0055)
Overconsumption9) 1 (4.0) 1 (1.3) 0.4397) 3 (2.6) 18 (5.3) 0.2465)

1)NKRs, North Korean Refugees; SKCs, South Koreans controls

2)2012–2015 Korean National Health and Nutrition Examination Survey

3)EER: Estimated Energy Requirements

4)N (%)

5)Chi square-test

6)EAR: Estimates Average Requirements

7)Fisher's exact test

8)Deficient intake: energy intake < 75% EER (Estimated Energy Requirement) and intakes of calcium, iron, vitamin A, riboflavin, and Vitamin C < EAR (Estimated Average Requirement)

9)Overconsumption: intake of energy > 125% EER and proportion of fat energy > 30%

Table 6

Nutrition quality indices1) by sex for adult NKRs and SKCs

nrp-14-134-i006
Variables Men P-value4) Women P-value4)
NKRs2) SKCs2)3) NKR SKCs
25 75 114 342
Protein 1.4 ± 0.45) 1.4 ± 0.3 0.644 1.5 ± 0.4 1.3 ± 0.4 < 0.001
Ca 0.7 ± 0.3 0.7 ± 0.4 0.942 0.7 ± 0.4 0.7 ± 0.3 0.216
P 1.8 ± 0.5 1.8 ± 0.4 0.848 1.7 ± 0.5 1.5 ± 0.4 0.001
Fe 1.9 ± 0.7 1.9 ± 1.0 0.908 1.6 ± 0.8 1.5 ± 1.0 0.529
Vitamin A 1.5 ± 1.7 1.3 ± 1.5 0.570 1.4 ± 2.0 1.2 ± 1.2 0.118
Vitamin B1 2.2 ± 1.6 1.7 ± 0.6 0.134 1.8 ± 0.7 1.7 ± 1.1 0.103
Vitamin B2 1.0 ± 0.3 1.1 ± 0.5 0.816 1.4 ± 0.6 1.2 ± 0.5 0.006
Niacin 0.9 ± 0.4 1.2 ± 0.4 0.004 1.1 ± 0.5 1.1 ± 0.4 0.843
Vitamin C 1.0 ± 0.8 1.1 ± 0.8 0.760 1.4 ± 1.5 1.2 ± 1.2 0.336

1)Nutrition Quality Index: Nutrient intake amount per 1,000 kcal/RNI (Recommended Nutrient Intake) per 1,000 kcal

2)NKRs, North Korean Refugees; SKCs, South Koreans controls

3)2012–2015 Korean National Health and Nutrition Survey

4)Student's T-Test

5)Mean ± SD

TOOLS
Similar articles