

 PDF
PDF ePub
ePub Citation
 Print
Print


INTRODUCTION
Previous studies have reported that overconsumption of simple sugars, especially sugar-sweetened beverages, is linked to excessive energy intake but less satiety which can cause obesity [1234]. If obesity persists, adipose tissue in the body secretes inflammatory cytokines, such as interleukin 1β (IL-1β), interleukin 6 (IL-6), monocyte chemoattractant protein-1 (MCP-1), and tumor necrosis factor-α (TNF-α) [5]. Such inflammatory responses observed in obesity are reported to increase the risk of type 2 diabetes, hypertriglyceridemia, atherosclerosis, hypertension, and metabolic syndrome [6]. In the regulation of acute inflammatory responses, nuclear factor kappa B (NF-κB) is recognized as a key signaling factor in the regulation of the expressions of inducible nitric oxide synthase (iNOS), a nitric oxide (NO)-producing enzyme, cyclooxygenase-2 (COX-2), and inflammatory cytokines [7].
To limit sugar intake, individuals may seek alternatives to sugar-sweetened beverages and sugar-dense foods. An alternative sweetener may have a sweetness intensity of approximately 200–300 times that of sugar, meaning that a small amount of it can function as a powerful sweetener [8]. Such sweeteners, excluding aspartame, are not metabolized in the body and are excreted. Thus, artificial sweeteners are commonly used as sugar substitutes for weight control and health purposes [9].
Saccharin is Latin for ‘sugar’ and is about 300 times sweeter than sugar. In an animal study in 1977, rats fed with saccharin developed bladder cancer; thus, the safety of saccharin was questioned in the United States and Europe [10]. However, Chowaniec & Hicks [11] reported that Wister rats did not develop any cancer even after saccharin was administered orally at 2 g/kg body weight per day for two years. This amount of saccharin administered to rats was the same as the amount as a human consuming 800 bottles of saccharin-containing beverages daily. In 1993, the World Health Organization (WHO) first announced that saccharin was a safe sweetener for human consumption [12]. Saccharin was excluded from the carcinogen classification published by the International Agency for Research on Cancer in 1999 [13]. In 2000, the US Environmental Protection Agency, as well as agencies in other countries, also delisted saccharin from their hazardous substance category [1213]. Considering the maximum, No Observed Adverse Effect Level (NOAEL), the Joint FAO / WHO Expert Committee on Food Additives reported that the acceptable daily intake of saccharin is 5 mg/kg body weight [1214].
In addition to its function as a sweetener, other metabolic effects of saccharin revealed to date are as follows: reducing metabolic activity in human cancer cell lines [15]; reducing the body stress response in the restraint-stressed rat model [16]; inhibiting endothelial growth factors inducing tumors [17]; lowering blood glucose and insulin in obese or hyperglycemia-induced mice [1819]; and inhibiting mRNA and protein expression levels of iNOS in RAW 264.7 cells [20]. Thus far, there are no reports on the effect of saccharin on inflammation in adipocytes. Thus, this study aimed to investigate the effect of saccharin treatment on inflammatory cytokines in adipocytes and to examine the mechanism related to saccharin's anti-inflammatory action.
Go to : 
MATERIALS AND METHODS
Materials
Dulbecco's modified Eagle's medium (DMEM), bovine serum albumin (BSA), 100 U/mL penicillin, 100 µg/mL streptomycin, trypsin-EDTA, and fetal bovine serum were purchased from WelGENE (WelGENE, Daegu, Korea). HiSenScript™ RH [−] RT PreMix Kit was purchased from iNtRON (iNtRON Biotechnology, INC, Korea) and the X SYBR Green Master Mix was purchased from Applied Biosystems (Foster City, CA, USA). Saccharin, which was obtained from JMC (JMC, Ulsan, Korea), was dissolved in distilled water to create a 1,000 mg/mL stock solution. Western blot analysis antibodies against β-actin were purchased from Cell Signaling Technologies (Danvers, MA, USA). All samples and reagents were purchased from Sigma (St. Louis, MO, USA). Reagents that were not purchased from Sigma have been specified separately.
Cell culture and treatment
The 3T3L-1 mouse preadipocyte cells were purchased from the Korean Cell Line Bank (KCLB, Seoul, Korea). The 3T3L-1 cells were incubated in media containing DMEM (WelGENE, Daegu, Korea), 10% BSA (WelGENE, Daegu, Korea), 100 U/mL penicillin, and 100 µg/mL streptomycin (WelGENE, Daegu, Korea) in a 5% CO2 incubator at 37℃. After reaching a confluence of 70–80%, the cells were washed twice with phosphate-buffered saline (PBS), treated with trypsin-EDTA (WelGENE, Daegu, Korea), and subcultured. The culture medium was changed every 2 days. To differentiate adipocyte precursor cells into adipocytes, cells were cultured in DMEM, 10% FBS, 100 U/mL penicillin, 100 µg/mL streptomycin, and 1 µM Dexamethasone (Dex), 0.5 mM isobuthylmethylxanthine (IBMX).
Cell proliferation and viability assay
The 3-[4,5-dimethylthiazol-2-yl]-2,5-diphenyltetrazolium bromide (MTT; Duchefa Biochemie, Haarlem, Netherlands) assay was performed to investigate the degrees of cell proliferation and viability after adding various concentrations of saccharin. The 3T3-L1 cells were plated at 1.0 × 10⁴ cells/mL in a 24-well plate, and after 4 days of growth to confluence, the cells was treated with culture medium containing Dex, insulin, and IBMX to induce differentiation into adipocytes. After 48 h of culture, adipocytes were treated with saccharin (0, 50, 100, and 200 µg/mL) that was diluted with post differentiation media, and MTT assay was conducted at 0, 24, 48, 96, 144 hours after saccharin treatment. To see the cytotoxicity of LPS, the adipocytes were treated with the saccharin (0, 50, 100, and 200 µg/mL) for 24 h, after which LPS was added and further cultured for 18 h. Cell viability was estimated by MTT assay.
The range of treatment concentrations of saccharin was determined through a preliminary experiment based on a safe dosage of 5 mg/kg bodyweight for humans [3], no cell toxicity from a saccharin treatment of 5 mg/mL in mouse 3T3 cells [4], and no cytotoxicity of saccharin treatment (0–14 mg/mL) in human bone marrow-derived mesenchymal stem cells (MSCs) [5]. Furthermore, the dose of saccharin required to demonstrate its tumorigenic activity is very high (0.1 to 0.001 M in tissue culture or 5% in the diet in animal tests) [3].
For assay performance, the MTT was diluted in PBS to a concentration of 1 mg/mL and the diluted MTT solution was added to each well and the plate incubated at 37℃ in a 5% CO2 incubator. After 2 h, the MTT solution was removed and 0.5 mL of isopropanol was added to each well. Absorbance was measured at 490 nm using an ELISA microplate reader (Infinite 200, Tecan, Grödig, Austria).
Nitric oxide production assay
The concentration of NO was measured to confirm the presence of inflammation in 3T3-L1 cells. After the adipocytes were treated with the saccharin (0–200 µg/mL) and LPS (1 µm/mL), 100 µL of the sample was dispensed into a well of a 96-well plate, mixed with the same amount of Griess reagent, and held at room temperature for 10 min. Absorbance was measured at 540 nm with an ELISA microplate reader (Infinite 200, Tecan, Grödig, Austria).
Western blot assay
The adipocytes, treated with the saccharin and LPS, were washed with ice-cold PBS. The resulting cell pellets were suspended in 1X lysis buffer (Cell Signaling Technology, Danvers, USA) and stored at −70℃ until use. Proteins were quantitated by applying the Bio-Rad protein assay method (Bio-Rad, Munich, Germany), then separated by 8% sodium dodecyl sulfatepolyacrylamide gel electrophoresis) and transferred to a membrane. Antibodies of β-actin, NF-κB, and IκB were diluted to 1:5,000 to 1:10,000 in 5% skim milk or 5% BSA and added to the membrane, which was then left overnight at 4℃ in a shaking machine. Membranes were then washed with 1X TBST (Cell Signaling Technology, Danvers, USA) and allowed to react with anti-mouse or anti-rabbit IgG at room temperature for 2–3 h. After washing with 1X TBST, the membranes were developed with ECL detection reagent (Bio-Rad, Munich, Germany) for 15–60 sec and images developed on X-Omat film (Kodak, Tokyo, Japan). Each protein was compared with a protein marker, and the density of the developed bands was measured by Image J Launcher (National Institutes of Health, MD, USA).
Total RNA isolation Assay
After cells were treated with saccharin with LPS, cells were collected, washed twice with PBS, extracted with 1 mL of TRI reagent and 200 µL of chloroform, and centrifuged at 4℃ and 13,500 r/min for 45 min. The supernatant of each sample was added with 500 µL of isopropanol, followed by centrifugation at 4℃ and 13,500 r/min for 15 min. The resulting pellet was washed with 75% ethanol, dried, and 50 µL of RNase-free dH2O/0.1 mM EDTA were added. RNA purity and concentration were calculated using an ELISA microplate reader (version 6, Tecan, Grödig, Austria).
To convert the RNA sample to cDNA, the extracted RNA in a tube was mixed with Oligo DT and DEPC water to make a total volume of 20 µL and the sample stored at −20℃ until use. To perform real-time PCR, 2 µL of the cDNA sample, 6 µL of nuclease-free water, 10 µL of 2X SYBR Green Master Mix (Applied Biosystems, Foster City, CA, USA), and 1 µL each of the indicated primers (forward/reverse; Table 1) were mixed and reacted under the PCR conditions (reaction for 10 min at 95℃, and development for 15 min at 95℃, 1 min at 60℃, 15 min at 95℃, 1 min at 60℃, and 15 min at 95℃; in total, 40 cycles were performed). Applied Biosystems Step One software (version 2.1; Applied Biosystems, Foster City, CA, USA) was used to assess the product. The data were analyzed by applying the ΔΔCT method. The experiment was repeated three times.
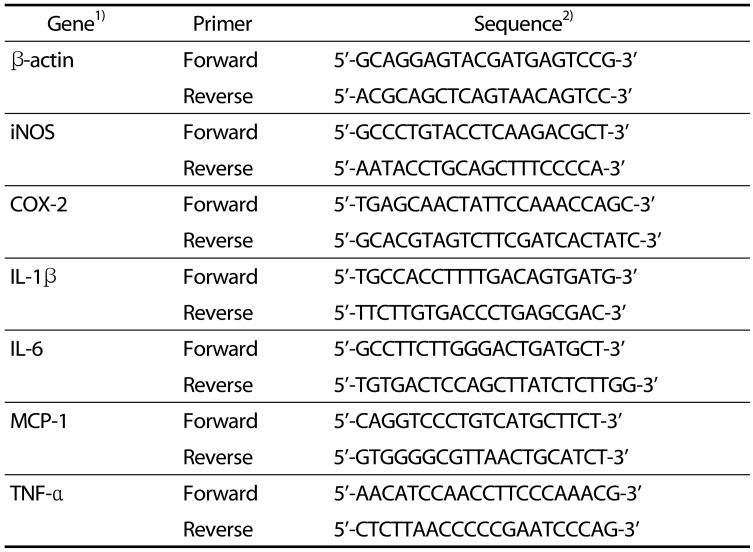
Table 1
Primer sequences used in real-time PCR analysis.
![]()
Statistical analysis
At least three independent repeats of all experiments in this study were performed, and the obtained results were analyzed by using SPSS software (version 23; SPSS, Inc., Chicago, IL, USA). Mean and mean ± standard error (SE) of each group were calculated and compared. After performing an analysis of variance (ANOVA), differences among groups were calculated using Duncan's multiple range test; the significance of a difference was defined at an α level (P-value) of < 0.05.
Go to :
RESULTS
Effect of saccharin on adipocyte proliferation
Saccharin treatment did not significantly affect cell proliferation during the initial 48 h of culture, but with culturing for 96 and 144 h, cell proliferation decreased significantly with an increase in saccharin concentration (P < 0.05) (Fig. 1A). To see the cytotoxicity of LPS, the adipocytes were treated with the saccharin (0, 50, 100, and 200 µg/mL) for 24 h and LPS (1 µm/mL) for an additional 18 hours. MTT assay results showed no significant differences in cell proliferation (Fig. 1B). Therefore, all subsequent experiments were carried out 24 h of incubation after saccharin treatment and an additional 18 h of incubation after LPS treatment.
 | Fig. 1Effect of saccharin on cell proliferation in 3T3-L1 adipocytes.(A) 3T3-L1 cells were plated at a density of 1.0 × 10⁴ cells/mL in a 24 well plate. After 4 days of incubation, the media were replaced with differentiation media to induce differentiation into adipocytes. Obtained adipocytes were then treated with saccharin (0, 50, 100, and 200 µg/mL) for 0, 24, 48, 96, 144 hours, cell viability was estimated by MTT assay. (B) After adipocytes were treated with the saccharin (0, 50, 100, and 200 µg/mL) for 24 h and LPS (1 µm/mL) for a further 18 h, cell viability was estimated by MTT assay. Each bar presents the mean ± SE (n = 3) and different letters indicate significant differences among treatments at P < 0.05 (Duncan's multiple range test).
|
Assay for NO production mRNA expression of iNOS
The NO increase in the group treated with LPS alone was approximately 17.6% greater than that in the group without LPS treatment (control group) (Fig. 2A). Compared to the group treated with LPS alone, NO production in the saccharin-treated group (50, 100, and 200 µg/mL) significantly decreased; 7.5%, 7.5%, and 13.8% decreases, respectively (P < 0.05) (Fig. 2A). The mRNA expression of iNOS, an enzyme producing NO, was significantly higher (46.9%; P < 0.05) in the LPS-treated group than in the control group. However, in the groups co-treated with LPS and 100 µg/mL or 200 µg/mL of saccharin, the expressions of iNOS mRNA were significantly decreased (36.5% and 77.6% decreases, respectively) from that of the control group (P < 0.05) (Fig. 2B).
 | Fig. 2Effect of saccharin on NO production and mRNA expression of iNOS in LPS-stimulated 3T3-L1 adipocytes.3T3-L1 cells were plated at a density of 1.0 × 10⁴ cells/mL in a 24-well plate. After 4 days of incubation, the media were replaced with differentiation media to induce differentiation into adipocytes. After adipocytes were treated with the saccharin (0, 50, 100, and 200 µg/mL) for 24 h and LPS (1 µm/mL) for a further 18 h. (A) Production of nitric oxide (NO) was determined by using Griess reagent. (B) Total mRNA expression of inducible nitric oxide synthase (iNOS) was determined by performing real-time PCR. Each bar presents the mean ± SE (n = 3) and different letters indicate significant differences among treatments at P < 0.05 (Duncan's multiple range test).
|
The protein expression levels of NF-κB and IκB
The effects of saccharin on the protein expressions of NF-κB and IκB are shown in Fig. 3. When LPS was treated alone, the expression of NF-κB was significantly higher (25.9% increase; P < 0.05) than that of the control group. In the groups co-treated with LPS and 100 µg/mL or 200 µg/mL of saccharin, the expressions of NF-κB were significantly lower (12.5 % and 34.4% decreases, respectively) than that in the LPS-treated group (P < 0.05) (Fig. 3A). The expression of IκB protein was significantly lower (34.7% decrease) in the LPS-treated group than in the control group. In the groups co-treated with LPS and 100 µg/mL or 200 µg/mL of saccharin, the protein expressions of IκB were significantly reduced; 20.1% and 30.4%, respectively (P < 0.05) (Fig. 3B).
 | Fig. 3Effect of saccharin on protein expressions of NF-κB and IκB in LPS-stimulated 3T3-L1 adipocytes.3T3-L1 cells were plated at a density of 1.0 × 10⁴ cells/mL in a 24-well plate. After 4 days of incubation, the media were replaced with differentiation media to induce differentiation into adipocytes. After adipocytes were treated with the saccharin (0, 50, 100, and 200 µg/mL) for 24 h and LPS (1 µm/mL) for a further 18 h. (A) The protein expression of nuclear factor kappa B (NF-κB) was measured by western blot analysis. (B) The protein expression of inhibitor κB (IκB) was measured by western blot analysis. Each bar presents the mean ± SE (n = 3) and different letters indicate significant differences among treatments at P < 0.05 (Duncan's multiple range test).
|
mRNA expressions of inducible COX-2
The effect of saccharin on the mRNA expression of COX-2, an enzyme involved in inflammation, is shown in Fig. 4. In the LPS-treated group, COX-2 mRNA expression was significantly higher (82.9% increase) than that of the control group. The COX-2 mRNA expressions in groups co-treated with LPS and saccharin at 50, 100, or 200 µg/mL decreased to 53.5%, 68.6%, and 77.6%, respectively, of the level in the group treated with LPS alone. The COX-2 mRNA expression levels in the saccharin-treated groups decreased in a concentration-dependent manner.
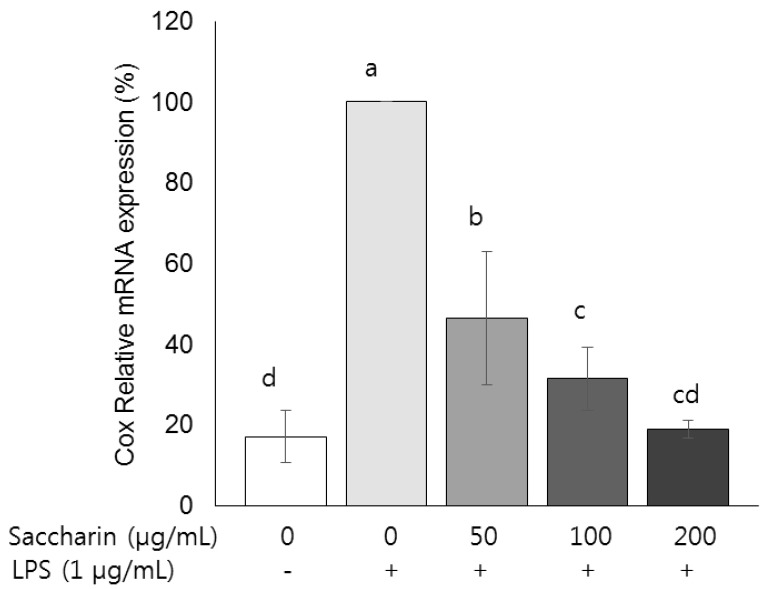 | Fig. 4Effect of saccharin on the mRNA expression of COX-2 in LPS-stimulated 3T3-L1 adipocytes.3T3-L1 cells were plated at a density of 1.0 × 10⁴ cells/mL in a 24-well plate. After 4 days of incubation, the media were replaced with differentiation media to induce differentiation into adipocytes. After adipocytes were treated with the saccharin (0, 50, 100, and 200 µg/mL) for 24 h and LPS (1 µm/mL) for a further 18 h. The mRNA expression of cyclooxygenase-2 (COX-2) was determined by performing real-time PCR. Each bar presents the mean ± SE (n = 3) and different letters indicate significant differences among treatments at P < 0.05 (Duncan's multiple range test).
|
mRNA expression of inflammatory cytokines IL-1β, IL-6, MCP-1, and TNF-α
The mRNA expressions of IL-1β, IL-6, MCP-1, and TNF-α, are shown in Fig. 5. The IL-1β mRNA expression level increased by approximately 59.5% in the LPS-treated group over that in the control. The L-1β mRNA expression levels in the groups co-treated with LPS and 50, 100, or 200 µg/mL of saccharin were reduced by 45.2%, 64.8%, and 65.7%, respectively, compared to that in the group treated with LPS alone, and the decreases were statistically significant (P < 0.05). Similarly, IL-6 mRNA expression increased by about 37.5% in the LPS-treated group compared to the level in the control group. Co-treatment of LPS and 50, 100, or 200 µg/mL of saccharin resulted in significantly lower IL-6 mRNA expression levels (44.4%, 46.9%, and 67.3% decreases, respectively) than that of the LPS-treated group (P < 0.05). Notably, compared to the control group, the MCP-1 mRNA expression level increased by 87.5% in the LPS-treated group. The MCP-1 mRNA expressions in groups co-treated with LPS and saccharin at 50, 100, and 200 µg/mL were significantly decreased (37.7%, 64.2%, and 82.9% lower, respectively) (P < 0.05) from that of the LPS-treated group. Finally, the TNF-α mRNA expression in the LPS-treated group was 46.7% higher than that in the control group. Co-treatment with LPS and saccharin at 50, 100, or 200 µg/mL significantly decreased the TNF-α mRNA expression level from that in the LPS-treated group; lowered by38.9%, 45.3%, and 71.6%, respectively (P < 0.05).
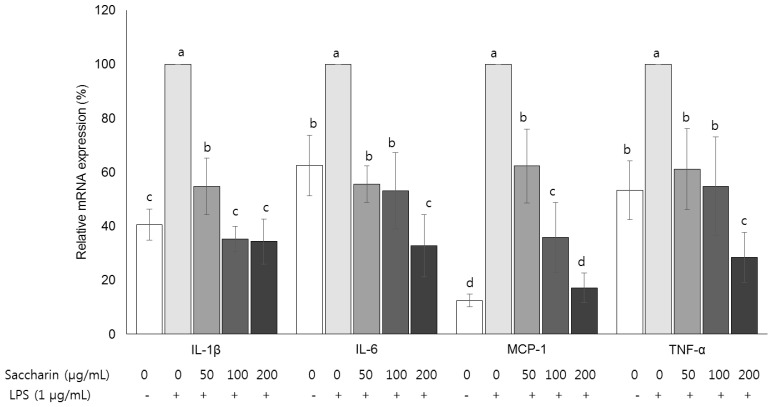 | Fig. 5Effect of saccharin on the mRNA expression of cytokines in LPS-stimulated 3T3-L1 adipocytes.3T3-L1 cells were plated at a density of 1.0 × 10⁴ cells/mL in a 24-well plate. After 4 days of incubation, the media were replaced with differentiation media to induce differentiation into adipocytes. After adipocytes were treated with the saccharin (0, 50, 100, and 200 µg/mL) for 24 h and LPS (1 µm/mL) for a further 18 h. The mRNA expressions of interleukin 1β (IL-1β), interleukin 6 (IL-6), monocyte chemoattractant protein-1 (MCP-1), and tumor necrosis factor-α (TNF-α) were determined by performing real-time PCR. Each bar presents the mean ± SE (n = 3) and different letters indicate significant differences among treatments at P < 0.05 (Duncan's multiple range test).
|
Go to :
DISCUSSION
Overconsumption of sugar is reported to result in inflammation: Fructose induced inflammation in endothelial cells and leaded to an increase in macrophage infiltration into adipocytes, which further caused the release of pro-inflammatory cytokines [2122]. Saccharin, a substitute for sugar, is reported to decrease iNOS mRNA and NO production in a dose-dependent manner in RAW 264.7 cells treated with LPS [20]. However, there are no reports on the effect of saccharin on the expression of inflammatory factors in 3T3-L1 cells. Thus, this study investigated whether saccharin affects NF-κB pathway inflammatory factors in 3T3-L1 cells after inflammation has been induced by LPS.
LPS is characterized, based on the production of various pro-inflammatory agents, as an endotoxin in Gram-negative cell walls [23]. Treatment of preadipocytes with LPS produces an increase in the expression of cytokines in 3T3-L1 cells, leading to inflammation [23]. MTT assays were performed in this study to examine the cytotoxicity of LPS against 3T3-L1 cells. Compared to the control group, there was no statistically significant difference among the groups treated with the saccharin (0, 50, 100, and 200 µg/mL) for 24 h and LPS (1 µm/mL) for a further 18 h (Fig. 1). Therefore, in all subsequent experiments in this study, the LPS treatment time following a 24 h treatment with saccharin was 18 h. The range of saccharin concentrations (0–200 µg/mL) used in this study was based on previous cell research studies and was confirmed through preliminary experiments [456]. Under a previous multiple treatment protocol, repeated doses of low saccharin concentrations of 50–600 µg/mL induced no cytotoxicity [456]. Saccharin treatment (0–14.4 mg/mL) of human bone marrow-derived MSCs for 48 h did not result in any cellular damage or changes in cell viability at any of the tested concentrations [5]. In HeLa cells, the dose of saccharin needed for 50% growth inhibition was 3.5 mg/mL [4]. Moreover, the doses of saccharin required to demonstrate tumorigenic activity were reported to be notably high, that is, 0.1 to 0.001 M in tissue culture or 5% in animal diet tests [4].
In this study, the viability of 3T3-L1 cells treated with saccharin (0–200 ug/mL) did not significant change over the initial 48 h treatment period from that in cells not treated with saccharin (P = 0.70), indicating that 3T3-L1 cells treated with up to 200 ug/mL of saccharin for 24 hours had stable proliferative activity and an absence of toxic effects.
In this study, the levels of NO and iNOS mRNA expression in3T3-L1 cells increased following LPS treatment, confirming that inflammation was induced by LPS treatment. In contrast, co-treatment with LPS and saccharin decreased NO production and iNOS mRNA expression in a concentration-dependent manner (Fig. 2). This suggests that saccharin may be effective in inhibiting inflammation in adipocytes. Excessive secretion of NO induces the production of reactive oxygen species and reactive nitrogen in the cell, resulting in inflammatory reactions such as vasodilation, edema, and pain; moreover, iNOS is an enzyme that induces NO production [24].
We determined that the observed inhibition of iNOS mRNA expression and NO production occurred through inhibition of the NF-κB signaling pathway. In the present study, protein expression of NF-κB increased and protein expression of IκB decreased when treated with LPS alone. When LPS and saccharin were co-treated, protein expression of NF-κB was significantly decreased and protein expression of IκB was significantly increased (Fig. 3). The results of this study indicate that saccharin can inhibit the NF-κB pathway, thereby suppressing iNOS mRNA and NO production. NF-κB is a protein duplex of p50 and p65 that binds to IκB in its inactive state [25]. It has also been reported that when NF-κB is phosphorylated by IKK, it enters the cell nucleus and activates gene transcription of iNOS, inflammatory cytokines, and other inflammatory responses, thereby increasing its expression level [26]. Boonkaewwan and Burodom [27] have reported that co-treatment of stevioside with LPS in Caco-2 cells reduced the protein expression of NF-κB and increased the expression of IκB.
Substances induced by the NF-κB pathway include COX-2 and inflammatory cytokines such as IL-1β, IL-6, MCP-1, and TNF-α [28]. Treatment with saccharin produced a dose-dependent decrease in COX-2 mRNA expression along with a decrease in NF-κB protein expression. These results suggest that saccharin inhibits the activity of the NF-κB pathway, thereby decreasing COX-2 expression (Fig. 4). COX-2 is an enzyme that induces the production of eicosanoids, such as prostaglandin E2 (PGE2), which are regulated by the NF-κB pathway, and PGE2 has been shown to increase capillary permeability and blood flow to produce redness and swelling [28]. A report by Lee et al. [29] indicated that increases in COX-2 protein expression and PGE2 production following LPS treatment were reduced by xylosetaurine treatment.
In this study, the mRNA expressions of IL-1β, IL-6, MCP-1, and TNF-α were increased by LPS treatment but significantly decreased by co-treatment with LPS and saccharin in 3T3-L1 cells (Fig. 5). Overexpressed inflammatory cytokines may infiltrate macrophages and T cells around adipose tissue, leading to endothelial dysfunction, oxidative stress, and inflammation [19]. IL-1β and IL-6 are known to be involved in chronic inflammation associated with obesity [30]. IL-1β secreted by immune cells and adipocytes, such as monocytes and macrophages, produce insulin resistance by damaging pancreatic β cells, whereas IL-6 induces protein synthesis early in the inflammatory response and allows B cells to differentiate into antibody-producing cells [30]. MCP-1 is a typical cytokine secreted from adipocytes and acts on the production and activation of mononuclear leukocytes, vascular endothelium, and glioma cell lines under inflammatory conditions [31]. TNF-α protects the host by inducing neutrophils and monocytes to remove microorganisms in the infected area at physiological concentrations but the expression of TNF-α increases in the obese state with increased secretion of TNF-α inducing various inflammation-related diseases [32].
Various studies have reported on the anti-inflammatory effects of artificial sweeteners functioning through the NF-κB pathway [273334]. Kim et al. [33] showed that treatment with a Stevia leaf extract inhibited NF-κB activity induced by LPS in RAW264.7 cells and that the NF-κB activity inhibition affected iNOS and NO production, as well as PGE2, IL-6, TNF-α, and other cytokines. In animal study, an oral administration of stevioside (10 mg/kg/day, twice a day) for 1 month significantly improved fasting glucose and insulin levels, and those changes were accompanied by decreased expression levels of several inflammatory cytokines in adipose tissue as a result of suppression of the NF-kB signaling pathway in adipose tissue. Similarly, in the study of Boonkaewwan et al. [27], expression of IκB in LPS-treated Caco-2 cells was increased, but the LPS-related increases in the expression of TNF-α, IL-1β, and IL-6 were decreased by treatment with stevioside. The results of those studies are consistent with the results presented herein, suggesting that saccharin significantly reduces the expression levels of several cytokines by down-regulation of NF-κB activation.
Taken collectively, under the experimental conditions, saccharin treatment can inhibit the LPS-induced increase in NF-κB protein expression. As a result, mRNA expressions of iNOS and COX-2 and expressions of inflammatory cytokines such as IL-1β, IL-6, MCP-1, and TNF-α mRNA induced by LPS were inhibited by saccharin, suggesting that saccharin can reduce inflammation via inhibition of the NF-κB pathway.
Go to :
 XML Download