

 PDF
PDF ePub
ePub Citation
 Print
Print


INTRODUCTION
Childhood obesity has become one of the most challenging issues in the 21st century. In 2014, the World Health Organization (WHO) estimated that over 41 million children aged below 5 years were overweight, and almost half of them lived in Asia, including Indonesia [1]. The latest Indonesian data showed that the prevalence of overweight and obese children aged 5–12 years in 2013 were 10.8% and 8.8%, respectively. Meanwhile, the prevalence of overweight among children aged below 5 years decreased from 11.9% in 2013 to 8% in 2018 [23].
The etiology of obesity is multifactorial and complex. Imbalance between energy input and output results in excess energy deposited in adipocytes and subsequent increase in body fat mass. The limited capacity of adipocytes in accommodating excess energy induces adipocyte hypertrophy and hyperplasia, both of which are related to cellular stress and dysfunction. Ultimately, these will result in insulin resistance and an increase in adipocytokine level, free fatty acids, and inflammatory mediators [4].
Leptin, a substantial hormone produced by adipocytes, acts centrally in the hypothalamus to control appetite and increase energy metabolism. The dynamic changes in plasma leptin level are influenced by puberty status, total fat mass, food intake, and energy balance [567]. A previous study suggested that leptin level is probably related to the level of circulating serum lipid due to its important role in multiple metabolic pathways [8].
Leptin receptor is ubiquitously found in the human body. There are several isoforms of leptin receptors that have been identified, including Ob-Ra, Ob-Rb, Ob-Rc, Ob-Rd, and Ob-Re [58]. The main leptin binding protein in human plasma is called circulating soluble leptin receptor (CSLR/sOB-R), which plays a crucial role in reducing leptin clearance rate and inhibiting the attachment of leptin to a membrane receptor [910]. The half-life of leptin-CSLR is 21 times longer than that of free circulating leptin [11]. Free leptin index (FLI), the ratio of leptin and CSLR levels, represents the number of active leptin moleculs acting in the hypothalamus. Leptin resistance is common in obese individuals, which is characterized by high concentration of free leptin, but both appetite and energy metabolism are poorly controlled [910].
Obesity contributes to the development of chronic metabolic diseases at a younger age. Currently, there are a few studies on leptin regulation and its determinants in obese children. In this study, we aimed to investigate the clinical and metabolic determinants of CSLR and FLI in obese male children. We restricted the study participants to prepubertal male children to prevent bias due to the effects of puberty and sexual hormones. Women have higher leptin levels but lower CSLR levels. While leptin level reaches its peak in prepubertal age in boys, it gradually increases until mid-puberty in girls [12]. Considering that the determinants of leptin regulation are important in predicting the factors that can contribute to leptin resistance, these factors may be suggested as the focus of treatment and prevention of obesity in children.
Go to : 
MATERIALS AND METHODS
Study design and setting
This preliminary cross-sectional study was conducted at Cipto Mangunkusumo Hospital Jakarta, along with one tertiary hospital in Bekasi, one tertiary hospital in East Jakarta, and one primary school in Central Jakarta.
This study had been approved by Ethics Committee of Cipto Mangunkusumo Hospital, Faculty of Medicine Universitas Indonesia (approval no, 389/PT02-FK/ETIK/2006). A written informed consent was obtained at the time of participant enrollment.
Study participants
We consecutively enrolled prepubertal obese male children with no growth or developmental abnormalities. Obesity was caused by exogenous factors, proven by excessive food intake through diet analysis. Prepubertal period was defined as the age of 5 years and 1 day to 9 years, 11 months, and 29 days. Obesity was defined as a body mass index (BMI) of >95th percentile according to the 2000 Centers for Disease Control growth chart (Indonesian Pediatric Society guideline for pediatric nutrition care) [1314].
Measurement of determinants
We set BMI, body fat mass, carbohydrate intake, fat intake, high density lipoprotein (HDL) cholesterol level, low density lipoprotein (LDL) cholesterol level, triglyceride level, and Homeostatic Model Assessment for Insulin Resistance (HOMA-IR) as the potential determinants of leptin regulation.
Height was measured to the nearest 0.1 cm, while weight was measured using the SECA (SECA Co., Hamburg, Germany) scale with a sensitivity of 0.1 kg. All clothing except the participants' undergarments were removed during weight measurement. The BMI was calculated as body weight (kg) divided by body height in meters squared (m2). Total body fat was measured using dual frequency bioelectric impedance analysis (TANITA BC-545; Tanita Co., Tokyo, Japan) [17]. Anthropometric and body fat measurement were performed by two trained physicians.
The participants' dietary pattern was recorded for 3 days using the 24-h dietary recall and analyzed using the NutriSurvey program, an Indonesian food database [18]. Dietary data collection and analysis were performed by an experienced pediatrician. The patients were asked to fast for 12 hours prior to blood examination to measure the complete blood count, lipid profiles (HDL cholesterol, LDL cholesterol, and triglyceride), leptin, CSLR, serum insulin, and blood glucose levels.
Measurement of outcomes
The CSLR and leptin levels were examined using the Quantikine enzyme-linked immunosorbent assay kit produced by R&D Systems, Inc. America [20].
Potential confounders
Puberty, gender, certain diet plans, acute illness, consumption of medications that may affect body weight (steroid and cytostatic), endocrine disease (except insulin resistance), and syndromes associated with obesity were assumed as potential cofounders. We restricted the study participants to those without the potential confounders. Any confounder that has not been addressed by restriction should be accounted in the analysis.
Statistical analysis
The characteristics of the study participants were described as mean, median, or proportion as appropriate. To assess the association between potential determinants and leptin regulation parameters, we performed bivariate and regression analysis with BMI, body fat mass, carbohydrate intake, fat intake, HDL cholesterol level, LDL cholesterol level, triglyceride level, and HOMA-IR as independent variables and with CSLR and FLI as separate dependent variables.
We performed a statistical analysis using IBM SPSS Statistics for Windows, Version 20.0 (IBM Co., Armonk, NY, USA). Normality study was performed to assess the distribution of data. A bivariate analysis was conducted using Pearson's correlation and Spearman's correlation as the alternative. We included the independent variables with a p-value of <0.25 in the backward linear regression analysis. In order to perform a multivariate analysis, all linear regression assumptions (linear relationship, multivariate normality, zero residual without outlier, no multicollinearity, independency, constant, and homoscedasticity) must be fulfilled.
Go to :
RESULTS
Eighty prepubertal male children were enrolled in this study. Their demographic characteristics, anthropometric data, and laboratory results are listed in Table 1. The most obese child was a 7-year-old boy with a BMI of 39.8 kg/m2 and a total body fat of 63.1%. Dietary analysis showed that carbohydrate was the main source of energy intake. Bivariate analysis displayed negative weak correlations of CSLR with BMI, body fat mass, and total amount of carbohydrate intake. On the contrary, a positive correlation was observed between FLI and those factors. Determinant factors with p-value <0.25 include BMI, body fat mass, total amount of carbohydrate intake, and HOMA-IR. However, HOMA-IR would only be used in the linear regression analysis to predict FLI (Table 2).
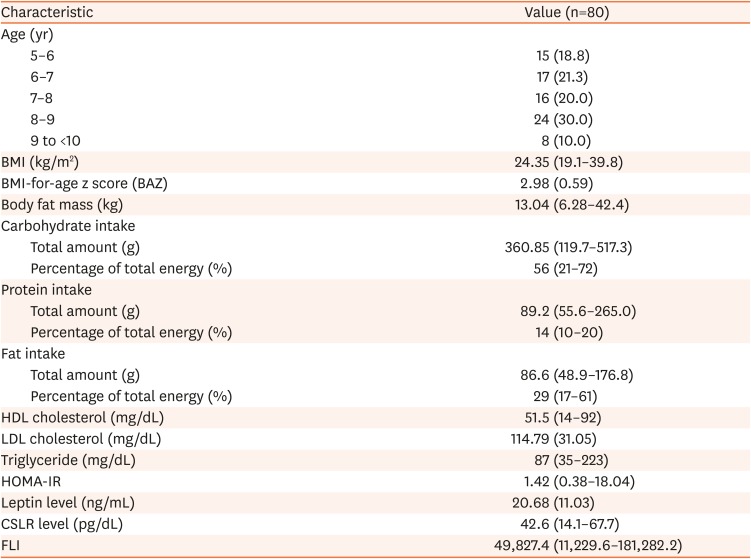

Table 1
Demographic characteristics, anthropometric data, and laboratory results of the study participants
Values are presented as number (%), median (range), or mean (standard deviation).
BMI: body mass index, BAZ: BMI-for-age z score, HDL: high density lipoprotein, LDL: low density lipoprotein, HOMA-IR: homeostatic model assessment for insulin resistance, CSLR: circulating soluble leptin receptor, FLI: free leptin index.
![]()
Table 2
Bivariate analysis of the determinant factors of CSLR and FLI
CSLR: circulating soluble leptin receptor, FLI: free leptin index, BMI: body mass index, HDL: high density lipoprotein, LDL: low density lipoprotein, HOMA-IR: homeostatic model assessment for insulin resistance.
*Total amount (g). †Variables were included in the multivariate analysis.
![]()
After performing bivariate analysis between CSLR level and determinant factors, we included BMI, body fat mass, and total amount of carbohydrate intake in the multivariate analysis. We found a collinearity between BMI and body fat mass (tolerance <0.4); hence, we only chose one of them to be included in the multivariate analysis. We preferred BMI over body fat mass because BMI is more applicable in the daily clinical setting. By performing a backward stepwise multiple linear regression method, only carbohydrate intake was significantly correlated with CSLR level, producing the following equation: CSLR=59.082−0.051×carbohydrate intake (R2=9.4%). All linear regression assumptions (linear relationship, multivariate normality, zero residual without outlier, no multicollinearity, independency, constant, and homoscedasticity) were fulfilled (Table 3).
Table 3
Multivariate analysis of the determinant factors of CSLR
![]()
A multiple linear regression analysis of the determinant factors of FLI could not be performed because we found some residual outliers, identified by the range of residual that fell outside of 3 standard deviations (mean±standard deviation: 0±0.994, range: −1.74 to 3.292).
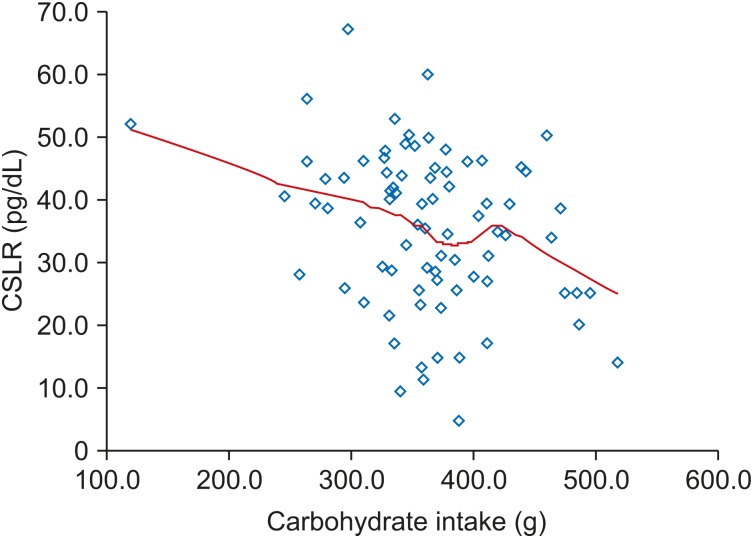
Total amount of carbohydrate intake was the only variable that could be used to predict CSLR level. Following the increase amount of carbohydrate intake, CSLR level decreased progressively without any negative peak (Fig. 1).
Go to :
DISCUSSION
Among variables with significant correlation, BMI and fat mass showed weak inverse correlation with CSLR level and weak positive correlation with FLI. These correlations are possibly due to the adaptive body response to increase FLI in obese children. The increase of BMI and fat mass are associated with the increase in adipocytes, which in turn synthesizes leptin. The role of free leptin is essential as it suppresses appetite and increases energy expenditure through its effects on the cardiovascular system and thermogenesis of brown adipose tissue [9212223].
Although the elevation of FLI is associated with increase in BMI and body fat mass, it fails to reduce body weight and fat mass in obese individuals. This may possibly indicate leptin resistance, which has not been clearly defined in children [2425]. A previous study revealed that circulating leptin is predominantly bound to CSLR in lean individuals. Meanwhile, in obese individuals, leptin mostly circulates in its free form [26]. Another study demonstrated that the free circulating leptin level at a lower range has a good correlation with free leptin level in the CSF. However, at a higher range, it only causes a slight increase in CSF free leptin level [27]. Furthermore, if CSLR level is proven to be proportional to the concentration of leptin receptor in the blood-brain barrier, it may then be used to determine the cause of leptin dysfunction in the hypothalamus. Accordingly, patients with leptin resistance have a high leptin level and a low CSLR level, while those with leptin insufficiency have a low leptin and a high CSLR level [9].
Many studies have attempted to determine the effect of macronutrients on leptin production, but their results were inconsistent [2829]. One study reported insignificant difference on leptin level between participants who consumed low fat and high carbohydrate (15% F, 65% C, 20% P) for 2 weeks and isocaloric high fat and low carbohydrate (35% F, 45% C, 20% P) for 2 weeks [30]. Another study also found that high carbohydrate intake is associated with lower leptin level, especially among individuals with higher insulin concentrations [31]. Meanwhile, a postprandial study revealed that the 9-hour postprandial leptin level increased after a high carbohydrate intake [32].
Analysis of leptin regulation following macronutrients dietary intake in obese pre-pubertal children is still limited. In this multivariate analysis study, carbohydrate intake is an important determinant factor of CSLR level, although the correlation is weak and the determinant value is only 9.4%. Our findings provide novel essential information on the effect of carbohydrate intake in leptin regulation. Previous studies have proven that carbohydrate intake increases leptin production. Furthermore, we found that those leptin increments are not accompanied by an increase in CSLR levels. More CSLRs are saturated with the increase in carbohydrate intake; hence, the CSLR levels decreased progressively without any negative peak. These will augment the hyperleptinemia condition in obese individuals. Another possible reason is that high carbohydrate intake predominantly increases the secretion of insulin-like growth factor 1, which causes a decrease in membrane OB-R expression and subsequent decrease in CSLR level [33]. Yannakoulia et al. [28] conducted a study to explore the relationship between macronutrient intake with leptin regulation in healthy individuals. Their results were similar with our findings, indicating that carbohydrate intake showed a stronger effect on leptin regulation compared with fat and protein intake [28].
We did not find any significant correlation between fat intake and leptin regulation. However, this result cannot be generalized because we did not evaluate the subtypes of fatty acids in diet analysis. Rostami et al. [34] reported that a subtype of fatty acids from dietary intake may affect leptin gene expression in the visceral and subcutaneous adipose tissues. Among non-obese individuals, saturated fatty acids have a positive correlation while polyunsaturated fatty acids have a negative correlation with leptin expression in all adipose tissues. Meanwhile, among obese individuals, only n-3, n-6, and n-9 fatty acids have a negative correlation with leptin expression in the visceral adipose tissue [34]. Another weakness in this study is the absence of micronutrient evaluation. To prevent obesity and subsequent leptin resistance, it is important to follow the Pediatric Nutrition Care Guideline released by the Indonesian Pediatric Society. Total caloric intake is calculated based on the height age of the patient. Then, the dietary macronutrient should be divided into carbohydrate 50–60%, fat 30%, and protein 15–20% [35]. The WHO Regional Office for South-East Asia also recommends similar dietary micronutrient composition with additional suggestion to limit free sugar consumption (in food preparation and sweetened beverages) to <10% [36].
To date, the relation between leptin regulation and lipid profile has not been verified because different studies showed inconsistent results. A study involving 294 healthy children demonstrated that leptin is positively associated with triglyceride values and negatively associated with HDL cholesterol levels [8]. Meanwhile, other studies conducted in hyperlipidemia and obese individuals either did not find any association between leptin and lipid profile or found an association between leptin and HDL cholesterol and apolipoprotein only (a) [3738].
In this study, we found that changes in the CSLR and FLI levels are not associated with lipid profiles. The reasons behind these findings are still unclear. A plausible explanation is the difference in the characteristics the study participants. In other studies that reported a significant relationship between leptin and lipid profiles, the participants were female obese [39] adults with hyperlipidemia [3738], healthy school-aged children [8], and junior high school children without specific inclusion criteria [40]. Meanwhile, our study participants were pre-pubertal obese male children. This means that there are two major different aspects in the participants of other studies: gender and pubertal status. Several studies have revealed that both leptin and CSLR level are higher in women than in men [94142]; interestingly, this difference has already existed in newborns [43]. Pubertal status also affects leptin regulation. FSH and LH are strongly related to the peak in leptin concentration during puberty, where testosterone inhibits leptin secretion from adipocytes, and estradiol increases the secretion [44].
In this study, we did not find any significant correlation between HOMA-IR with CSLR and FLI. These results are consistent with those observed by Fadoua et al. [45]. Theoretically, leptin exerts an insulin-sensitizing and glucose-lowering effect in the peripheral tissues, which can be observed by looking at the HOMA-IR value. However, leptin and insulin resistance in obese individuals may make these effects less distinct; therefore, we did not find any significant correlation between HOMA-IR with CSLR and FLI [4546]. These results need to be confirmed further as other studies revealed contrary results. Gonzaga et al. [47], who recruited obese children aged 2–18 years, found a significant association between HOMA-IR and leptin. This significant association was also observed by Valle Jiménez et al. [48] who recruited prepubertal obese children and administered standard obesity treatment for 9 months. This difference in the results between our study and other studies cannot be explained. Hence, additional studies that can further explore more determinant factors using a control group are needed to evaluate leptin regulation in obese children.
Go to :
CONCLUSION
Leptin regulation in prepubertal obese male children is related with body composition and carbohydrate intake. The latter can also be used to predict CSLR. Additionally, lipid profile and insulin resistance are not related to CSLR and FLI. Our study indicates that the strategies to treat and prevent leptin resistance in obese children should focus on reducing BMI, fat mass, and carbohydrate intake.
Go to :
 XML Download