

 PDF
PDF ePub
ePub Citation
 Print
Print


INTRODUCTION
Traditionally, atopic dermatitis (AD) is recognized as a common inflammatory skin disease and frequently occurred in Asian and Black individuals12. Adult AD has an estimated prevalence of 2.1% to 4.9% across countries, and the disease is becoming a substantial health care burden for patients who demand a good quality of life3. The pathology of AD is complex and not fully understood. Usually, it is widely accepted that the occurrence of this disease is related with the defects of epidermal function and immune responses causing by a complex gene-environment interaction4. Thus, in order to provide an improved therapy for patients, mechanisms associated with AD development should be further explored.
With the development of sequencing and bioinformatics technologies, the microarray data of severe AD have been published; however, most of the studies are involved in analyzing the difference between the drug treatment group and the disease, rather than the difference between the disease group and the healthy group567. Previous studies on gene profiling assays have shown that the AD development was significantly associated with the low expression levels of epidermal differentiation complex genes and the unregulated levels of T helper (Th)2 and Th17 genes8. Moreover, in lesion skin of AD patients, miR-155 targeting the immune suppressor cytotoxic T-lymphocyte-associated antigen 4 inhibiting T cell response was significantly overexpressed9. However, these findings are far from enough for understanding the pathogenesis of AD.
Recently, Martel and his colleagues10 reported microarray data on lesional skin from patients with mild intrinsic AD and healthy controls. Hence, the goal of this study was to systematically investigate the differences in gene expression between the mild intrinsic AD and healthy controls, and to explore the associated function biomarkers for mild AD patients.
MATERIALS AND METHODS
Subjects and data source
The expression profile dataset GSE75890 was downloaded from the database, which included 31 samples. For this study, samples of lesional skin (3 mm biopsy) were analyzed from eight healthy persons (age, 29±8) and nine intrinsic AD patients (psoriasis area and severity index [PASI], 4.0±2.3; age, 37±16; total immunoglobulin E [IgE], 53±48; eczema area and severity index [EASI], 3±2], diagnosed according to the criteria of Hanifin and Rajka, and all included patients had an EASI score <10. Expression profile of all samples was analyzed on the platform GPL17692 [HuGene-2_1-st] Affymetrix Human Gene 2.1 ST Array (transcript [gene] version).
Data preprocessing and differentially expressed genes screening
The original CEL data were downloaded and read with oligo of R software package (ver. 1.44.0, http://www.bioconductor.org/packages/release/bioc/html/oligo.html)11, and then normalized using Robust Multichip Average1213. The probe was annotated with a platform annotation file to remove the probes that did not match the gene symbol. If the same gene was mapped by different probes, the average value of these probes would be defined as the final expression value of this gene.
Selection of differentially expressed genes
Based on limma package (ver. 3.34.9, http://bioconductor.org/packages/release/bioc/html/limma.html), the differentially expressed genes (DEGs) between AD and controls were screened out14. Benjamini-Hochberg method was used to adjust p-value. The threshold were defined as |log2 (Fold Change)| > 1 and adjusted p<0.05.
Functional analysis
Kyoto Encyclopedia of Genes and Genomes (KEGG) pathways and Gene Ontology (GO) functions of these DEGs were analyzed using the Database For Annotation, Visualization And Integrated Discovery (DAVID; ver. 6.8, https://david.ncifcrf.gov/)1516. A comprehensive biological information database was included in DAVID, and this system can be used to mine biological functions for numerous genes and protein identity numbers (ver. 6.8, https://david-d.ncifcrf.gov/). The threshold was designed as count ≥2 and p<0.05.
Construction of protein-protein interaction network and module
Protein network visualization plays an important role in analyzing protein network characteristics. The database of Search Tool for Retrieval of Interacting Genes (STRING) is an online tool evaluating the network of protein-protein interaction (PPI)17. Using STRING (ver. 10.0, http://www.string-db.org/), the PPI among DEGs was analyzed. The input gene was set as a DEG and the species was set as human beings. PPI score was set as 0.9 to create subsets of high-confidence human PPI networks. The network was visualized by Cytoscape (ver. 3.2.0, http://www.cytoscape.org/)18. The score of nodes was obtained, and the importance of nodes in the network of PPI was identified by the score.
Exploration of module in PPI
Proteins in the same module had the same or similar functions, and they acted as a module on the same biological role. Thus, the module in PPI network was explored using MultiContrast Delayed Enhancement19, a plugin of Cytoscape. The score of the module were obtained, and the higher scores represented the closer relationship within the module. The module with score >5 and node ≥5 was chosen, and the function analyses including GO and KEGG pathway analyses were further analyzed.
Transcription factor-miRNA-target regulation forecast
The DEGs were inputted into the gene-miRNA targets module of the miRWalk 3.0 (http://mirwalk.umm.uni-heidelberg.de/search_genes/)20 to predict miRNA, and the species was set as human. Gene-miRNA regulatory relationship was obtained, and the pairs were selected when the score of relationship pairs was all more than 0.95 in the Targetscan, Mirdb, and Mirtarbase databases. Then, miRNA regulatory network was constructed.
Transcription factor (TF) was predicted using the tool of Transcriptional Regulatory Relationships Unraveled by Sentence-based Text mining (http://www.grnpedia.org/trrust/)21. DEGs were inputted in the module of “find key regulators for query genes”, and species was selected as human in the analysis. The thresholds of false discovery rate <0.05 and overlapped genes >5 were designed as significance. Moreover, the interaction network of TF-target gene and miRNA-target gene was integrated and constructed by Cytoscape.
Validation of DEGs based on clinical tissue samples
For further validation of our findings, several key genes expression levels (including cyclin B (CCNB)1, CCNB2, cyclin A (CCNA)2, C-X-C motif chemokine ligand (CXCL)10 and CXCL9) were also determined in clinical 8 mild AD tissues samples (age, 38±14; 5 male and 3 female; PASI, 4.1±1.9; biopsy site: trunk, upper or lower limbs; total IgE, 51±49; EASI, 3±1.5) and 8 normal samples (age, 34±16; 4 male and 4 female).
Total RNA from tissues were extracted using Trizol reagent (Invitrogen, Carlsbad, CA, USA). First-strand cDNA was generated using Reverse Transcription Reagents (Takara RR047, Sake, USA) according to the manufacturer's protocol. Real-time qPCR was performed in the Real-Time PCR Detection System (Bio-Rad, Hercules, CA, USA) using SYBR Green (Takara RR820, Sake, USA). Primer sequences were summarized in Table 1. Relative expression of genes normalized to glyceraldehyde 3-phosphate dehydrogenase was calculated with the 2−ΔΔCt method.
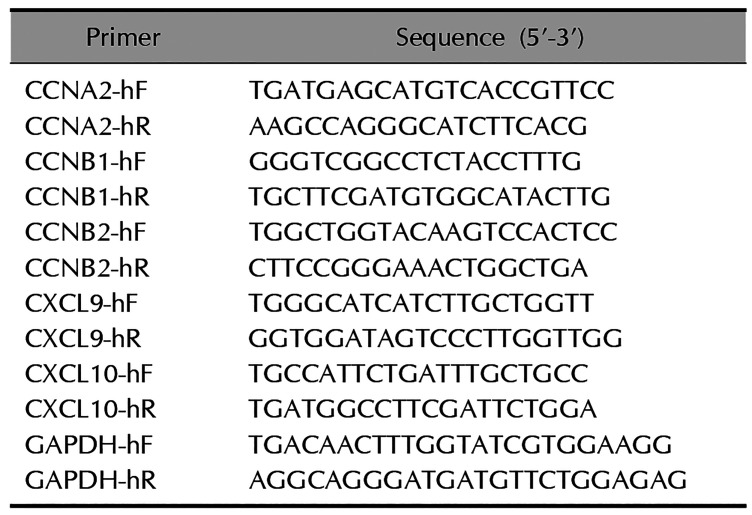
Table 1
The primer sequence of gene
![]()
RESULTS
Screening of DEGs
As shown in Fig. 1A, the median of expression profile data after normalization was on the same level. The heatmap of DEGs is presented in Fig. 1B. There were 285 DEGs includeing 214 upregulated and 71 downregulated genes between intrinsic AD samples and healthy controls (Supplementary Table 1).
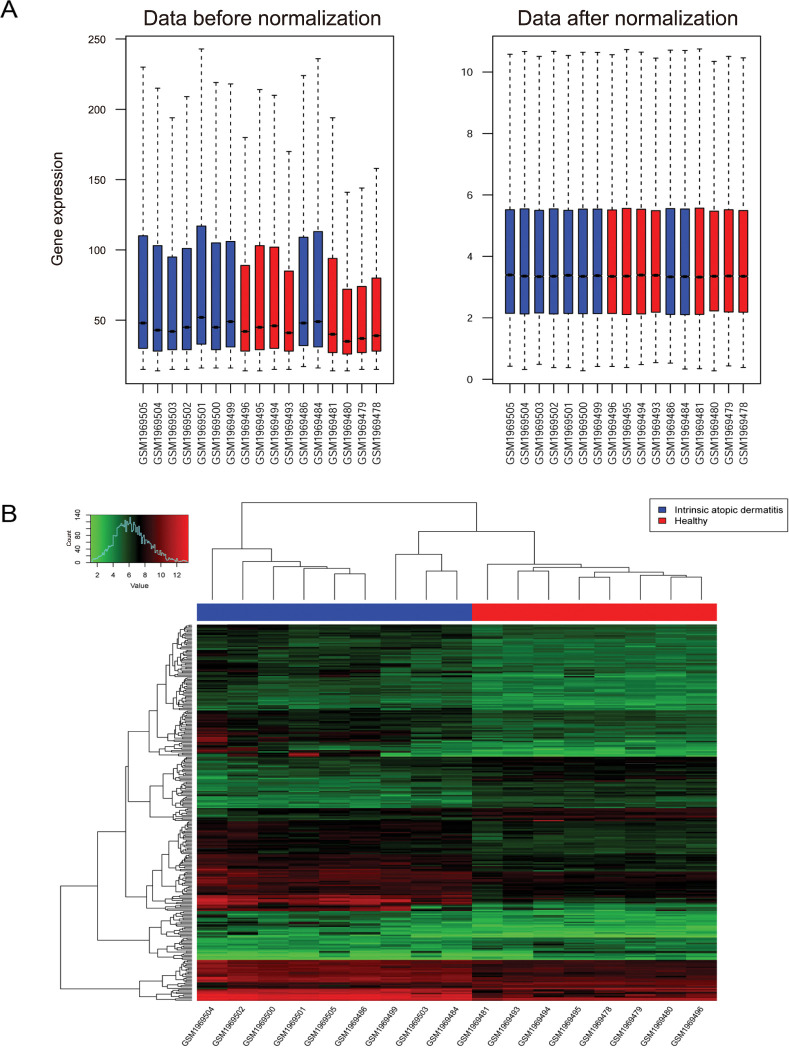
Fig. 1
Expression spectrum matrix box diagram before and after normalization and heatmap of differentially expressed genes. (A) Expression spectrum matrix box diagram before and after standardization. Blue represents the disease sample, red represents the normal sample, the horizontal axis represents the sample name, the vertical axis on the left is the original expression value, and the vertical axis on the right is the expression value of the log2 transformation. (B) Heatmap of differently expression genes.
![]()
Functional pathways of DEGs
Fig. 2 presents the results of top 5 KEGG pathways and enriched GO functions. The enriched GO terms were classified into three categories: biological process (BP), molecular function (MF), and cellular component (CC). The upregulated DEGs were enriched in nine pathways, such as hematopoietic cell lineage, pertussis, p53 signaling pathway, staphylococcus aureus infection, and cell cycle. As for GO function analysis, 59 BPs were enriched including immune response, inflammatory response, and peptide cross-linking; 14 MFs were enriched including motif chemokine receptor chemokine receptor binding, receptor for advanced glycation endproducts receptor binding, and chemokine activity; 11 CCs were enriched including extracellular exosome, keratin filament, and extracellular region.
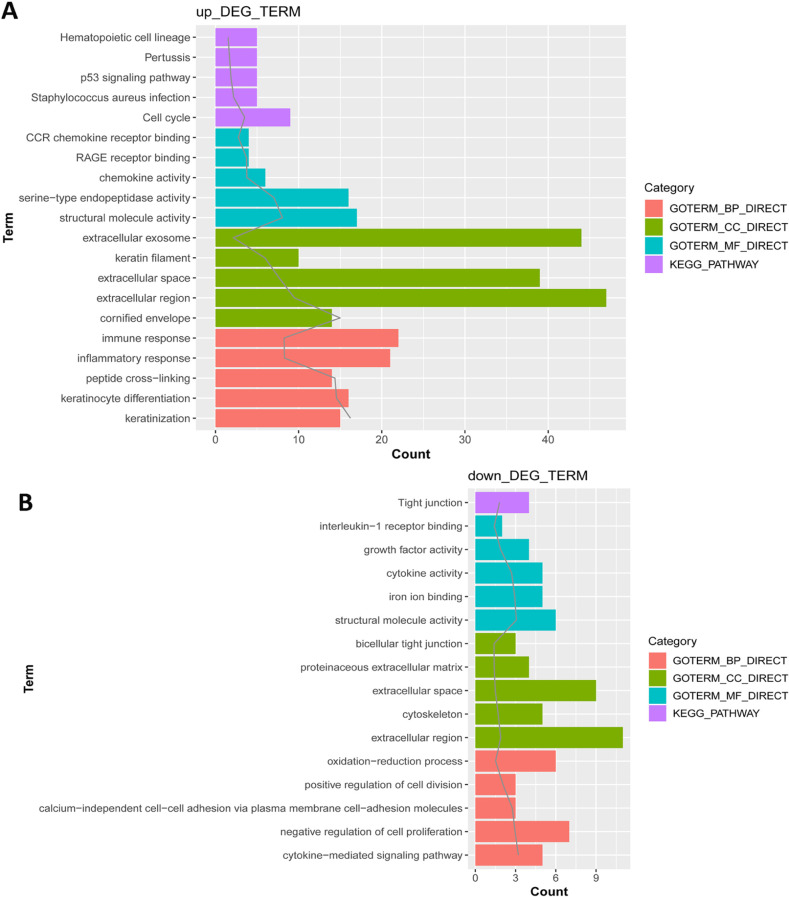
Fig. 2
Function analysis of differentially expressed genes. (A) Function analysis of up-regulated expression genes; (B) function analysis of down-regulated expression genes. The horizontal axis represents the number of enriched genes, the solid gray line represents -lg (p-value). DEG: differentially expressed gene, KEGG: Kyoto Encyclopedia of Genes and Genomes, CCR: motif chemokine receptor, RAGE: receptor for advanced glycation endproducts.
![]()
Tight junction was the only pathway enriched by the downregulated DEGs. Downregulated DEGs were associated with nine BP terms such as oxidation-reduction process, positive regulation of cell division, and calcium-independent cell-cell adhesion via plasma membrane cell-adhesion molecules; five CC such as bicellular tight junction, proteinaceous extracellular matrix, and extracellular space; five MF like interleukin (IL)-1 receptor binding, and cytokine activity.
PPI network and sub-network module construction
Total 89 nodes and 171 PPI pairs were obtained. Furthermore, two sub-module networks with higher scores were obtained. A total of nine nodes were included in module 1. Module 2 included six nodes. Genes with the top ten degree in PPI network and genes included in two modules are shown in Table 2, such as CCNB1, CCNB2, CCNA2, CXCL10, and CXCL9 (Fig. 3).
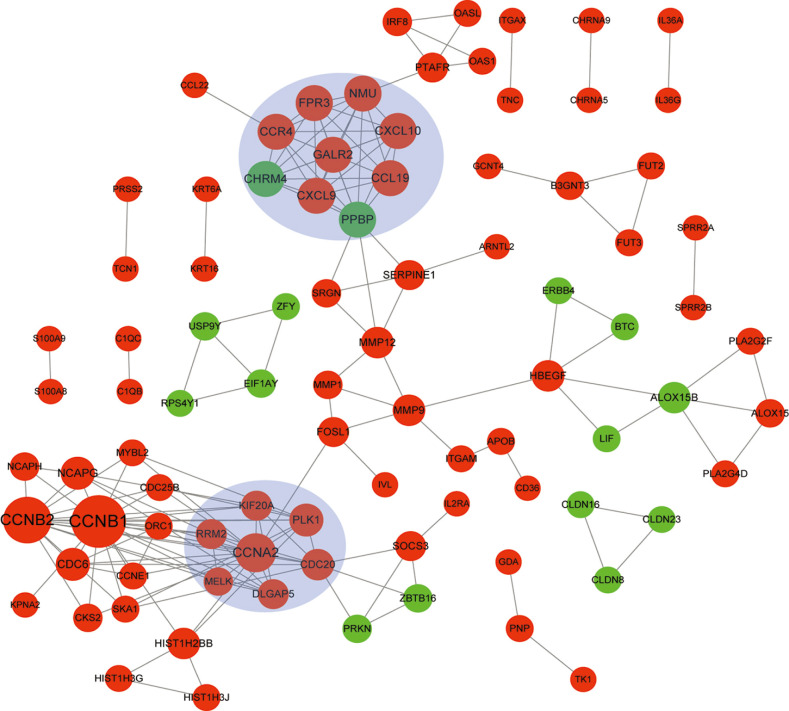
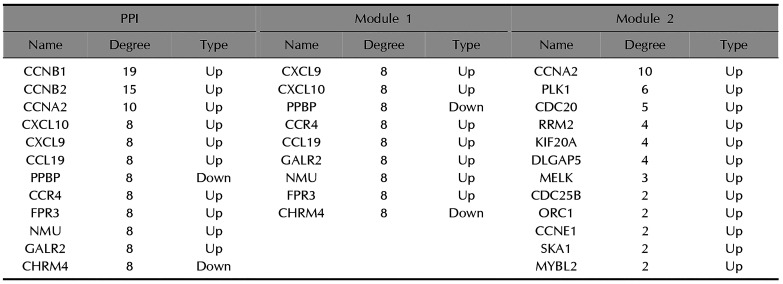
Fig. 3
Protein-protein interaction network of differentially expressed genes. Red circle represents up-regulated genes, green circle represents down-regulated genes, and blue shades represent modules. The size of circle indicates the degree (the larger the circie, the higher the degree is).
![]()
Table 2
Top ten genes in PPI network and modules in PPI network
![]()
Genes included in module 1 mainly enriched in three pathways, including cytokine-cytokine receptor interaction, chemokine signaling pathway, and neuroactive ligand-receptor interaction. In total, four pathways were enriched by genes in module 2, including cell cycle, oocyte meiosis, progesterone-mediated oocyte maturation, and viral carcinogenesis (Table 3).
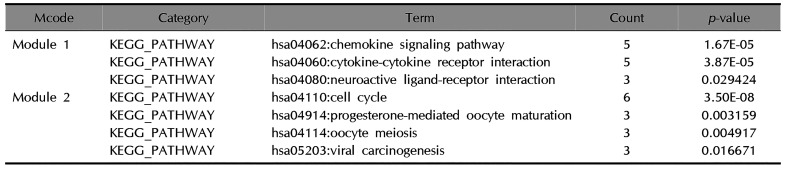
Table 3
KEGG pathway enrichment with higher score in modules
![]()
miRNA-target gene network construction
The miRNA-target gene network is shown in Fig. 4A. A total of 43 nodes and 31 miRNA-target gene interaction pairs were obtained in the network of miRNA-target gene. According to miRWalk prediction, 25 miRNAs targeting 18 genes were selected, such as miR-106a, miR-106b, and miR-17.
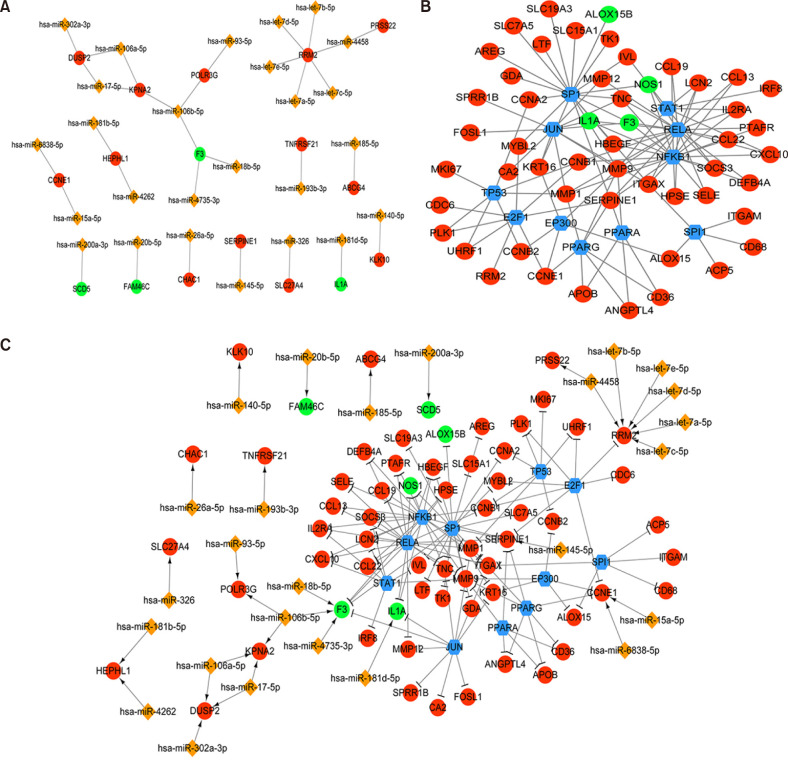
Fig. 4
MiRNA-target gene, transcription factor (TF)-target gene, and TF-miRNA-target gene composite network of differentially expressed genes (DEGs). (A) MiRNA-target gene network of DEGs. Red circle represents up-regulated genes, green circle represents down-regulated genes, and orange diamonds represents miRNAs; (B) TF-target gene network of DEGs. Red circle represents up-regulated genes, green circle represents down-regulated genes, and the blue hexagon indicates the TF. (C) TF-miRNA-target gene composite network of DEGs. The red circle represents the up-regulated gene, the green circle represents the down-regulated gene, the blue hexagon represents the TF, the orange diamond represents the miRNA, the arrow line represents the regulatory relationship of miRNA-Target, and the T-shape represents the regulatory relationship of TF-target.
![]()
TF-target gene network construction
As shown in Fig. 4B, TF-target gene network included 63 nodes and 117 interaction pairs. A total of 11 TFs targeting 52 genes were selected, such as nuclear factor kappa B subunit 1 (NFKB1), RELA proto-oncogene (RELA), Sp1 transcription factor (SP1), and signal transducer and activator of transcription 1 (STAT1).
TF-miRNA-target gene network construction
The network of TF-miRNA-target gene is shown in Fig. 4C. The network of TF-miRNA-target gene included 101 nodes and 148 interaction pairs. Matrix metallopeptidase 9 (MMP9), peroxisome proliferator activated receptor gamma (PPARG), and serpin family E member 1 (SERPINE1) were hub genes with higher degrees than other nodes.
Validation of key DEGs in clinical tissue samples
To confirm the reliability of the identified DEGs, the CCNB1, CCNB2, CCNA2, CXCL10, and CXCL9 expression profiles were verified in tissue samples. As shown in Fig. 5, compared with the control group, the expression levels of CCNB1, CCNB2, CCNA2, CXCL10 and CXCL9 in mild AD group were significantly up-regulated (all, p<0.05), which is in accordance with the bioinformatics data above.
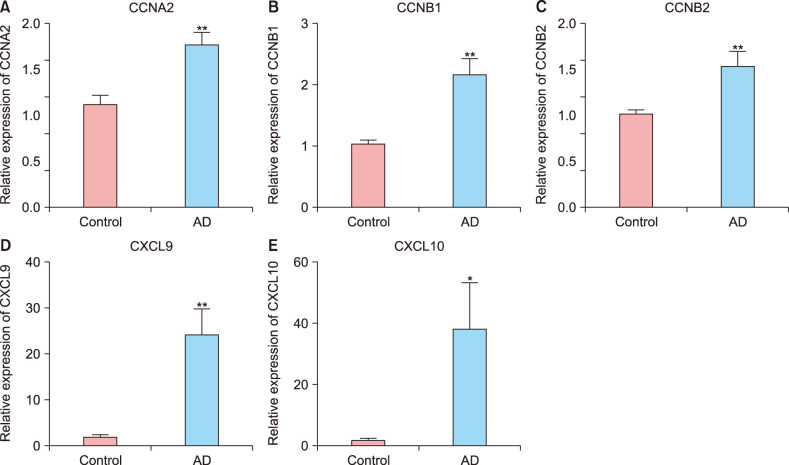
Fig. 5
Gene expression is determined by quantitative real-time polymerase chain reaction. The cyclin A (CCNA)2 (A), cyclin B (CCNB)1 (B), CCNB2 (C), C-X-C motif chemokine ligand (CXCL)9 (D), and CXCL10 (E) levels in atopic dermatitis (AD) tissue samples were higher than those in normal tissue samples. *p<0.05 and **p<0.01.
![]()
DISCUSSION
This study used microarray analysis to investigate the potential molecular biomarkers and functional network in patients with mild intrinsic AD. In total, 285 DEGs including 214 upregulated genes and 71 downregulated genes between AD and healthy controls were identified. The upregulated DEGs involved in hematopoietic cell lineage, pertussis, p53 signaling pathway, staphylococcus aureus infection, and cell cycle, and the downregulated DEGs were enriched in tight junction pathway. CCNB1, CCNB2, CCNA2, CXCL10, and CXCL9 were key nodes in PPI network. And the upregulation of these genes, including CCNB1, CCNB2, CCNA2, CXCL10 and CXCL9, were confirmed by qRT-PCR. In addition, TF-miRNA-target gene regulatory network focused on miRNAs such as miR-106a, miR-106b, and miR-17, TFs such as NFKB1, RELA, SP1, and STAT1, and hub genes like MMP9, PPARG, and SERPINE1.
AD is widely accepted as an inflammatory skin disease, and new insights into the genetics and pathophysiology have pointed out that immune dysregulation was critical in the development of AD22. In our study, CCNB1, CCNB2, CCNA2, CXCL10, and CXCL9 were key nodes in PPI network. Moreover, the results of TF-miRNA-target gene network construction showed that CCNB2 could be regulated by two TFs, such as tumor protein (TP) 53 and E1A binding protein p300. And as the DEGs in mild intrinsic AD, CXCL10 was targeted by the TFs of NFKB1, RELA, and STAT1. Similarly, CCNA2 was targeted by TP53 and SP1, and CCNB1 was targeted by TP53, E2F1, NFKB1, and SP1. CXCL10 could modulate adhesion molecule expression, and stimulate monocytes, natural killer and T-cell migration. CXCL9 is an important paralog of CXCL10, which could affect immune and inflammatory response based on participating in the growth, movement, or activation state of cells. Previous studies suggest that an imbalance of Th2-predominating cytokine milieu (such as IL-4 and IL-5) may be responsible for the development of human AD2324. Recent studies have revealed that Th1-type cytokines, such as CXCL10 and CXCL9, play important roles in pathogenesis of AD. Shimada et al.25 reported that both Th2 and Th1 chemokines are elevated in sera from patients with AD. Thus, we proposed that CXCL9 and CXCL10 may play a significant role in promoting the inflammation of the skin barrier in patients with AD.
Pathway enrichment analysis revealed that the upregulated DEGs involved in hematopoietic cell lineage, p53 signaling pathway, staphylococcus aureus infection, and cell cycle. A multilineage committed progenitor cell can be developed by hematopoietic stem cells. Cell growth and death were the mainly functions introduced by p53 signaling pathway. Among AD patients, a large number of proliferation markers have been found, such as marker of proliferation Ki-67 (MKI67) and keratin 16 (KRT16)2627. CCNB1 and CCNB2 are all numbers of cyclin family, which participate in controlling of cell cycle regulatory machinery. Moreover, CCNA2 was also a main regulator of the cell cycle. Thus, the genes such as CCNB1, CCNB2, and CCNA2, which involved in the pathway of cell cycle, may participate in the progression of AD via modulating cell proliferation.
miRNAs are short single-stranded RNA molecules and formed in the nucleus through transcription. An estimated profile of miRNAs in AD patients has been reported using microarray28. Although an altered miRNAs expression in the skin of AD patients has been shown in many studies2829, the functions of these molecular have been little known. In the study, we constructed the TF-miRNA-target gene network to explore the potential role of these molecular in AD progression. In our study, miR-106a, miR-106b, and miR-17 were focused on in the TF-miRNA-target gene network. The expression of coagulation factor III (F3), RNA polymerase III subunit G (POLR3G), and karyopherin subunit alpha 2 (KPNA2) were regulated by miR-106b. F3 is related to cytokine receptor activity. POLR3G could induce type I interferon and NFKB via the retinoic acid inducible gene I pathway3031. KPNA2 has been proven as molecular marker of prognosis and therapeutic sensitivity in many caners through involving in cell proliferation and inflammatory processes3233. miR-17 level was related to increased cell viability and migration34. Dual-specificity phosphatase 2 (DUSP2) is expressed widely in the immune system, and promotes immune and inflammatory responses35. In our study, KPNA2 and DUSP2 were regulated by miR-17. Thus, we specualted that miR-106b might be involved in regulation of immune response by decreasing the expression of F3 and increasing the expression of POLR3G and KPNA2, and miR-17 might promote immune and inflammatory responses in AD patients by regulating KPNA2 or DUSP2.
There are several limitations in this study. For example, these genes were not verified through in vitro and in vivo experiments. Thus, the potential role of these predicted results would be further confirmed in further study.
In conclusion, the results highlight the significant role of CXCL9 and CXCL10 in promoting the occurrence of inflammation of the skin barrier and the genes associated with cell proliferation such as CCNB1, CCNB2, and CCNA in patients with AD. Furthermore, we suggested that miR-106b and miR-17 might be involved in regulation of immune and inflammatory responses by regulating the downstream pathway.
 XML Download