

 PDF
PDF Citation
 Print
Print


INTRODUCTION
Powered mobility devices (PMDs) are walking-assist battery-powered chairs and include powered wheelchairs and electric scooters (Fig. 1).12 PMDs enable independent living and increase the quality of life for people and patients with physical limitations owing conditions such as neurological disease, cardiovascular disease, and aging.345
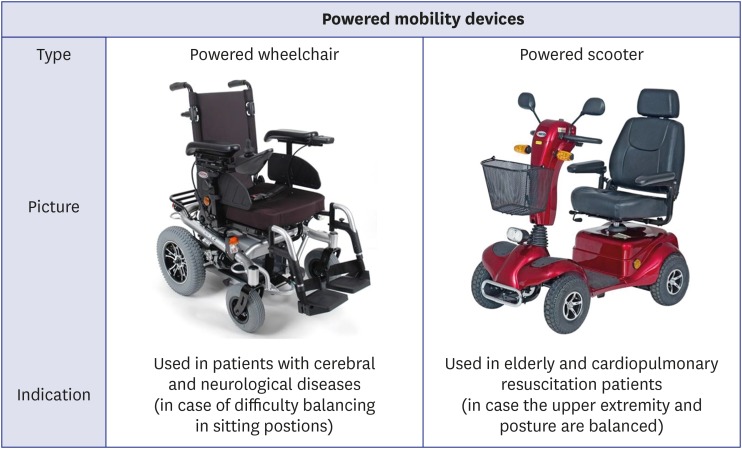 | Fig. 1Two types of PMDs. Powered wheelchairs are used in patients with cerebral and neurological diseases and in patients with difficulty balancing in seated positions. Powered scooters are used for elderly and cardiopulmonary resuscitation patients and for patients with upper extremity and posture balance challenges.PMD = powered mobility device.
|
In February 2008, the Korean Ministry of Health and Welfare announced the expansion of health insurance coverage for PMD users.6 Since then, the number of PMD has increased annually, and 130,000 units were supplied by 2016.7 In 2016 alone, 14,566 PMDs (2,986 powered wheelchairs and 11,580 electric scooters) were supplied in Korea.7
Since PMD users have more underlying diseases than non-users, they may have less muscular strength and may be less able to respond to impending collisions,89 resulting in higher incidence rates and more extensive injuries. According to 2015 market survey data, 35.5% of PMD users reported having been involved in incidences, 41.2% of whom colliding with a moving obstacle2 Furthermore, in a 2011 survey, > 50% of PMD users had experienced a collision while actively using PMDs.10
Despite the high incidence rates, studies on PMD injuries are limited. Moreover, most studies involve surveys and interviews with PMD users,11 and studies on injury patterns and hospital outcomes are scarce. While most PMD users are elderly patients1212 to our knowledge, no study has compared the unique features of PMD-related injury patterns and outcomes between elderly and younger patients.
Thus, the present study analysed the patterns and hospital outcomes of PMD-related injuries and compared them according to the age of the injured patients, viz. elderly adults aged ≥ 65 years or younger adults.
Go to : 
METHODS
Study design
This retrospective study analysed data from Korea Emergency Department-based Injury In-depth Surveillance (EDIIS) database. The EDIIS database contains injury data for patients visiting various emergency departments (EDs) throughout Korea.
Data collection
Data for this study were derived from road traffic injury-related patient data within the EDIIS database of eight EDs in 20 participating centres. Information concerning patient demographics, injury mechanism, pre-hospital course, ED disposition, and injury location was collected using the database. Physicians at each ED collected primary information, which was recorded into the web-based EDIIS database by EDIIS project coordinators.
Patient selection
In this study, we selected adult patients who had sustained injuries while using PMDs, excluding unclassified ground transportation-related injuries which involved wheelchairs, Segways, carts, rickshaws, etc. The final study population comprised injured patients who had sustained injuries while riding PMDs, including powered wheelchairs and scooters. We excluded patients who had sustained injuries while indoors and those aged ≤ 18 years. The patients were divided into a younger-adult group aged from 19 to 64 years and an elderly adult group (≥ 65 years) (Fig. 2).
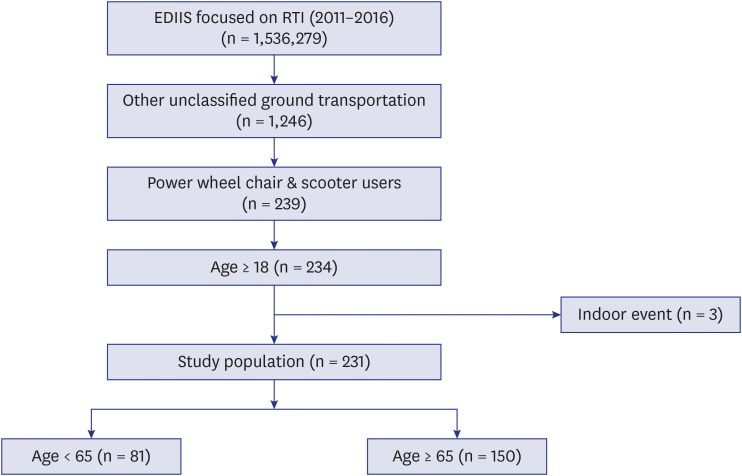 | Fig. 2Study selection graph for PMD-related injuries. A total of 231 of 1,246 injured patients who sustained other unclassified ground transportation injuries were included in this study. We excluded patients who had sustained injuries during indoor events (n = 3) and categorized 150 patients as elderly adults aged ≥ 65 years.PMD = powered mobility device, EDIIS = emergency department-based injury in-depth surveillance, RTI = road traffic injury.
|
Measures
Information concerning patient demographic factors (gender, age, and past medical history), injury-related factors (place, time, use of protective devices, and crash opponents), pre-hospital factors (route to ED), ED disposition, and clinical outcomes (injury severity score and location of bodily injuries) were collected. These various factors were listed in order of frequency and were divided according to the two age groups.
Clinical outcomes were determined, and the severity of injury was measured on the basis of excess mortality ratio-adjusted injury severity scale (EMR-ISS). The EMR-ISS is an injury severity scale adapted from the International Statistical Classification of Diseases and Related Health Problems 10th Revision, Clinical Modification (ICD-10-CM).13 The EMR-ISS scale scores range from 1 to 74. We divided the scale into three stages: 1 ≤ EMR-ISS ≤ 9 (mild), 9 ≤ EMR-ISS ≤ 24 (moderate), and EMR-ISS ≥ 25 (severe). To describe the patient injury patterns, the injured body location was subsequently analysed by gathering all diagnoses coded in the ICD-10-CM system.
Outcomes
The primary outcome was the severity score of trauma (EMR-ISS ≥ 25). The secondary outcome was the poor clinical course including general ward or intensive care unit (ICU) admission, operation, and overall death.
Statistical analysis
Continuous and categorical variables were compared between the younger and elderly adult groups using Fisher's exact and Wilcoxon rank sum tests. The logistic regression analysis was used to identify risk factors of primary and secondary outcomes. We selected candidate risk factors of age, route to ED, gender, any kind of past medical history, crash opponents, time of injury, date of injury, injury place, and purpose of PMD use in univariate logistic regression analyses, and further included in the multivariate analysis. We analysed all data using R statistical software version 3.5.2 (R Foundation for Statistical Computing, Vienna, Austria). To describe the injury patterns of all patients, we calculated the ratio of injured body locations versus the total number of diagnoses coded in the ICD-10-CM system.
Ethics statement
The study was approved by the Institutional Review Board (IRB) of Samsung Seoul Hospital (IRB No. 2019-01-161) and the Korea Centers for Disease Control & Prevention. The requirements for informed consent were waived due to the retrospective study design.
Go to :
RESULTS
Of 1,246 injured patients who had sustained unclassified ground transportation injuries other than those involving motor vehicles, motorcycles, and bicycles, 231 patients were included in our study. We excluded patients who were injured due to indoor events (n = 3), and 150 patients were categorized as elderly adults aged > 65 years (Fig. 2).
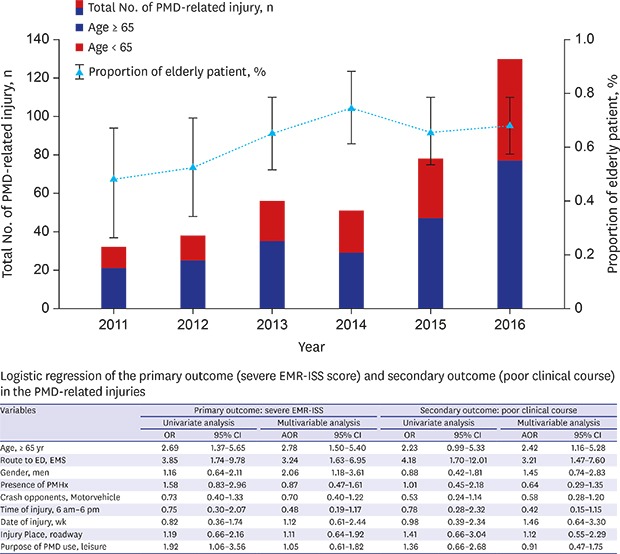
Fig. 3 shows the number of PMD-related injured patients per year and the proportion of elderly adult patients aged ≥ 65 years. In 2011, there were 21 injured patients, after which the number of PMD-related injured patients increased steadily, except in 2014. In 2016, after announcing an expansion of health insurance coverage for PMD users, the number of PMD-related injury patients were three times more than that reported in 2011. An increase was also observed in the proportion of PMD-related injuries in elderly adult patients. In 2011, 47% of the patients were ≥ 65 years old, and a slight annual increase in patient injuries was observed. After peaking at 77% in 2014, the number of patients declined slightly; however, ≥ 65% of the patients were later identified as elderly.
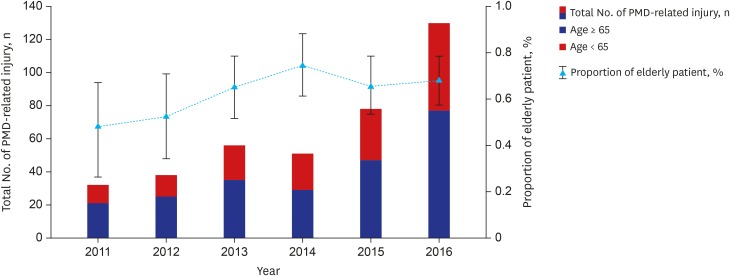 | Fig. 3The total number of PMD-related injury patients and the injury rate of those aged ≥ 65 years.The number of PMD-related injury patients increased steadily, except in 2014. The proportion of elderly adult injured patients also increased. In 2011, 47% of the patients were aged ≥ 65 years, and proportion that increased slightly every year. After peaking at 77% in 2014, the number of injured patients declined slightly; however, ≥ 65% of the injured patients later comprised elderly adult patients.
PMD = powered mobility device.
|
The patient demographics and injury-related factors are listed in Table 1. The total numbers and proportions of patients per parameter are listed, comparing the variables and differences between elderly and younger adult patients. In total, 40% of all injuries occurred in men; however, the proportion of elderly injured men was significantly higher than that for younger men (47.3% vs. 27.2%, P = 0.004). Most patients (72.3%) had underlying diseases, and 71.9% of the patients required transportation by emergency medical services to the ED. In total, 48.1% of injuries were sustained without crash opponents, followed by motor vehicles as crash opponents. Most injuries occurred on roadways (46.3%), followed by incidences occurring in back lanes or alleys (26.4%) and on sidewalks (11%). Only 4.3% of injured patients wore protective gear, including helmets, at the time of the incidence.
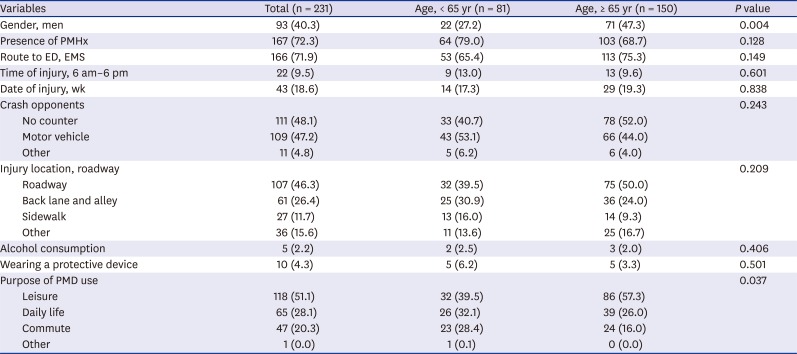
Table 1
Patient demographics and injury-related factors relating to PMD-related injury
Values are presented as number (%). Number refers to the total number of observations.
ED = emergency department, EMS = emergency medical services, PMHx = past medical history, PMD = powered mobility device.
![]()
Table 2 shows the ED disposition and clinical outcomes of PMD-related injuries. We derived the primary and secondary outcomes from this table. EMR-ISS, the primary outcome, was higher in older patients (32.3% vs. 15%, P = 0.005). In terms of clinical courses, the secondary outcome, older patients were more likely to be hospitalized (25.3% vs. 9.9%, respectively, P = 0.008) and to experience intensive care unit admission, surgery, or death in the ED (15.3% vs. 9.9%, respectively, P = 0.008). Among injured body location categories, extremity injuries accounted for the highest ratio (76.5%), followed by head and neck injuries (59.7%).
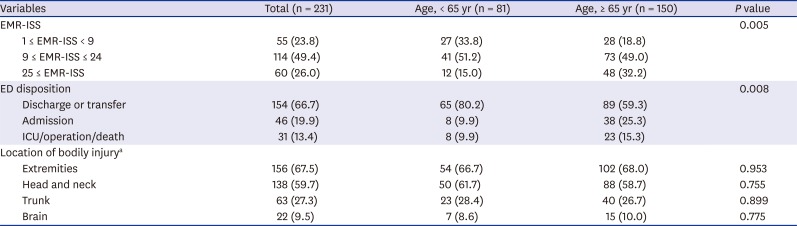
Table 2
ED disposition and clinical outcomes of PMD-related injuries
Values are presented as number (%). Number refers to the total number of observations.
ED = emergency department, PMD = powered mobility device, EMR-ISS = excess mortality ratio-based injury severity score, ICU = intensive care unit.
aMultiple answers possible for injured body locations.
![]()
Table 3 shows univariate analysis found primary and secondary outcomes to be significantly related to variables such as age, route to ED, and gender. Motor vehicles as crash opponents and roadway as injury place were not significantly associated with severe EMR-ISS and poor outcomes. Regarding the primary outcome, multivariable analysis found a significant association with age (adjusted odds ratio [AOR], 2.78; 95% confidence interval [CI], 1.50–5.40), route to ED using EMS (AOR, 3.24; 95% CI, 1.63-6.95) and men gender (AOR, 2.06; 95% CI, 1.18–3.61). Regarding the secondary outcomes of poor clinical course, there were also significant associations with age (AOR, 2.42; 95% CI, 1.16–5.28), and route to ED using EMS (AOR, 3.21; 95% CI, 1.47-7.60).
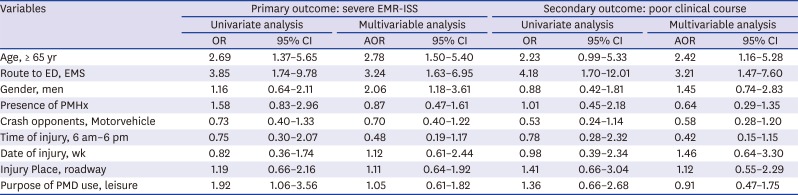
Table 3
Logistic regression of the primary outcome (severe EMR-ISS score) and secondary outcome (poor clinical course) in the PMD-related injuries
EMR-ISS = excess mortality ratio-based injury severity score, PMD = powered mobility device, ED = emergency department, EMS = emergency medical service, PMHx = past medical history, OR = odds ratio, CI = confidence interval, AOR = adjusted odds ratio.
![]()
Go to :
DISCUSSION
To our knowledge, this is the first study to investigate PMD-related injuries among elderly adult patients based on data from a nationwide database. Moreover, this is also the first study to compare the characteristics of injured elderly and younger adult patients.
The total number of PMD-related injuries and the proportion of elderly injured patients increased annually. Most injuries occurred on the roadway and did not involve crash opponents. Patients aged ≥ 65 years had a higher incidence of intensive care unit admissions, surgery, and death and a higher injury severity score based on the EMR-ISS. Univariate analysis found primary and secondary outcomes to be significantly related to variables such as age, route to ED, and gender. However, motor vehicles as crash opponents and roadway as injury place were not significantly associated with severe EMR-ISS and poor clinical course.
The number of PMD users is expected to increase with technological improvements in PMDs and needs for user self-care and autonomy, especially elderly adults, who are the fastest-growing and largest population to use PMDs.1415 The number of PMD users in Korea is steadily increasing due to government welfare assistance.6 The results of our study showed an increase in PMD-related injuries, as well as the proportion of patients aged ≥ 65 years with PMD-related injuries. Most PMD users have been reported to have underlying diseases and are less responsive to impending collisions12; our results also showed that most of the PMD-related patients in our study had underlying diseases.
The PMD user is classified as a pedestrian under Korean law and should use pedestrian footpaths.2 However, many PMD users have been reported to use roadways because of obstacles and surface irregularities encountered on pedestrian footpaths.16 These issues have led to a high rate of incidences on the roadway and to the second-highest rate of crash opponents involving motor vehicles, indicating the need for resurfacing of pedestrian footpaths to reduce incidence rates.
As well as PMD use, driving motor vehicles requires cognitive and visual perception as well as motor skills.17 Drivers aged ≥ 65 years have a higher annual fatality rate than that in younger adults.18 In some countries, physicians are legally required to report elderly adults who are eligible to renew their driver's licenses.1920 Although stringent criteria for driving a motor vehicle is not applicable to PMD use, a standardized evaluation protocol is needed for safe.
A recent survey showed that only 28% of patients had received safety training and education, indicating the importance of safety education for PMD users; in addition, mandatory safety education has been recommended.2 Our study findings indicate the need for active targeted education in this population to promote the use of protective equipment during PMD use, as only 4.3% of patients in our study had worn protective equipment
In this study, patients aged ≥ 65 years showed higher rates of intensive care hospitalization and surgery. Therefore, we suggested that older PMD users need more safety education such as using protective devices and avoiding roadway driving than younger PMD users.
There were several limitations in this study. At first, because the EDIIS database included surveillance data from patients enrolled from only eight of the largest EDs in Korea, sampling bias was possible. Second, the EDIIS database only included information on patients who visited EDs; therefore, this study did not include patients with very severe injuries including death at the scene or those with minor injuries which did not require medical treatment or who declined to visit the ED. This may have led to over or under-estimates of the rate of severe injuries. Third, because there are several expressions to refer to PMD in Korea, there might be a possibility of missing patients who had PMD-related injuries, causing selection bias. However, we could not identify these in the EDIIS database. Finally, the EMR-ISS, which was used for the evaluation of injury severity, is not a frequently used index. The EMR-ISS was developed in Korea and has been used in various Korean studies,13 but no reports have yet been used in studies from other countries.
The total number of PMD-related injuries and the proportion of elderly injured patients increased annually. There was a high rate of injuries on the roadway and injuries occurring without crash opponents. Given the higher number and severity of injuries sustained among elderly adults ≥ 65 years of age shown in this study, we recommend that safety educations, such as the use of protective equipment and the safe driving on the roadway, are considered for PMD users ≥ 65 years of age.
Go to :
 XML Download