Abstract
Near-infrared spectroscopy is a device used to determine whether traumatic intracranial hemorrhage has occurred and is primarily used for screening in emergency situations. In this study we examined the applicability of this equipment in postmortem inspection. This study included 124 autopsy cases and 59 postmortem inspection cases performed in the National Forensic Service from July 2017 to October 2018. We carried out the test using Infrascanner Model 2000 (Infrascan Inc.). Autopsy cases were divided into four groups (epidural hemorrhage or subdural hemorrhage group, traumatic subarachnoid hemorrhage or cerebral contusion group, nontraumatic intracerebral hemorrhage group, and control group) and analyzed. There was no difference in the test results according to the presence and type of intracranial hemorrhage. The possibility that variables related to postmortem change affected the test results was considered. In conclusion, this study confirmed that near-infrared spectroscopy is not suitable for the detection of traumatic intracranial hemorrhage in postmortem inspection.
Go to : 
REFERENCES
1. Leon-Carrion J, Dominguez-Roldan JM, Leon-Dominguez U, et al. The Infrascanner, a handheld device for screening in situ for the presence of brain haematomas. Brain Inj. 2010; 24:1193–201.
2. Ayaz H, Izzetoglu M, Izzetoglu K, et al. Early diagnosis of traumatic intracranial hematomas. J Biomed Opt. 2019; 24:1–10.

3. Bressan S, Daverio M, Martinolli F, et al. The use of handheld near-infrared device (Infrascanner) for detecting intracranial haemorrhages in children with minor head injury. Childs Nerv Syst. 2014; 30:477–84.

4. Kontojannis V, Hostettler I, Brogan RJ, et al. Detection of intracranial hematomas in the emergency department using near infrared spectroscopy. Brain Inj. 2019; 33:875–83.

5. Liang CY, Yang Y, Shen CS, et al. Chinese military evaluation of a portable near-infrared detector of traumatic intracranial hematomas. Mil Med. 2018; 183:e318–23.

6. Peters J, Van Wageningen B, Hoogerwerf N, et al. Near-infrared spectroscopy: a promising prehospital tool for management of traumatic brain injury. Prehosp Disaster Med. 2017; 32:414–8.

7. Schober P, Bossers SM, Schwarte LA. Intracranial hematoma detection by near infrared spectroscopy in a helicopter emergency medical service: practical experience. Biomed Res Int. 2017; 2017:1846830.

8. Semenova Zh B, Marshintsev AV, Melnikov AV, et al. Infrascanner in the diagnosis of intracranial lesions in children with traumatic brain injuries. Brain Inj. 2016; 30:18–22.
Go to : 
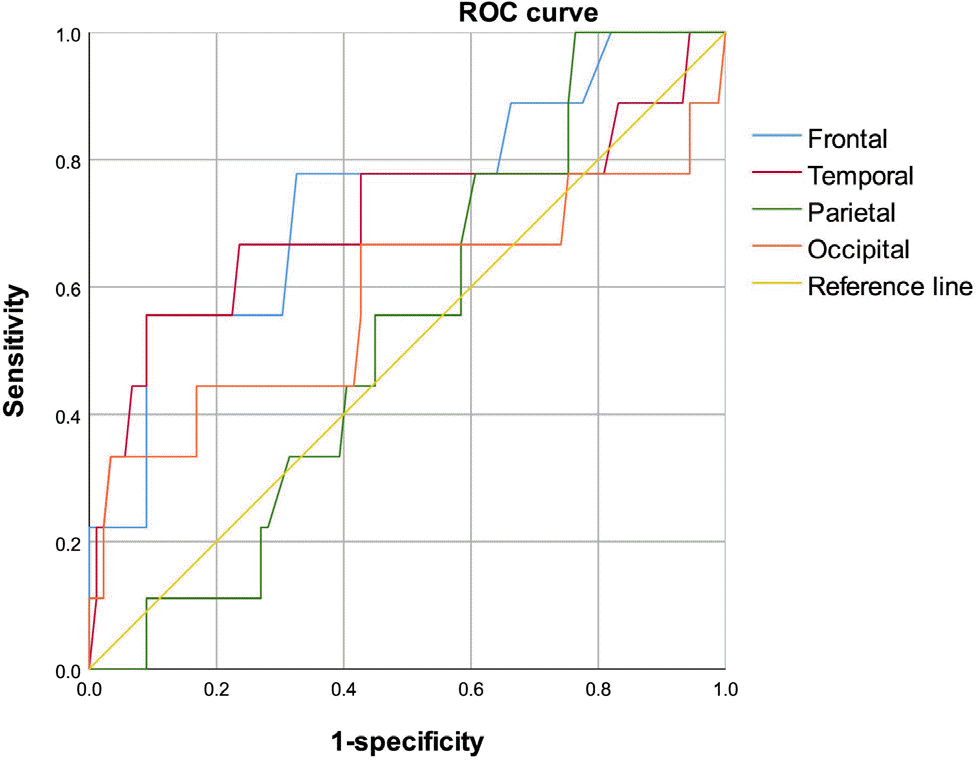
 | Fig. 1.Receiver operating characteristic (ROC) curve of difference in optical density (ΔOD) for postmortem diagnosis of traumatic intracranial hemorrhage. |
Table 1.
Success rate of near-infrared spectroscopy test by anatomical position
| No. | Frontal area | Temporal area | Parietal area | Occipital area | |
|---|---|---|---|---|---|
| Autopsy | 124 | 122 (98.4) | 117 (94.4) | 107 (86.3) | 104 (83.9) |
| PI | 59 | 59 (100) | 59 (100) | 59 (100) | 57 (96.4) |
Table 2.
Comparison of difference in optical density (∆OD) according to type of intracranial hemorrhage
Table 3.
Comparison of positive rate according to type of intracranial hemorrhage
Table 4.
Difference in optical density (∆OD) and false-positive rate in postmortem inspection
| No. | Median (IQR) | False-positive rate (%) | |
|---|---|---|---|
| Frontal area | 59 | 0.12 (0.15) | 27.1 |
| Temporal area | 59 | 0.18 (0.30) | 47.5 |
| Parietal area | 59 | 0.20 (0.29) | 50.8 |
| Occipital area | 57 | 0.20 (0.24) | 50.9 |


 PDF
PDF ePub
ePub Citation
 Print
Print


 XML Download