

 PDF
PDF ePub
ePub Citation
 Print
Print


INTRODUCTION
It is reported that the prevalence of asthma, a serious chronic lung disease caused by chronic airway inflammation, has increased worldwide, and that aging increases the risk of developing asthma.123 In Korea, the estimated number of asthmatic patients was 2,220,000, and the number of deaths caused by asthma was 1,716 in 2010.45 It is noteworthy that the prevalence of asthma has increased especially in the population aged ≥50 years6 and that most countries, including Korea, face population aging. In addition, severe asthma (SA) is becoming a critical issue in the management of adult asthma worldwide as severe asthmatics are suffering from more frequent asthma exacerbations, emergency visits, and hospitalization requiring more frequent health care uses.7 Therefore, asthma, especially elderly asthma and SA will impose a significant burden on quality of life and health care costs.
The prevalence of asthma can be underestimated in epidemiological surveys and reports.8 Also, even when asthma is a primary cause of death, it may be listed as a secondary cause or omitted on death certificates. Asthmatic patients tend to have other chronic diseases,9 so asthma may not be recorded as a primary cause of death. Counting asthma deaths listed as a primary cause of death may result in asthma appearing to have a lower mortality rate.10
Previous studies have investigated asthma prevalence based on questionnaire responses, disease codes, and spirometric assessments.1112 However, the availability of real-world data has been granted and easily accessed, because the National Health Insurance Sharing Service (NHISS) was available to the public for research purposes in 2009 and its use was promoted in 2013 in Korea.13 Thus, this study used the NHISS database to examine trends in the prevalence, mortality, health care use and costs of asthma in real-world evidence settings. The objective of this study is to describe the prevalence and mortality of asthma and treatment patterns based on their disease severity and medications, which aids in establishing public health care policies on asthma management as well as guidelines for clinicians.
MATERIALS AND METHODS
Data sources and ethical approval
The National Health Insurance Corporation (NHIC) in Korea has established the NHISS database to provide openness and sharing of National Health Information. The NHISS database includes 1.3 trillion cases of qualification, insurance rate, medical check-up results, treatment details, elderly long-term nursing insurance data, clinic status, etc., which were utilized to analyze the prevalence and health care utilization of asthmatic patients in this study. For asthma mortality, customized NHISS data were linked to the Cause of Death Statistics from the Korean Statistical Information Service (KOSIS). This study was approved by the Institutional Review Board of NHIC and Ajou University Medical Center (approval No. AJIRB-MED-EXP-17-135). All of the patients' data were de-identified.
Study population and operational definitions
Asthma definition, treatment and systemic corticosteroid burst
Asthmatic patients were annually defined when patients 1) were at the age of 12 years or older, 2) had at least one diagnosis code of asthma (International Classification of Diseases, 10th Edition [ICD-10]: J45–J46) in the primary and fourth-order of secondary diagnosis, 3) received at least one of the following asthma medications: long-acting muscarinic antagonist (LAMA), long-acting β2-agonist (LABA), inhaled corticosteroids (ICS), ICS/LABA, short-acting muscarinic antagonist (SAMA), short-acting β2-agonist (SABA), xanthine, leukotriene receptor antagonist (LTRA), systemic corticosteroid, and oral beta-adrenergic agonist. Stepwise medication use was defined according to severity as follows: step 1, the main use of SABA or SAMA; step 2, use of ICS, LTRA, or xanthine; step 3, use of ICS/LABA alone, ICS + LTRA, or ICS + xanthine; step 4, use of ICS/LABA + LAMA, ICS/LABA + LTRA, or ICS/LABA + xanthine; and step 5, oral corticosteroid prescription with a duration of > 90 days following some modifications of the Global Initiative for Asthma (GINA) treatment guidelines. Systemic corticosteroid burst was defined as being prescribed 1 bottle of intravenous corticosteroid (100 mg of hydrocortisone or 125 mg of methylprednisolone) per day and/or oral corticosteroid (prednisolone equivalent dose) 15 mg/day for >3 consecutive days. The stepwise treatment was modified from GINA treatment guidelines. The combination of medication was the main criteria to classify the stepwise treatment. Although it is not simple to determine the treatment steps for an individual patient considering that treatment steps could be changed according to symptom variations, the stepwise treatment in this study was defined as follows. All prescriptions' records for the study subjects were reviewed. All kinds of anti-asthmatic medications (SABA, SAMA, ICS, LABA, ICS/LABA, LTRA, xanthine, oral corticosteroid) per prescription were listed, and the prescription days for oral corticosteroid were summed up. The treatment step was assigned at each prescription. If medications prescribed were changed (step-up or step-down according to symptom variability), the most frequently assigned step was selected for the analysis. If all steps were equally assigned for patients, the higher step was assigned for the analysis.
Asthma exacerbation and 4 asthma groups
Asthmatic patients with frequent exacerbations were classified as uncontrolled asthmatics (UCT), which was defined as those who had at least one of the following prescription histories: SABA ≥ 2 canisters per year, SABA nebulizer use for 3 consecutive days ≥2 times per year, systemic corticosteroids burst >2 times per year, or hospital admission for asthma ≥ 1 time per year with some modification of the European Respiratory Society and the American Thoracic Society guidelines.14 To further classify asthma groups, all medication records were carefully reviewed with prescription database by the pharmaceutical main ingredient code in this analysis. According to asthma exacerbation and regular treatment, 4 asthma groups were categorized: SA, untreated asthma (UT), well-controlled asthma (WC), and intermittently treated asthma (IT) groups. Patients were considered to adhere to regular treatment if patients had at least one of the following prescription histories: a medium to high dose of ICS ≥ 3 canisters, a medium to high dose of ICS/LABA ≥ 3 canisters, LTRA ≥ 90 days, or xanthine ≥ 90 days. The definition of regular treatment depends on prescription quantity/days as well as medication dosage. The SA group was defined if asthmatic patients have frequent asthma exacerbations even with regular treatments; the UT group was defined if asthmatic patients have frequent exacerbations without regular treatments; the WC group was defined if asthmatic patients adhere to regular treatment without any exacerbations; the IT group was defined if asthmatic patients do not adhere to regular treatment but with no exacerbations. According to the definition in this study, for instance, patients with medium-dose ICS or ICS/LABA but less than 3 canisters would be considered not to have adherence to regular treatment, therefore they would be classified to either the UT or IT group according to the presence of asthma exacerbations. Patients prescribed a low dose of ICS or ICS/LABA would be also classified to either the UT or IT group according to the presence of asthma exacerbations. The categorization of the asthma group is summarized in Table 1.
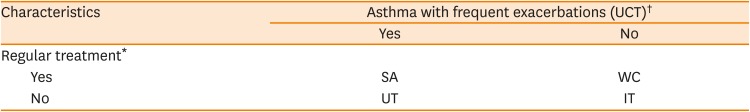
Table 1
The categorization of asthma groups based on exacerbation and adherence to regular treatment
| Characteristics | Asthma with frequent exacerbations (UCT)† | ||
|---|---|---|---|
| Yes | No | ||
| Regular treatment* | |||
| Yes | SA | WC | |
| No | UT | IT | |
UCT, uncontrolled asthmatics; ICS, inhaled corticosteroids; LABA, long-acting β2-agonist; LTRA, leukotriene receptor antagonist; SABA, short-acting β2-agonist; SA, severe asthma; UT, untreated asthma; WC, well-controlled asthma; IT, intermittently treated asthma.
*Regular treatment: i) a medium/high dose of ICS ≥ 3 canisters; ii) a medium/high dose of ICS/LABA ≥ 3 canisters; iii) LTRA ≥ 90 days; iv) xanthine ≥ 90 days. †Asthma with frequent exacerbations (UCT): i) SABA ≥ 2 canisters per year; ii) SABA nebulizer use for 3 consecutive days ≥ 2 times per year; iii) systemic corticosteroids burst > 2 times per year; iv) hospital admission for asthma ≥ 1 time per year.
![]()
Asthma mortality
Asthma-associated deaths were defined according to the prescription records of patients within 3 months before all-cause deaths were reported. Asthma-associated deaths were considered present if a patient was determined to have asthma and at least one of the following prescription histories: SABA ≥ 1 canister, ICS ≥ 1 canister, ICS/LABA ≥ 1 canister, LTRA ≥ 30 days, or xanthine ≥ 30 days within 3 months before all-cause deaths were reported. Among asthma-associated deaths, the asthma-contributing death was considered present if a patient's cause of death from Causes of Death Survey database was listed as respiratory disease (ICD-10 code: J00–J99). Because we investigated the prescription records within 3 months before all-cause deaths were reported, the trends of mortality were examined between 2003 and 2015.
Health care use and costs
Hospitals were categorized into tertiary, secondary, and primary care hospitals. Tertiary care hospitals in Korea should be met with certain qualifications and appointed by the Ministry of Health and Welfare. Secondary care hospitals include general hospitals, hospitals, and convalescent hospitals. Primary care hospitals include primary health clinics, public health centers, and branch offices of public health centers. The annual health care costs of asthma were comprised of 1) direct medical costs for inpatients and outpatient visits including Emergency Department visits; 2) direct nonmedical costs, i.e., the sum of transportation costs and caregiving costs; 3) indirect costs, i.e., productivity loss; and 4) medication costs. All health care costs except medication costs were considered according to the hospital type of service (outpatient and inpatient). Direct medical costs were the sum of hospital charges covered by the National Health Insurances and patients' copayment for inpatients and outpatient visits including Emergency Department visits. Transportation costs were round-trip transportation costs per health care provider visit multiplied by the number of total visits. The caregiving costs were caregiving costs per day multiplied by total days of hospital admission. The indirect costs were calculated for each group (age 15–59 and ≥ 60 years) by multiplying the loss of labor productivity per day by total days of hospital admissions only when asthmatic patients older than 15 years were admitted. Their calculation formulas15 are specified in Table 2. All costs are presented in United States dollars (USD), with the exchange rate of 1 USD = 1,000 Korean won.
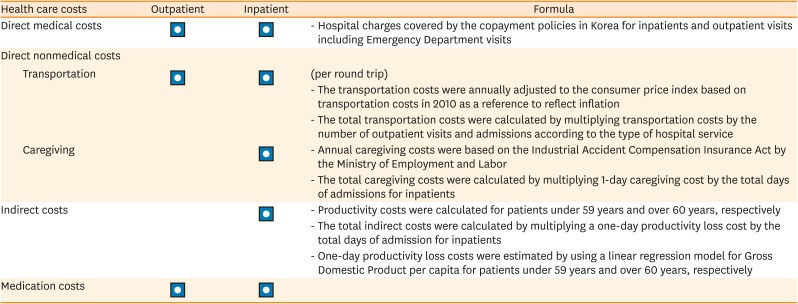
Table 2
The basic formula for calculating health care costs

![]()
Statistical analysis
Prevalence and mortality were age-standardized with 2005 midyear residents as a reference population to adjust for the population structure. Prevalence and mortality were presented with 95% confidence intervals (CIs), and calculated by using data from the NHISS and Statistics Korea database based on the following formula:
Prevalence = Number of patients meeting the definition of asthmatic patients Number of mid−year residents aged ≥ 12 years 
Mortality = Number of asthma − associated deaths or asthma − contributing deaths Number of mid − year residents aged ≥ 12 years
Data are presented as mean ± standard deviation, and a 2-sample t-test was performed to compare the significance of differences where applicable. A P value of <0.05 was considered statistically significant. All statistical analyses were performed using SAS software version 9.4 (SAS Institute Inc., Cary, NC, USA).
RESULTS
Patient characteristics
The data for patients (597,344 in 2002 to 1,130,530 in 2015) meeting the operational definition of asthma between 2002 and 2015 were extracted from the NHISS database, and then annual asthma cohorts were established each year of the study period. Asthma was more prevalent in females than in males all the years. Of asthmatic patients, 38.7% in 2002 to 44.1% in 2015 were aged ≥ 60 years, 11.9% in 2002 to 14.9% in 2015 were found to be uncontrolled in which 3.5% in 2002 to 6.1% in 2015 were categorized as the SA group. All-cause deaths were 1.5% in 2003 to 2.3% in 2015; of these, 66.3% in 2003 to 77.8% in 2015 were asthma-associated deaths and 21.2% in 2002 24.2% in 2015 were asthma-contributing deaths (Table 3).
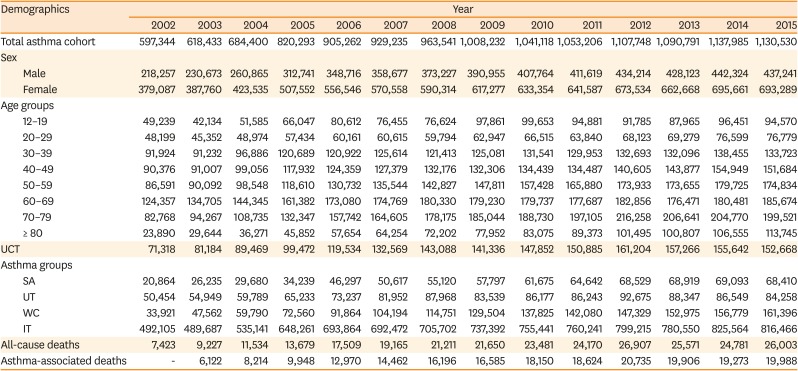
Table 3
Demographic data of asthmatic patients in Korea from 2002 to 2015
UCT, uncontrolled asthmatics; SA, severe asthma; UT, untreated asthma; WC, well-controlled asthma; IT, intermittently treated asthma.
![]()
Changes in asthma prevalence
The prevalence of asthma steadily increased by 1.4 times, 1.55% (95% CI, 1.542–1.550) in 2002 to 2.21% (95% CI, 2.207–2.215) in 2015; the rate of increase was similar between males and females. The female to male prevalence was higher than 1.4; 1.93% (95% CI, 1.928–1.940) in 2002 to 2.75% (95% CI, 2.748–2.761) in 2015 for females, 1.15% (95% CI, 1.149–1.159) in 2002 to 1.67% (95% CI, 1.667–1.677) in 2015 for males (Fig. 1A). Asthma was more prevalent in elderly patients aged ≥ 60 years (Fig. 1B). UCT increased from 71,318 (11.9%) in 2002 to 152,668 (13.5%) in 2015 with no differences between males and females (Fig. 2A); the proportion of elderly (over 60 years) was higher compared to other age groups, accounting for 50.6% in 2002 and 51.9% in 2015 which further increase in those over 70 years (Fig. 2C).
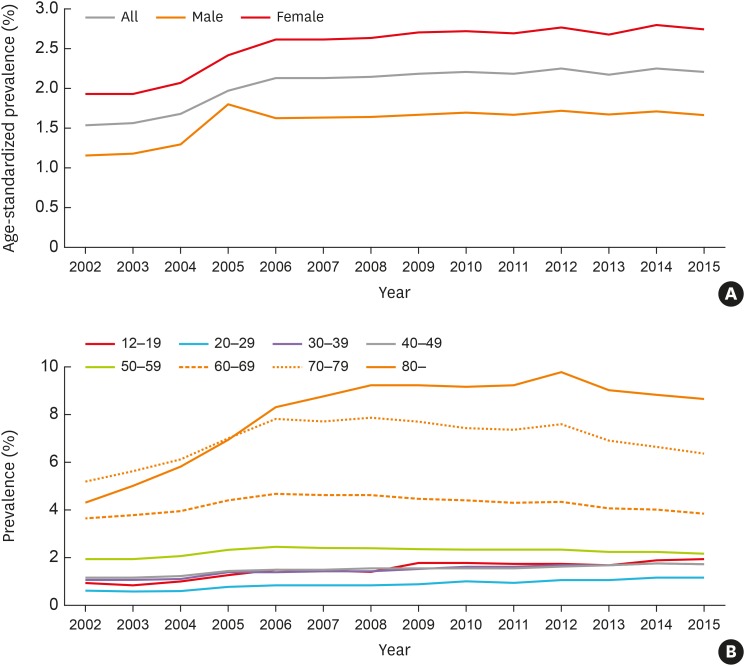
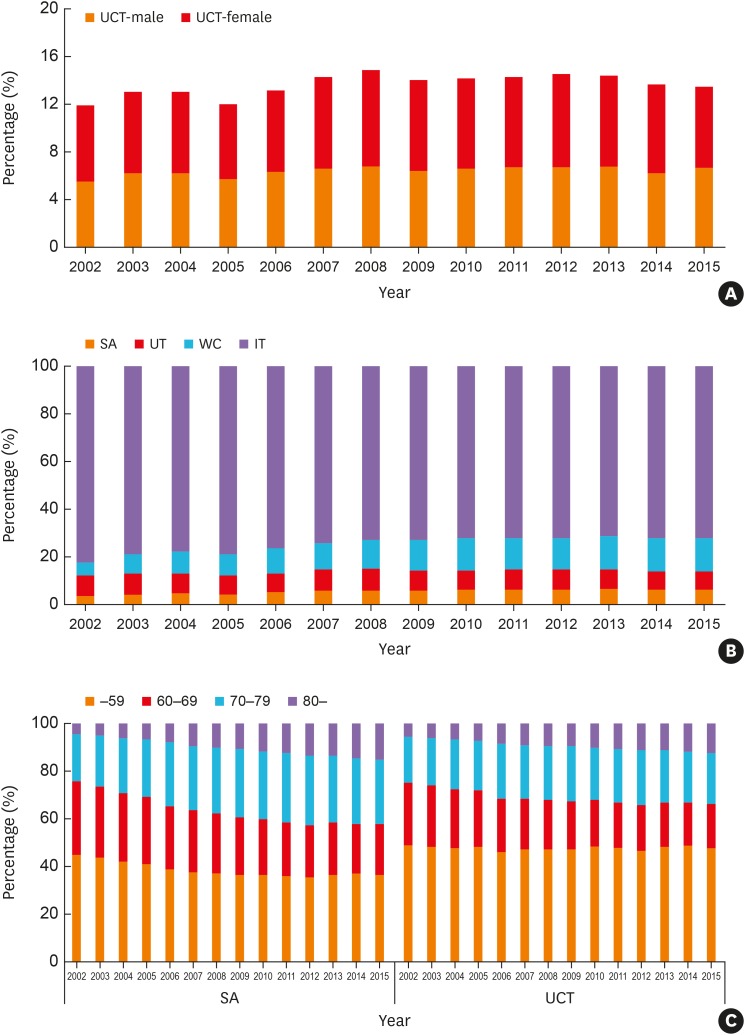
Most asthmatics belonged to the IT group, and the percentage of the IT and UT groups decreased steadily, 82.4% in 2002 to 72.2% in 2015, 8.5% in 2002 to 7.5% in 2015, respectively, while that of the WC group increased 2.5 times from 5.7% in 2002 to 14.3% in 2015. In addition, the SA group increased 1.7 times from 3.5% in 2002 to 6.1% in 2015 (Fig. 2B), among which the proportion of elderly asthmatics (over 60 years) increased from 54.7% in 2002 to 63.1% in 2015 (Fig. 2C), and the female-to-male ratio was consistently ≤ 1.0, indicating the larger numbers of males and the elderly in the SA group (Supplementary Fig. S1).
Asthma treatment
More than 60% of patients (60.2% in 2002 and 65.0% in 2015) had ≥ 1 prescription for systemic corticosteroids during each year of the study period. ICS/LABA inhaler use increased (8.6% in 2002 and 21.8% in 2015), but was used less often than other types of maintenance medications such as corticosteroids and xanthine (51.5% in 2002 and 50.3% in 2015).16 Systemic corticosteroids and xanthine uses were still high, which increased over the study period, even though it was not recommended for the treatment of asthma in the GINA guidelines.17 Oral maintenance medications, such as LTRA (11.3% in 2002 to 50.1% in 2015) and xanthine, were commonly prescribed in Korea. Uses of ICS/LABA inhaler (26.5% in 2002 to 49.2% in 2015), LTRA (26.2% in 2002 and 63.1% in 2015) and systemic corticosteroids (89.6% in 2002 to 85.5% in 2015) were increased in UCT (Fig. 3A); highest uses of ICS/LABA inhaler (55.6% in 2002 and 79.1% in 2015), LTRA (46.4% in 2002 and 76.4% in 2015) and systemic corticosteroids (90.1% in 2002 and 84.1% in 2015) were noted in the SA group. LTRA had been increasingly prescribed in the 4 groups and its uses in the IT group increased 5.6 times during the study period (7.9% in 2002 to 44.4% in 2015) (Fig. 3B).
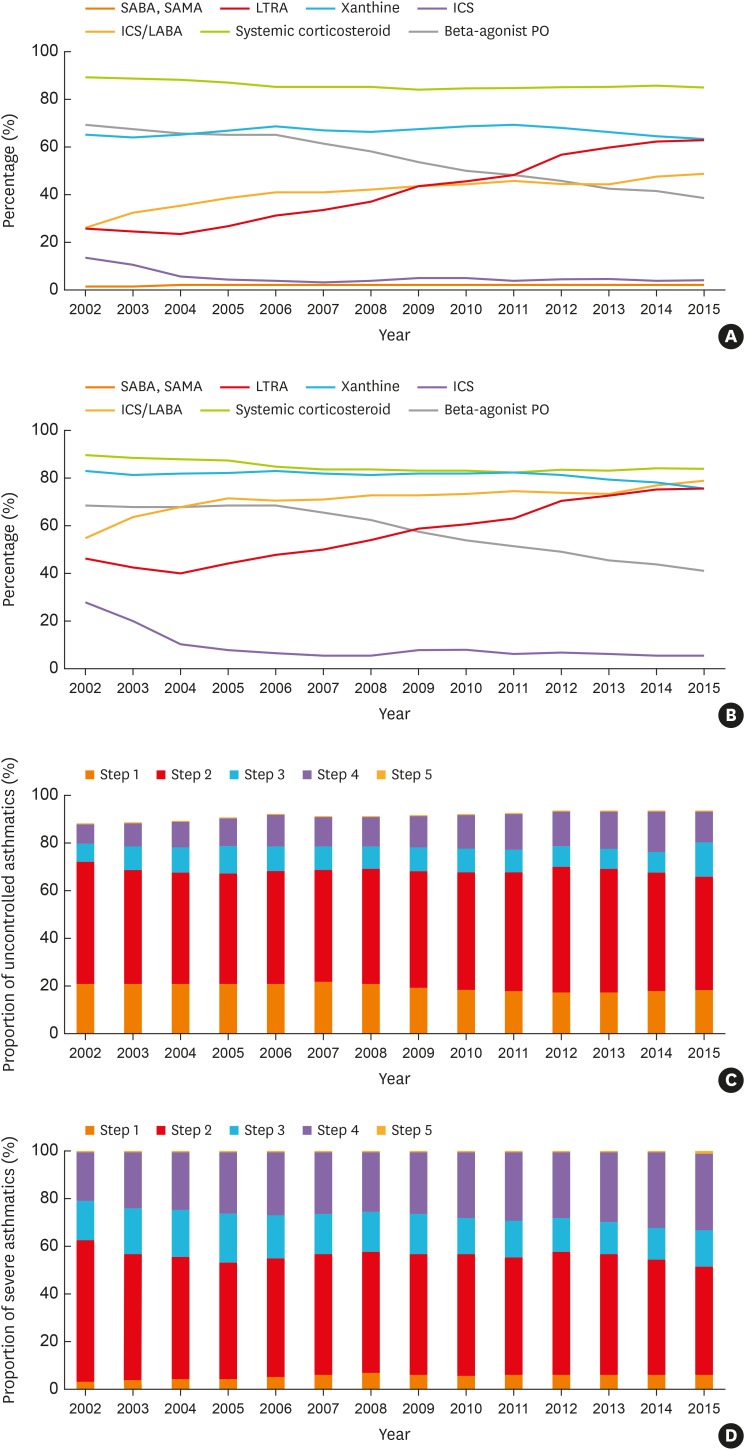
Fig. 3
Trends in the percentage of prescribed medications in (A) uncontrolled asthmatics and (B) the severe asthma group. The proportion of (C) uncontrolled asthmatics and (D) the severe asthma group according to treatment steps.
SABA, short-acting β2-agonist; SAMA, short-acting muscarinic antagonist; LTRA, leukotriene receptor antagonist; ICS, inhaled corticosteroids; LABA, long-acting β2-agonist; PO, by mouth.
![]()
Regarding the stepwise treatment pattern, 69.9% in 2002 and 72.3% in 2015 of asthmatics were treated according to step 1/2, and the proportion of patients treated with step 4/5 showed increasing trends, 3.0% in 2002 to 8.7% in 2015. However, of UCT, 72.3% in 2002 to 66.4% in 2015 were treated with step 1/2, although the proportion of UCT treated with step 4/5 increased 2.2 times (8.3% in 2002 to 18.2% in 2015) (Fig. 3C). Moreover, >50% of patients in the SA group were treated with step 1/2 (62.7% in 2002 to 51.6% in 2015), although the proportion of those with step 4/5 were highest and increased (20.5% in 2002 to 33.1% in 2015) (Fig. 3D).
Changes in asthma mortality
The rates of asthma-associated deaths and asthma-contributing deaths showed increasing trends unlike those from Statistics Korea (Fig. 4A). It was noted that the asthma-contributing death rate increased more than 2.9 times during the study period, 4.8 deaths per 100,000 (95% CI, 4.61–5.04) in 2003 to 13.8 deaths per 100,000 (95% CI, 13.48–14.17) in 2015. The asthma-associated death rate increased rapidly starting from the > 70-years age group. It was the highest in the > 80-years age group and remained stationary thereafter (Supplementary Fig. S2). The asthma-associated death rate increased from 16.2 deaths per 100,000 (95% CI, 15.75–16.56) in 2003, and reached the peak of 34.2 deaths per 100,000 (95% CI, 33.76–34.70) in 2012, and slightly decreased thereafter to 28.0 deaths per 100,000 (95% CI, 27.60–28.37) in 2015. The asthma-associated death rate was higher in males than in females (21.7 vs. 10.9 deaths per 100,000 in 2003, 32.6 vs. 21.8 deaths per 100,000 in 2015), whereas the number of asthmatic patients was higher in females than in males (Fig. 4B).
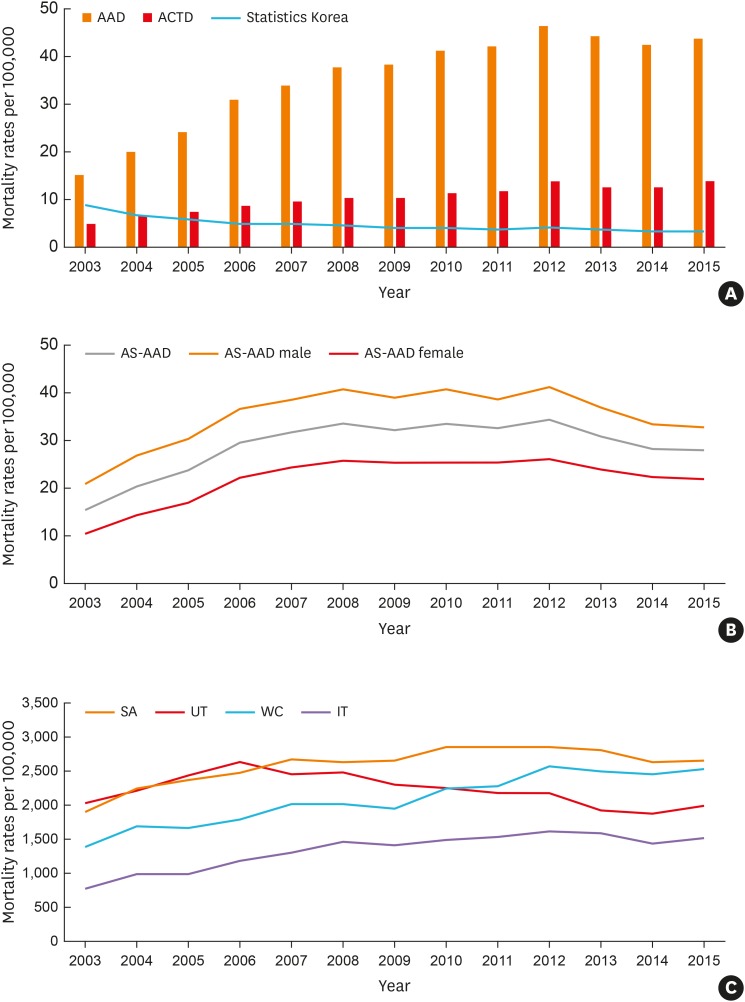
Fig. 4
(A) Asthma mortality rates, AAD, and ACTD, compared to those from Statistics Korea. (B) Trends of asthma-associated mortality rates per 100,000 in males and females. (C) Asthma-associated mortality rates per 100,000 by asthma groups.
AAD, asthma-associated deaths; ACTD, asthma-contributing deaths; AS-AAD, age-standardized asthma-associated deaths; SA, severe asthma; UT, untreated asthma; WC, well-controlled asthma; IT, intermittently treated asthma.
![]()
Moreover, the asthma-associated death rates were significantly higher in UCT, 19.83 in 2003 to 22.96 in 2015 per 100,000 patients, which increased with age. In addition, the SA group showed the highest asthma-associated death rate, presenting 1,917.3 per 100,000 asthmatics (95% CI, 1,749.73–2,084.84) in 2003 to 2,650.2 per 100,000 asthmatics (95% CI,2,528.20–2,772.19) in 2015; however, the ratio of asthma-associated deaths (the SA group to the IT group) decreased from 2.4 in 2003 to 1.7 in 2015 (Fig. 4C).
According to the Cause of Death Statistics from the KOSIS database, 10.7% of deaths listed asthma as a primary cause of death in 2003, and they steadily decreased to 4.9% in 2015. The leading cause of death in the asthma-associated deaths was neoplasms (37.3% in 2003, 30.1% in 2015, ICD-10 code: C00–D48), followed by diseases of the respiratory system (33.1% in 2003, 31.6% in 2015, ICD-10 code: J00–J99) and the circulatory system (13.4% in 2003, 16.1% in 2015, ICD-10 code: I00–I99) (Supplementary Fig. S3).
Health care use and costs
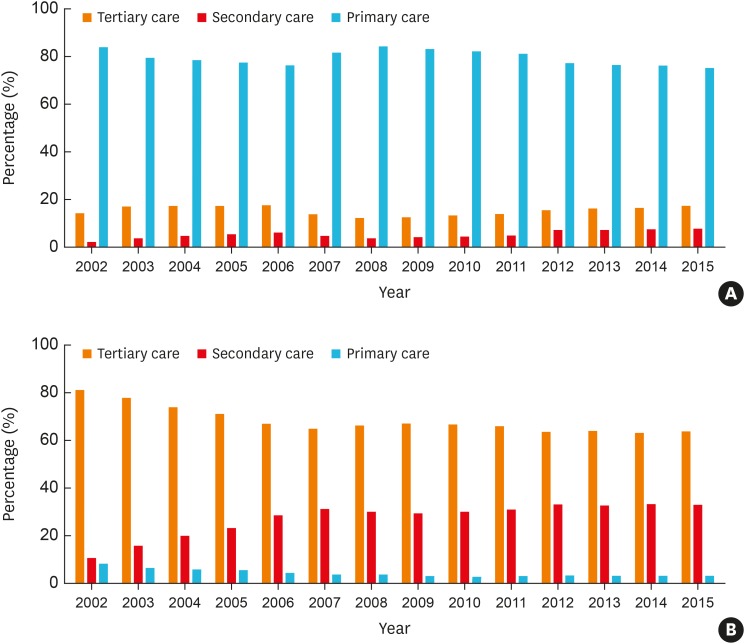
Most asthmatics received outpatient health services at primary care clinics (83.8% in 2002, 75.2% in 2015; Fig. 5A); however, they tended to receive more health services from secondary (2.1% in 2002, 7.6% in 2015) and tertiary care hospitals (14.1% in 2002, 17.3% in 2015). While hospitalization at tertiary care hospitals decreased (81.1% in 2002, 63.9% in 2015), hospitalization at secondary care hospitals increased (10.7% in 2002, 32.7% in 2015; Fig. 5B).
Compared to the IT + WC groups, UCT had more frequent visits at outpatient clinics per year (9.75 ± 5.76 times vs. 3.19 ± 3.36 times in 2002, 15.11 ± 16.12 times vs. 4.89 ± 7.64 times in 2015, P < 0.001) and longer hospitalization days (14.78 ± 21.55 days vs. 15.59 ± 21.23 days in 2002, 22.42 ± 43.18 days vs. 17.49 ± 33.93 days in 2015, P < 0.001). Moreover, the SA group had the highest health care uses (10.03 ± 4.94 clinic visits in 2002 to 14.05 ± 15.81 clinic visits in 2015; 17.96 ± 25.6 hospitalization days in 2002 to 24.57 ± 40.38 hospitalization days in 2015) compared to the WC group (7.65 ± 4.1 clinic visits in 2002 to 9.31 ± 9.85 clinic visits in 2015; 19.00 ± 29.01 hospitalization days in 2002 to 21.98 ± 37.78 hospitalization days in 2015).
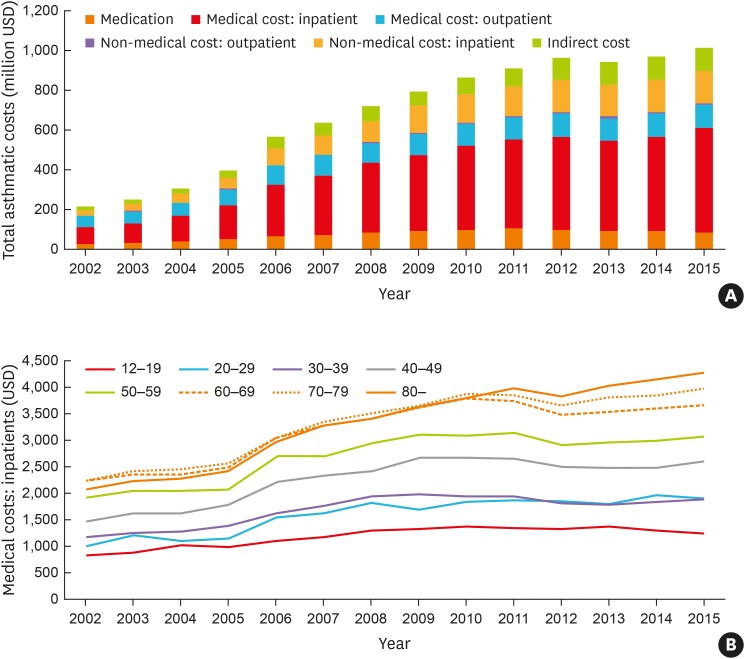
Total asthma-related costs steadily increased every year ($214 million in 2002 to $1,019 million in 2015) as direct medical costs for inpatients ($84 million in 2002 to $522 million in 2015) and indirect costs ($16 million in 2002 to $119 million in 2015) increased (Fig. 6A). The cost for outpatient clinic visits per capita was $30.0 in 2002 to $31.2 in 2015 over the past 14 years, but total costs for outpatient clinic visits nearly doubled over the past decade ($56 million in 2002, $119 million in 2015). The cost for inpatients per capita was $403 in 2002 to $528 in 2015, and total costs for inpatients were on a steep rise ($84 million in 2002 to $522 million in 2015). In particular, total costs for inpatients in the ≥ 60-years age group accounted for 50.6% in 2002 to 52.6% in 2015 of those over the past 14 years, which was significantly higher than in the < 59-years age group during the study period (Fig. 6B). Also, total costs for asthma-related prescriptions increased more than 3 times ($27 million in 2002 to $87 million in 2015). The direct non-medical costs, including transportation and caregiving costs, increased due to consumer price inflation. Likewise, the increase in indirect costs was inevitable with wage raise.
When total asthma-related costs were compared, the proportion of UCT accounted for 42.5% in 2002 to 35.7% in 2015; the asthma-related costs per capita were much higher in UCT (5.4 times in 2002 to 3.6 times in 2015) than those of the IT + WC groups, which further increased in the SA group (9.3 times in 2002 to 5.3 times higher in 2015) compared to 3 other groups. The total health costs for inpatients per capita were the highest in the WC group ($2,479 in 2002 to $4,072 in 2015), and even higher than in the SA group ($2,157 in 2002 to $3,856 in 2015). Nevertheless, the cost for outpatient clinic visits per capita in the SA group was the highest ($308 in 2002 to $330 in 2015) and 4.4–5 times higher compared to the WC group ($70 in 2002 to $66 in 2015). The cost of asthma-related prescriptions per capita in the SA group was the highest ($423 in 2002 to $408 in 2015) and 42 and 32 times higher in 2002 and 2015, respectively compared to those of the IT group ($10 in 2002 to $13 in 2015).
DISCUSSION
In many developing countries, asthma has been raised as a health issue associated with air pollution and fast industrialization, and its prevalence has been increasing.1819 The GINA report for 2019 also noted an increasing trend in asthma, and 339 million people suffer from asthma worldwide.20 This study found that the prevalence of asthma in Korea is steadily rising as in other developing countries. Considering that SA impacts on health care and carries a financial burden, we demonstrated that the prevalence of SA had been rapidly increasing during the past decade in Korea, especially in the elderly population. This increasing trend is consistent with those of previous studies,11162122 although the prevalence varied among surveys and analyses. This trend led to an increase in health care costs for asthma,23 especially for SA, and these costs are expected to further rise along with increases in the prevalence and morbidity of asthma in the elderly. With the aging population increasing, asthma needs to be re-evaluated and prepared in the overall disease structure and health care policy. Asthma can be a huge financial burden on society,24 so large-scale studies are needed to examine its trends and to properly treat asthmatics, especially elderly ones. We explored the prevalence and mortality in aspects of asthma exacerbations and regular treatment. This is the first study to demonstrate long-term changes in asthma prevalence (based on disease and prescription codes) and mortality from 2002 to 2015 based on the nation-wide data by comparing controlled vs. uncontrolled groups and regularly treated vs. not-treated groups, which helps understand current situations of SA in Korea.
It is not easy to extract exact asthma mortality because asthma-associated deaths have been recorded as less specific causes including chronic lower respiratory diseases,12 suggesting the possibility of underestimating asthma mortality. The GINA Dissemination Committee report documented that the asthma-associated deaths per 100,000 asthmatics in Korea were 4.9 in the 5- to 34-year age group each year.25 The present study demonstrated that asthma mortality has been increasing during the past 14 years, much higher than ever reported.26 One controlling factor may be the increasing proportion of elderly asthmatics because they have more comorbidities and are generally more reluctant to accept medical treatments.27 This could also suggest that some elderly asthmatics have various comorbid diseases, such as chronic obstructive pulmonary disease (COPD), and respiratory complications, such as pneumonia, which may contribute to higher mortality rates. To the best of our knowledge, this is the first study to report asthma-related mortality during the past 14 years at the national level in Korea. When we compared these asthma-associated deaths with the official records of Cause of Death Statistics published by Statistics Korea, it is evident that asthma-associated deaths have been underestimated for many years in Korea. Furthermore, asthma-associated deaths are higher in asthmatics with frequent exacerbations; severe asthmatics had 1.7 times higher mortality in 2015 (2.4 times in 2002) compared to the IT group. Considering that the elderly population is rapidly expanding worldwide28 and that the proportion of the elderly among severe asthmatics is increasing, more strict control of elderly asthmatics, including active intervention of comorbid conditions, is required for reducing the mortality of SA.
The GINA guidelines introduced the management of asthma and maintenance medications, such as ICS and/or LTRA, have been strongly recommended in adult patients with asthma.17 The present study showed that the use of ICS with or without LABA and/or LTRA (at least step 2 treatment) has been increasing since 2005. However, systemic corticosteroid/xanthine uses which are not recommended as maintenance medications in the GINA guideline is still used frequently. The proportion of patients who were prescribed xanthine was found to be 63.4%–69.8% in UCT; more than 85% of whom were also treated with systemic corticosteroids. Moreover, systemic corticosteroid uses in the WC and IT groups were considerably frequent (55.6%–61.8%). Previous studies evaluating current asthma management in Korea also found that the prescription rate of oral corticosteroids alone was as high as 40.6%.2930 These findings suggest that asthmatics, especially elderly asthmatics, prefer to take oral medications rather than the use of inhalers and demand systemic corticosteroids more frequently. Active education of physicians, patients, and allied health care professionals is needed to change prescription patterns according to the international guidelines.
Asthma symptoms vary as they are affected by various conditions and patients' behaviors.31 Previous studies reported that approximately 5% of asthmatics had persistent symptoms and were not well controlled despite long-term treatment with high-dose ICS.323334 In the present study, the number of the WC group increased (> 2.5 times) over the past 14 years and UT decreased from 8.5% in 2002 to 7.5% in 2015, whereas the SA group increased to 6.1% in 2015 (compared to 3.5% in 2002), indicating that some adult asthmatics are still not in controlled status in Korea, even though treatment guidelines are widely distributed, and anti-asthmatic medications and medical resources are easily accessible. For the effective control of the SA groups, biologics, as well as high-dose ICS/LABA and/or LAMA, can be recommended; however, active education of both patients and physicians are essential for reducing the proportion of UT patients, improving asthma control status, and reducing the prevalence and mortality of SA.
A systematic review reported that asthma-related costs have been increasing globally with age and severity.35 Total asthma-related costs were reported to be $7.2 billion in the US, $49 million in Singapore, and $1 billion in Korea in 2015.35. Because SA accounts for a larger portion of asthma-related costs,36 health care costs inevitably increase as more patients develop SA with age.37 A previous study reported that hospitalization is one of the most important factors for direct health costs.38 The present study confirmed that total asthma-related costs (as well as those per capita) steadily increased to > $1 billion in 2015 as both direct and indirect costs increased. In addition, the SA group showed more frequent clinic visits and longer hospitalization days as well as much higher asthma-related costs per capita. Elderly asthmatics (over 60 years) accounted for 50.6%–53.4% of UCT and 54.7%–64.3% of the SA group; among them, 66.7%–70.5% had ever hospitalized. Although medical costs for asthma treatment in Korea are relatively low and covered by national health insurance,39 there may be increases in health care costs in the future as the Korean population ages. With the proportion of elderly asthmatics increasing in the SA group, active interventions are required to prevent asthma exacerbation, reducing asthma-related costs and economic burdens.
This study used the NHISS database, health claims data from national health insurance to cover approximately 98% population in Korea,40 so its main strong point is that it analyzed a relatively large number of samples during such a long period. However, the definition of asthma, asthma groups, and treatment patterns were based on diagnosis codes and prescription records, and not by clinician judgment/information. The operating definition used in the present study may be wider in order to collect asthma-related data available for estimating the long-term prevalence/ mortality of asthma. Even one time visit of a patient having a prescription history of asthma-related medications could count an asthmatic patient according to our definition, although we could not analyze any association with clinical parameters such as lung functions. Since the prevalence of asthma was estimated mainly according to the operational definitions, it could differ from those of other studies using different operational definitions, which may make it difficult to generalize our findings to all clinic populations. In addition, the current data could include patients with asthmatics overlapping COPD if the patients having 2 diagnostic codes; however, fully excluding these patients from the analysis may reduce the efficacy to evaluate the various aspects of asthma trends, especially mortality. Patients with a diagnosis code of COPD (J44) alone were not included in the analysis, so that they remained and noted in the dataset. Finally, new asthma medications have been approved and prescribed for the recent years, which may increase the prevalence of asthma prevalence in this study. Despite these drawbacks, we suggest that this definition may be useful to evaluate trends in the long-term prevalence, mortality, healthcare use and costs of asthma in real-world evidence study settings. In regard to healthcare costs, the NHISS database does not include non-covered costs not paid by the government health insurance; therefore, non-covered costs can be omitted when calculating direct medical costs. We also we include direct non-medical costs of caregiving and transportation which occurs with hospitalizations alone, suggesting that total asthma-related costs could be underestimated. A more accurate estimation of total asthma-related costs can be accomplished with economic evaluation studies.
In conclusion, we demonstrated that the prevalence and mortality of asthma increase along with increasing burdens of health care uses/costs, which were much higher in SA. With the population aging, more active interventions, including changes in health care policy, are needed to reduce the prevalence and mortality of SA.
 XML Download