

 PDF
PDF ePub
ePub Citation
 Print
Print


INTRODUCTION
It has been established that the underlying pathologies of asthma are heterogenous, in terms of the inflammatory patterns seen in the airways; eosinophilic inflammation is present in over 50% of asthmatics, and neutrophilic and paucigranulocytic inflammation are present in all other asthmatics.1 Neutrophilic inflammation presents in a certain proportion of severe asthmatics who are relatively resistant to corticosteroid therapy, while eosinophilic inflammation dominates in those with reversible airway obstructions.23 In addition to environmental factors4567 such as ozone, particulate matter (PM), viral infections, endotoxins, occupational irritants, and cigarette smoke (CS), some microbial infections and types of colonization induce neutrophilic inflammation. For example, a Haemophilus influenzae infection in allergic airways drives chronic infection and is associated with the features of neutrophilic asthma.8
Moraxella catarrhalis or Streptococcus genera are dominant in cases of severe asthma with neutrophilic inflammation.910 A recent study in a relatively large number of sputum samples demonstrated that the sputum neutrophil percentage was positively correlated with the relative abundance of Moraxella, and negatively correlated with the abundances of Streptococcus I, Gemella, and Porphyromonas.11 Although these data indicate that the microbiome is influenced by the different phenotypes of airway inflammation, few studies have evaluated the relationship of microbial patterns and endotypes of asthma.
Immune responses in asthmatic airways are highly diverse and vary by inflammatory patterns. For example, T helper (Th) 2 cytokines (interleukin [IL]-4, IL-5, and IL-13) are responsible for eosinophilia1213 and Th1 (interferon [IFN]-γ) and Th17 (IL-17A) cytokines are responsible for neutrophilia. Additionally, upon recognition of pathogen-associated molecular patterns (PAMPs) or damage-associated molecular patterns (DAMPs), certain nucleotide-binding oligomerization domain (NOD)-like receptors (NLRs) form the inflammasome, which is followed by the release of mature IL-1β.14 Recent evidence shows that inflammasome levels increase in the neutrophilic asthmatic airways,15 and that severe neutrophilic asthmatics have different inflammatory cytokine and chemokine profiles that are associated with increased levels of chemokine (C-X-C motif) ligand 1 (CXCL1), CXCL10, C-C motif chemokine ligand 2, IL-6, and IL-8.16
The interaction of neutrophils and eosinophils with the microbiome in the asthmatic airways appears to be complex and bidirectional. As a first line of defense, neutrophils recognize bacteria and clear them via the secretion of antimicrobial peptides (AMPs), proteases,17 and neutrophil extracellular traps (NETs) that consist of extracellular DNA (eDNA), histones, and granular proteins such as LL-37.18 Therefore, we hypothesized that eosinophilic and neutrophilic inflammation in asthmatic patients would be associated with different microbiome profiles, reflected in Th2, Th1, and Th17 expression levels, and inflammasome-dominant immune responses. In the present study, the microbiome was measured via amplification of prokaryotic 16sRNA in DNA extracted from sputum cell pellets. Subsequently, the Th1 (IFN-γ), Th2 (IL-5 and IL-13), Th-17 (IL-17), and innate Th2 (IL-25, IL-33, and thymic stromal lymphopoietin [TSLP]) cytokines, the inflammasome (IL-1β), epithelial activation markers (granulocyte-macrophage colony-stimulating factor [GM-CSF] and IL-8), and inflammation (IL-6 and tumor necrosis factor [TNF]-α) were measured in sputum supernatants of asthmatics.
MATERIALS AND METHODS
Characteristics of the study participants
Asthma was diagnosed by physicians based on the Global Initiative for Asthma (GINA) guidelines19 according to fulfilment of 1 or more of the following criteria: an increase > 12% in forced expiratory volume in 1 second (FEV1) and an increase > 200 mL after inhalation of 400 μg of albuterol; a 20% reduction in FEV1 in response to a provocative concentration of inhaled methacholine (PC20 < 10 mg/mL); and/or an increase > 20% in FEV1 after 2 weeks of treatment with systemic oral corticosteroids (OCS) or inhaled corticosteroids (ICS).
All patients were recruited from a tertiary hospital. Current smokers, ex-smokers with >10 pack-years, and patients with asthma exacerbation in the 4 weeks prior to sputum collection at enrollment were excluded from the study. Demographic information, including enrollment age, sex, body mass index (BMI), tobacco consumption, age of asthma onset, and asthma duration, was collected at the baseline visit. Additionally, all patients underwent a standardized assessment that included a sputum analysis, complete blood cell count with differential count, serum total immunoglobulin E (IgE) level, chest radiography, spirometry, and allergy skin prick tests for 24 common inhalant allergens (Bencard Co., Brentford, UK). Atopy was defined as a mean wheal diameter ≥ 3 mm of the normal saline control on the skin prick tests.
Procedures for sputum induction and preparation
Sputum was induced by isotonic saline containing a short-acting bronchodilator and the samples were processed as previously described.20 Briefly, all samples with visibly high solidity were carefully placed in a pre-weighed Eppendorf tube and mixed with eight volumes of 0.05% dithiothreitol (Sputolysin; Calbiochem Corp., San Diego, CA, USA) in Dulbecco's phosphate-buffered saline (PBS). Then, a protease inhibitor (0.1 M methylene-diamine-tetra-acetic acid and 2 mg phenyl-methyl-sulfonyl-fluoride/mL) was added to the homogenized sputum at a ratio (v/v) of 1:100. Total cell counts were determined using a hemocytometer. The sputum cells were collected by cytocentrifugation and 500 cells were examined after being stained with Diff-Quick (American Scientific Products, Chicago, IL, USA). Samples that contained >10% squamous epithelial cells were excluded from the study. The remaining homogenized sputum samples were centrifuged at 1,000 g for 5 minutes and the supernatant was then collected and stored at −70°C for subsequent protein analyses.
Informed written consent, including for voluntary donations of blood and sputum samples to a biobank at Soonchunhyang University Bucheon Hospital, was obtained from all participants (schbc-biobank-2014-009-01 approved by the Ethics Committee of the hospital (SCHGM 2014-16). The study protocol was approved by the Institutional Review Board (IRB) of the Soonchunhyang University Hospital Ethics Committee (SCHBC 2015-08-025-005). Patients were categorized according to inflammatory subtypes as follows: neutrophil-dominant (neutrophils ≥ 60%, eosinophils < 3%; n = 23), eosinophil-dominant (neutrophils < 60%, eosinophils ≥ 3%; n = 20), mixed (neutrophils ≥ 60%, eosinophils ≥ 3%; n = 21), and paucigranulocytic (neutrophils < 60%, eosinophils < 3%; n = 19).
Procedures for DNA extraction, polymerase chain reaction (PCR), and pyrosequencing
DNA was extracted from 200 µL of cell pellets using QIAamp DNA Mini kits (Qiagen, Hilden, Germany) and then stored at −80°C until further processing. The extracted DNA was amplified using primers targeting the V3 to V4 regions of prokaryotic 16S rRNA21; the primers used for bacteria were 341F (TCGTCGGCAGCGTC-AGATGTGTATAAGAGACAG-CCTACGGGNGGCWGCAG) and 805R (GTCTCGTGGGCTCGGAGATGTGTATAAGAGACAGGACTACHVGGGTATCTAATCC) as previously reported.21 The PCR procedures were carried out as follows: initial denaturation at 95°C for 3 min followed by 25 cycles of denaturation at 95°C for 30 seconds, annealing at 55°C for 30 seconds, extension at 72°C for 30 seconds, and then a final extension at 72°C for 5 minutes. Amplicons were cleaned, indexed, and sequenced according to the Illumina MiSeq 16S Metagenomic Sequencing Library Preparation Protocol (Illumina, San Diego, CA, USA).
Quantification of cytokines
In cell-free sputum supernatants, the following cytokines were measured with ELISA kits according to the manufacturer's instructions: IL-1β (ab46052; Abcam, Cambridge, UK), IL-5 (ab46026; Abcam), IL-6 (KHC0061; Invitrogen, Camarillo, CA, USA), IL-8 (ab46032; Abcam), IL-13 (ab46038; Abcam), IL-17 (KAC1591; Invitrogen), IL-25 (EK0793; Boster Biotech; Pleasanton, CA, USA), IL-33 (SEB980Hu; Cloud-Clone Corp., Katy, TX, USA), TNF-α (ab46087; Abcam), TSLP (DTSLP0; R&D Systems, Minneapolis, MN, USA), GM-CSF (HCYTOMAG-60K; EMD Millipore, Darmstadt, Germany), and IFN-γ (HCYTOMAG-60K; EMD Millipore). Cytokine levels were normalized to protein concentrations in the sputum.
Data analysis
The 16S rRNA sequence data were processed as previously described.22 Briefly, chimeric sequences were detected using UCHIME (http://www.drive5.com/uchime/), and the EzTaxon-e database (http://eztaxon-e.ezbiocloud.net) was used to taxonomically assign the pyrosequencing reads. After quality filtering and chimera removal, the 16S rRNA gene amplicon sequence data were subsampled to a uniform depth of 20,000 reads based on rarefaction curve asymptotes and Good's coverage values. The numbers of operational taxonomic units (OTUs) and the Shannon index were calculated to evaluate biodiversity.11 OTUs were defined using an identity cutoff of 97%, because this threshold generally approximates a difference in 16S sequences among bacterial species.23 The normality of the distribution was tested with the Shapiro-Wilk test, between-group comparisons were performed using the Kruskal-Wallis test followed by post hoc analyses, and nonparametric assessments were conducted using the Mann-Whitney U test. All data are presented as medians with 25% and 75% quartiles. All statistical analyses were performed using SPSS software (ver. 20.0; SPSS Inc., Chicago, IL, USA) and P values < 0.05 were considered to indicate statistical significance.
RESULTS
Clinical characteristics of the study participants
Based on sputum samples, 83 asthmatics were classified into the following 4 inflammatory phenotypes: neutrophil-dominant (neutrophils ≥ 60%, eosinophils < 3%; n = 23), eosinophil-dominant (neutrophils < 60%, eosinophils ≥ 3%; n = 20), mixed (neutrophils ≥ 60%, eosinophils ≥ 3%; n = 21), and paucigranulocytic (neutrophils < 60%, eosinophils < 3%; n = 19). There were no significant differences among the 4 groups in terms of sex, age, age of asthma onset, smoking status, smoking amount, atopy, serum total IgE levels, BMI, or acute exacerbation rate (Table 1). As expected, there were significant differences among the groups in terms of the percentages of neutrophils (P = 2.17E-13), eosinophils (P = 1.13E-14), and macrophages (P = 4.69E-08) in the sputum. Additionally, there were significant differences in forced vital capacity (FVC; P = 0.001) and FEV1 (P = 3.38E-04) among the groups. However, the eosinophil and neutrophil groups had similar FVC and FEV1 values (Table 1). There were no significant differencea in the dosages of ICS or OCS used during the past year, or the 3 months prior to the sputum study, among the groups (Supplementary Table S1).
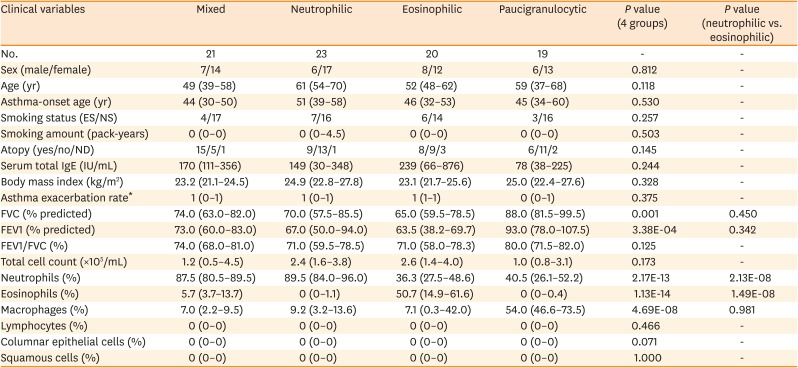
Table 1
Clinical characteristics of the study subjects
The normality of the distribution was evaluated using the Shapiro-Wilk test. Comparisons of the variables among the groups were performed with Kruskal-Wallis test and post hoc Mann–Whitney U test. P values < 0.05 were considered statistically significant. Data are presented as medians (interquartile range).
ES, ex-smokers; NS, never-smokers; ND, not determined; IgE, immunoglobulin E; FEV1, forced expiratory volume in 1 second; FVC, forced vital capacity.
*Asthma exacerbation rate developed in the 1st one year of follow-up.
![]()
Comparison of microbiota in the sputum among the 4 inflammatory types
There were significant differences among the 4 groups in the numbers of OTUs (P = 0.045), but not in the Shannon index (P = 0.418; Fig. 1). The numbers of OTUs were significantly higher in the mixed and neutrophilic groups than in the paucigranulocytic group (P < 0.05). Among the 4 inflammation subtypes, there were no significant differences in the proportions of bacteria at the phylum level for Proteobacteria, Firmicutes, Bacteroidetes, Actinobacteria, or Fusobacteria; the first 3 of these phyla accounted for more than 80% of the total microbial sequences (Supplementary Table S2). The Bacteroidetes Flavobacteriaceae family and Bacteroidetes Capnocytophaga genus showed significant differences between the 4 inflammation groups (read count > 0.5%, P < 0.05). The read counts of both Bacteroidetes Flavobacteriaceae family and Bacteroidetes Capnocytophaga genus were the highest in the eosinophilic group, and the lowest in the paucigranulocytic group (Supplementary Table S2). There were significant differences in the proportions of bacteria at the species level among the 4 inflammation subtypes (Fig. 2). Eighteen types of bacteria accounted for >0.5% of the total number of reads (Supplementary Table S3 and Supplementary Fig. S1) and 9 types exhibited significant expression differences among the four inflammation subtypes (P = 0.049-0.001). Of these 9 types of bacteria, Granulicatella adiacens, Streptococcus parasanguinis, Streptococcus pneumoniae, Streptococcus sinensis, Veillonella rogosae, Haemophilus parainfluenzae, and Neisseria perflava were significantly abundant in the eosinophilic group (P = 0.01 to 0.001), and Streptococcus JYGU_s was significantly abundant in the neutrophilic group compared to the other groups (P = 0.01, Table 2).
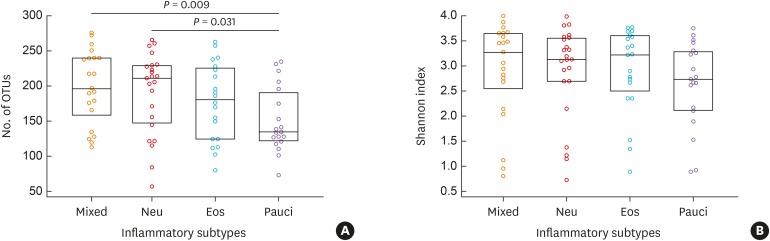
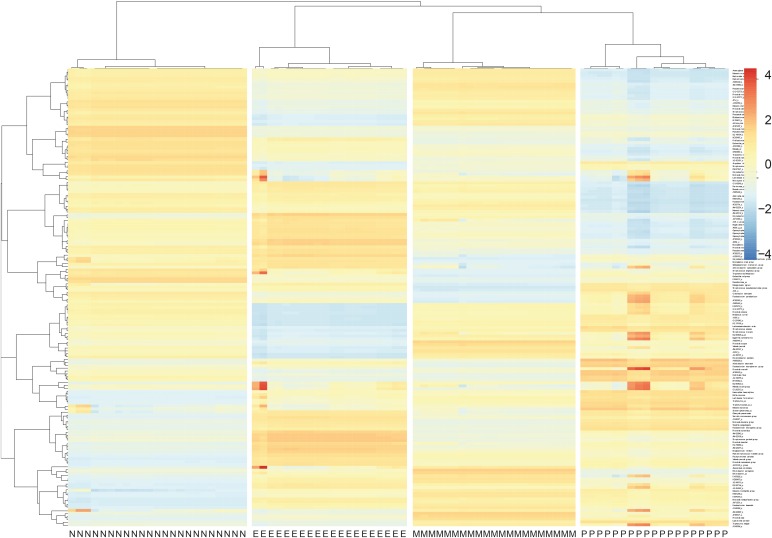
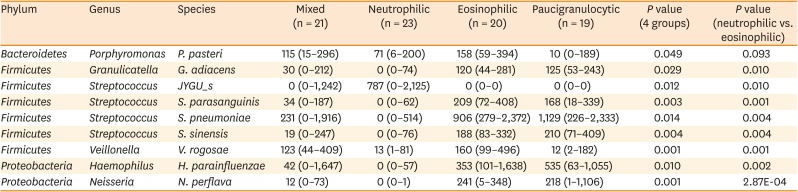
Fig. 1
Comparison of the OTUs numbers and the Shannon index among the four inflammatory subtypes: mixed (n = 21), Neu (n = 23), Eos (n = 20), and Pauci (n = 19). The normality of the data distribution was assessed with the Shapiro-Wilk test, between-group comparisons were performed using the Kruskal-Wallis test followed by post hoc analyses, and Mann-Whitney U tests were used to evaluate nonparametric data. All data are presented as medians with 25% and 75% quartiles.
OTU, operational taxonomic unit; Eos, eosinophilic; Neu, neutrophilic; Pauci, paucigranulocytic.
![]()
Fig. 2
Clustering and heatmap for microbial species among the four inflammatory subtypes.
M, mixed (n = 21); N, neutrophilic (n = 23); E, eosinophilic (n = 20); P, paucigranulocytic (n = 19).
![]()
Table 2
Comparison of normalized read counts of bacteria at the species level among the 4 inflammatory subtypes
The normality of the distribution was evaluated using the Shapiro-Wilk test. Comparisons of the variables among the groups were performed with Kruskal-Wallis test and post hoc Mann–Whitney U test. P values < 0.05 were considered statistically significant. Data are presented as medians (interquartile range) of bacterial reads.
![]()
Smoking status is similar between patients with eosinophilic and neutrophilic asthma (Table 1). Smoking, however, has been known to be an important factor for neutrophilic inflammation, and thus we compared the microbial abundance between 63 non-smokers and 20 smokers. The Shannon index was higher in non-smokers than in smokers (3.187 vs. 2.493, P = 0.044), but the number of OTUs was not different between the 2 groups (P = 0.363, Supplementary Table S4). Among the bacterial species occupying more than 0.5%, the smoking status is associated with different numbers of 3 bacterial species: Proteobacteria species, Neissetia subflava, Actinobacteria Rothia mucilagionosa, and Firmicutes V. rogosae. All normalized counts of them were higher in non-smokers than in smokers (P = 0.009 to 0.034, Supplementary Table S4). We further compared the microbial profile according to the amount of smoking; never smokers (0 pack-year, n = 63), light smokers (>0 and <10 pack-year, n = 13), and heavy smokers (≥ 10 pack-year, n = 7), regardless of current state of smoking (Supplementary Table S5). Alpha diversity was not significantly different between the 3 groups. The composition of abundant microbes was similar between non-smokers and light smokers, but that in heavy smokers was quite different with those of non-smokers and light smokers; 9 species were lower, but 5 species were higher in heavy smokers than in non-smokers and light smokers. The microbial abundancy in heavy smokers was similar with that of neutrophilic inflammation (Supplementary Table S5 and Table 2). Streptococcus JYGUs, which was the most abundant species in neutrophilic inflammation, was higher in heavy smokers than in non-smokers and light smokers, and G. adiacens, S. parasanguinis, S. pneumoniae, H. parainfluenzae, and N. perflava, which was rare species in neutrophilic inflammation, was lower in heavy smokers.
In an additional analysis to compare the microbial profiles between 38 atopic and 38 non-atopic subjects, the microbial diversity and abundancy was comparable (P > 0.05, data not shown).
Comparison of cytokine levels among the 4 inflammation subtypes and correlations of microbial read numbers, inflammatory cell percentages, and cytokine levels in the overall cohort
Significant differences among the four groups were observed in the levels of IL-1β (P = 0.006), IL-5 (P = 1.50E-04), and IL-13 (P = 0.004; Table 3). The neutrophilic group had higher levels of IL-1β (P = 0.001) while the eosinophilic group had higher levels of IL-5 (P = 0.001) and IL-13 (P = 0.001), compared to the other groups. Additionally, IL-5 and IL-13 had significant positive correlations with the percentage of eosinophils (r = 0.582, P = 2.29E-08 and r = 0.481, P = 1.45E-05, respectively; Fig. 3A and B) and IL-1β had a significant positive correlation with the percentage of neutrophils (r = 0.344, P = 0.002; Fig. 3C).
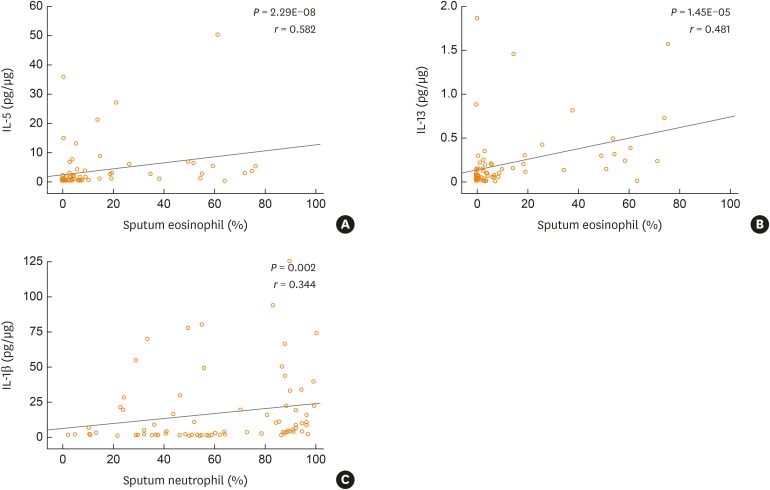
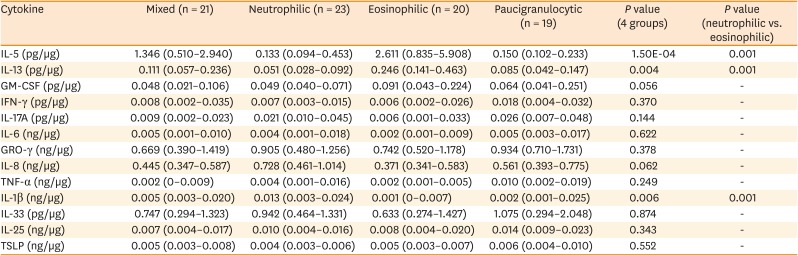
Fig. 3
Correlations between cytokine levels and the percentages of eosinophils and neutrophils in the sputum for the overall cohort (n = 83). The IL-5, IL-13, and IL-1β values were normalized to protein levels in the sputum. The normality of the data distribution was assessed with the Shapiro-Wilk test and statistical significance was evaluated with the Spearman's rho test. Values are presented as correlation coefficients (r) with P values.
IL, interleukin.
![]()
Table 3
Comparison of cytokine levels among the 4 inflammatory subtypes
The normality of the distribution was evaluated using the Shapiro-Wilk test. Comparisons of the variables among the groups were performed with Kruskal-Wallis test and post hoc Mann–Whitney U test. P values < 0.05 were considered statistically significant. Data are presented as medians (interquartile range).
IL, interleukin; GM-CSF, granulocyte-macrophage colony-stimulating factor; IFN, interferon; GRO-γ, chemokine (C-X-C motif) ligand 3; TNF, tumor necrosis factor; TSLP, thymic stromal lymphopoietin.
![]()
The percentage of sputum neutrophils was positively correlated with the level of Streptococcus JYGU_s (r = 0.277, P = 0.011) and negatively correlated with the levels of G. adiacens (r = −0.313, P = 0.004), S. parasanguinis (r = −0.390, P = 2.64E-04), S. pneumonia (r = −0.294, P = 0.007), S. sinensis (r = −0.396, P = 2.12E-04), H. parainfluenzae (r = −0.278, P = 0.011), and N. perflava (r = −0.336, P = 0.002; Table 4 and Supplementary Fig. S2). Additionally, IL-1β levels showed a trend toward a positive correlation with the read count of Streptococcus JYGU_s (r = 0.192, P = 0.095; Fig. 4A) and was negatively correlated with that of S. pneumonia (r = −0.269, P = 0.018; Fig. 4B). The percentage of sputum eosinophils was positively correlated with the levels of Porphyromonas pasteri (r = 0.311, P = 0.004) and V. rogosae (r = 0.334, P = 0.002; Table 4 and Supplementary Fig. S2), which were positively correlated with the IL-13 level (r = 0.334, P = 0.004 and r = 0.288, P = 0.013, respectively; Fig. 4C and D).
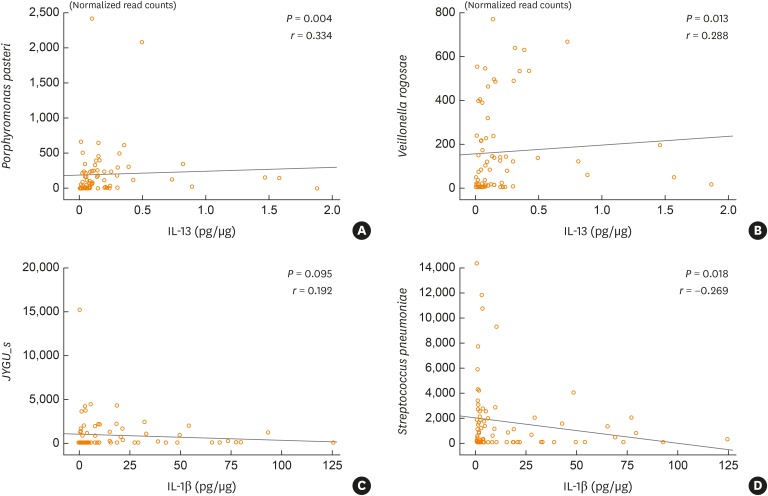
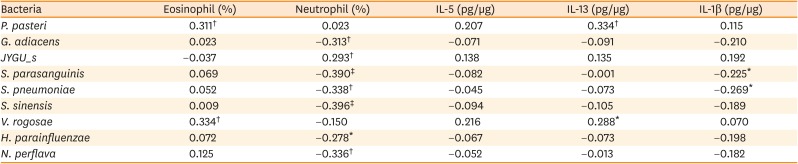
Fig. 4
Correlations between cytokine levels and bacterial normalized read counts for the overall cohort (n = 83). The normality of the data distribution was assessed using the Shapiro-Wilk test and statistical significance was evaluated with the Spearman's rho test. Values are presented as correlation coefficients (r) and with P values.
IL, interleukin.
![]()
Table 4
Correlations among eosinophil or neutrophil cell percentages, cytokine, and abundance of microbiome in sputum of the total subjects
The normality of the distribution was tested using the Shapiro-Wilk test. Statistical significance was assessed by using the Spearman's rho test. Values are presented as correlation coefficient value (r).
IL, interleukin.
*P < 0.05, †P < 0.01, and ‡P < 0.001.
![]()
DISCUSSION
In the present study, the 9 species of bacteria that accounted for >0.5% of the total number of reads significantly differed between the neutrophilic and eosinophilic inflammation groups. Of these nine bacteria, the level of Streptococcus JYGU_s was significantly higher in the neutrophilic group whereas the levels of the other species were significantly higher in the eosinophilic group, compared to the other groups. The percentage of eosinophils had a significant positive correlation with IL-5 and IL-13 levels, and was also correlated with the numbers of P. pasteri and V. rogosae. The percentage of neutrophils had a positive correlation with IL-1β level. Although the present study could not determine the cause-and-effect relationship between the microbiome profile and immune response in the 2 types of airway inflammation studies, the findings indicate that eosinophilic inflammation may be related to the Th2 immune response and a concomitant elevation in P. pasteri and V. rogosae whereas neutrophilic inflammation may be related to inflammasome activation with a concomitant elevation of Streptococcus JYGU_s.
Asthma endotypes represent immunological and physicochemical differences within the lower airways that are likely to be reflected in selective effects on microbial growth and airway clearance of lower airway microbiota.24 Compared to healthy persons, asthmatics exhibit higher amounts of proteobacterial species in induced sputum,25 oropharynx,26 bronchial lavage,27 and nasal epithelium,28 but decreased amounts of the Bacteroidetes,2629
Acinetobacter, and Firmicutes25 species. Thus, defining the relationships of inflammatory phenotypes with lower airway microbiota may provide information about the microbiome-related immune responses associated with different inflammatory subtypes.
In our study, the OTU of the paucigranulocytic group was lowest among the 4 inflammatory groups. The microbial diversity of asthma has been known to decrease compared to normal subjects. Among asthmatics, the microbiome diversity was reported to be higher in eosinopihilic asthma than in non-eosinophilic asthma.30 According to the definition of inflammatory patterns in asthma airway, non-eosinophilic asthma includes both neutophilic and paucigranulocytic asthma. It has also been reported that the bacterial burden was higher in neutrophilic asthma than in non-neutrophilic asthma.31 Taken together, these reports suggest that the microbial diversity may be lower in paucigranulocytic asthma than in eosinophilic and neutropihilic asthma, which is in accord with our observation. Paucigranulocytic asthma is a newly proposed subtype of asthma, of which underlying mechanism has largely been unknown.32 Due to the limited understanding of the pathobiology of paucigranulocytic asthma, the reason for the lowest microbial diversity in paucigranulocytic asthma should be investigated in further studies. We guess a possible explanation for the lowest OTUs in the paucigranulocytic group as follows: the increase in microbiome diversity may cause airway immune response followed by secretion of several cytokines and chemokines, which drive the infiltration and proliferation of neutrophils or eosinophils. Bacteria produce several metabolites which can affect immune cells and cytokine production. For example, long-chain fatty acid and D-tryptophan produced by commensal bacteria can induce the expression of IL-10 and Treg cell activity, but inhibit IL-8 production and Th2 type immune response.33 Thus, changes in metabolites resulting from ecological transformation of microbiome in the airways can cause alternations in immune regulation. In addition, neutrophil- or eosinophil-induced changes in airway environment are able to affect bacterial composition. All of them should be evaluated in further studies.
In contrast, diversity (based on the number of OTUs) was significantly greater in the neutrophilic inflammation group than in the paucigranulocytic inflammation group, but not in the eosinophilic inflammation group. This result does not accord with the findings of a recent study showing that neutrophilic asthmatics have less diverse and more dissimilar microbiome profiles than eosinophilic asthmatics.11 Additionally, in the present study, the number of abundant species was higher in the eosinophilic inflammation group compared to the neutrophilic inflammation group. Interestingly, this result also contradicts those of several previous reports. For example, it has been reported that neutrophilic asthmatics are more likely to host potentially pathogenic organisms identified using either culture-based or culture-independent approaches.89 Furthermore, lower bacterial diversity in conjunction with a high prevalence of Haemophilus influenzae is seen among neutrophilic asthmatics, whereas Tropheryma whipplei is abundant in eosinophilic asthmatics.10 The different microbial profiles observed among these studies may be due to difference in asthma severity, the medications used, and the relatively small numbers of study participants. For example, more than 50% of the participants in the present study were ICS-naïve and approximately one quarter were taking low-dose ICS for moderate-to-severe asthma prior to enrollment. In contrast, previous studies included patients with severe asthma who were treated with either ICS or OCS.34 Several other factors, including age, smoking status, BMI, and gender, may also have contributed to the difference in results between the present study and previous reports. Here, the microbial profiles did not differ between participants who were using versus not using ICS, or between those with FEV1 values > 80% and those with FEV1 values < 80% (data not shown). When comparing the microbial profile according to the amount of smoking, the microbial profile in heavy smokers was similar with that of neutrophilic inflammation. This observation supports the relationship between smoking and neutrophilic airway inflammation. Although our observation could not specify the primary cause of the microbial difference whether it is smoking or neutrophilic inflammation, it seems obvious that the amount of smoking can affect the airway microbiome. Furthermore, the effects of the residential environment should be considered. The rapid industrialization of Korea has caused overpopulation in the metropolitan area, including Seoul and Gyeonggi province, where the most of the study subjects live. According to the Korean National Statistics Office, about 22 million people live in Korea's 8 largest cities and about 10 million of these live in high-rise apartments,35 and most of which have separate heating systems. Because heating systems can emit polycyclic aromatic hydrocarbons36 and indoor dust, in which bacterial components, such as extracellular vesicles, can evoke inflammatory pulmonary diseases via infiltration of Th1 and Th17 cells,37 the distinctive residential characteristics in Korea may be a reason for the difference between the previous studies and ours. Thus, metagenomic profiling data should be analyzed according to other factors such as smoking status, diet, ethnicity, living conditions, and the degree of air pollution when seeking to identify diagnostic and prognostic markers.
The interactions of microbial agents with host cells seem to be important in the immune response of the airways. Interactions between microbes and the host immune response initially involve epithelial cells and dendritic cells although airway macrophages, intraepithelial lymphocytes, and other leucocytes also play a role. Dendritic cells are central in linking innate and adaptive immune responses and serve as master regulators of allergic inflammation.38 Group 2 innate lymphoid cells (ILC2) can be activated by microbes acting on Toll-like receptors (TLR) and do not require IgE-dependent triggering.39 Additionally, the exposure of epithelial cells to a range of insults causes them to activate ILC2 and trigger the production of IL-5 and IL-13, which could be important in the early stages of the allergic immune response. Both viruses and bacteria can activate nucleotide-binding oligomerization domain (NOD)-like receptors (NLRs), resulting in the assembly of inflammasomes and proteolytic activation of IL-1β and IL-18. Streptococci are able to invade epithelial cells, and the initial adherence of oral Streptococcus to these cells is likely to involve the antigen I/II adhesion family, stringent starvation protein A (SspA), and SspB.40 Additionally, epithelial cells are recognized as contributors to the Th2 mucosal immune response pathway via the production of TSLP, IL-25, and IL-33.41 In the present study, the eosinophilic inflammation group had significantly higher levels of IL-5 and IL-13 than the neutrophilic inflammation group while the levels of TSLP, IL-33, and IL-25 did not differ between these 2 groups. These data indicate the presence of adaptive Th2 or innate ILC2 activation, along with the absence of epithelial cell-derived innate responses, in patients with eosinophilic inflammation.
In the present study, IL-1β levels were significantly higher, and IL-8 levels showed a trend toward being higher, in the neutrophilic inflammation group compared to the eosinophilic inflammation group. IL-1 alpha (IL1A) and nuclear factor of kappa light polypeptide gene enhancer in B-cells (NFKB1) are activated in pharyngeal and lung epithelial cell cultures in response to infection with M. catarrhalis.42 Additionally, the colonization of H. influenzae is significantly and positively correlated with IL-8 concentrations and neutrophil counts in the sputum.10 Furthermore, increased secretion of pro-inflammatory cytokines, such as IL-6, IL-1β, and IL-8, and GM-CSF/CSF3 by airway epithelial cells and macrophages is characteristic of M. catarrhalis infections43 via TLR-2.44 Thus, the activation of inflammasomes by a particular type of microbiome may be a feature of neutrophilic inflammation.
Interestingly, commensal bacteria may have developed a mechanism to suppress immune responses using the cytoplasmic glycolytic enzyme enolase, which triggers the release of the anti-inflammatory cytokine IL-1045; however, IL-10 levels were not assessed in the present study. Some genes affect epithelial barrier function, and subsequently modify interactions between microbes and the mucosal immune system. For example, in an interactome study of microbial and human gene expression in pediatric asthma patients, Pérez-Losada et al.28 identified the core asthma signature (499 genes) of upstream regulator molecules associated with inflammatory and immune responses as well as the microbial genes involved in the metabolism, biosynthesis, and degradation of amino acids and their derivatives. The authors also reported that these asthmatic microbiomes are associated with increased expression of genes related to central carbohydrate metabolism and sugar alcohols as well as of genes involved in xenobiotic biodegradation and glycan biosynthesis. Accordingly, multi-omics analyses of host genomes, microbiomes and metabolomes, could be used to precisely define the associations of microbial profiles with the development of asthma and its subphenotypes.
Lung microbiota can directly or indirectly affect host immune response. In our results, abundance of 7 bacterial species was higher in eosinophilic asthmatics. Among them, S. pneumoniae has been widely believed to be associated with asthma via immune modulation. The expression of lymphocyte activation maker CD69 increased by S. pneumoniae antigen.46 CD69 plays an important role in the pathogenesis of allergen-induced eosinophilic airway inflammation and hyperresponsiveness,47 and inhibits Th17 cell differentiation through activating JAK3-STAT5 pathways.48 A proteomic study for G. adiacens revealed that the species secreted multiple enzymes involved in reactive oxygen species regulation, such as superoxide dismutase, NADH oxidase, and thioredoxin,49 which can modulate eosinophilic inflammation.5051 However, to our knowledge, no direct or indirect evidence for the linkage between eosinophilic inflammation and other bacteria species was identified in this study. Molecular and functional analyses of these species are essential for understanding the association between microbiome and airway inflammation.
In the present study, the percentage of sputum neutrophils was positively correlated with the Streptococcus JYGU_s level and negatively correlated with the levels of G. adiacens, S. parasanguinis, S. pneumoniae, S. sinensis, H. parainfluenzae, and N. perflava. Interestingly, patients with neutrophilic asthma demonstrate a blunted response to rhinovirus infections, such that their peripheral blood mononuclear cells produce less IFN-α than those of asthmatics with eosinophilic or paucigranulocytic inflammation.52 Taken together, these data and the present findings suggest that Streptococcus JYGU_s may induce neutrophil activation and that G. adiacens and H. parainfluenzae may be suppressed by neutrophils in asthmatic airways.
In the present study, eosinophil-dominant asthmatics exhibited a predominance of Streptococcus species, including S. parasanguinis, S. pneumoniae, and S. sinensis, relative to neutrophilic asthmatics. Because the present metagenomics analysis was performed using sputum, the samples were possibly contaminated by oral microbial agents, which represent a limitation of this study. However, to avoid this, sputum samples with <10% squamous cells were selected. Oral biofilm formation is initially characterized by the adhesion of early colonizers, which are composed of Streptococci,53 followed by the adhesion of later colonizers including both gram-positive and gram-negative bacteria. Veillonella species are gram-negative early colonizers of the oral biofilm.54 These 2 species were identified in the eosinophilic asthmatics of the present study. Interestingly, dual species biofilms with Streptococcus and Veillonella are less susceptible to antimicrobial treatments based on metabolic complementation.55
As well known, collection of sputum from normal persons is not always feasible. Thus, we could not collect the sputum of normal controls, especially never-smokers. In our previous experience, sputum collected from normal subjects consisted mostly of saliva, which may represent microbial profiles of the oral cavity. Thus, we omitted the analysis of normal samples which could not accurately represent microbial component of the lower airway. Nevertheless, the lack of normal samples may restrict biological interpretations of our observations to identify which species of microbes are ‘abnormal’ in airway inflammations. Other limitations of the present study include the relatively small number of samples from the asthmatic participants, and the lack of assessment of the consistency of the microbial profiles over time. Additional analysis to compare the microbial lead number at the species level among the 4 endotype clusters on the basis of Th1 and Th2 cytokines and inflammasome showed the similar result as seen in the microbial analysis of the present study between the groups. Although we have observed the inter-correlation between microbiome, inflammation, and cytokines, we could not specify the cause-and-effect relationship among them, which is another limitation of the study. Thus, the underlying mechanism of the inter-correlation should be evaluated in further studies.
In conclusion, the present study demonstrated that V. rogosae and P. pasteri may be related to eosinophilic inflammation via the production of IL-13, and that JYGU_s may be related to neutrophilic inflammation via the production of IL-1β. Thus, the difference in microbial patterns in the airways may induce distinct endotypes of asthma, which is responsible for neutrophilic or eosinophilic inflammation in asthma. Our study may contribute to understanding the relationship between microbiome and the type of airway inflammation, which is fundamental knowledge to control inflammation in asthma by targeting candidate microbes and to develop novel drugs and treatment strategies for uncontrolled asthma.
 XML Download