

 PDF
PDF ePub
ePub Citation
 Print
Print


INTRODUCTION
Asthma is a heterogeneous disease with diverse pathophysiological mechanisms. Since the first genome-wide association study was published in 2007,1 application of ‘-omics’ technologies, such as transcriptomics, epigenomics, proteomics, and metabolomics, in asthma studies has greatly expanded our understanding of asthma pathogenesis. The transcriptome represents the complete set of RNA transcripts that are produced by the genome under a specific circumstance or in a specific cell. Naturally, expression is necessary for a gene to act and thus transcriptome analysis helps us understand gene's functions. High-throughput methods, including microarray and bulk RNA sequencing (RNA-seq), provide a quick and effective way of identifying novel genes and pathways related to disease. In addition, recent advances in biostatistics based on machine learning approaches give us comprehensive tools to analyze transcriptome datasets that are frequently associated with large p and small n problems (a large number of genes and a small number of samples).2
One important thing to remember when we interpret results of transcriptome analysis is that gene expression is cell- or tissue-specific. For example, dysregulation patterns of asthma-related genes caused by interleukin (IL)-13 were differentially observed according to the cell types of the airway.3 This finding promotes the idea that each cell type plays a specific role in asthma pathogenesis.
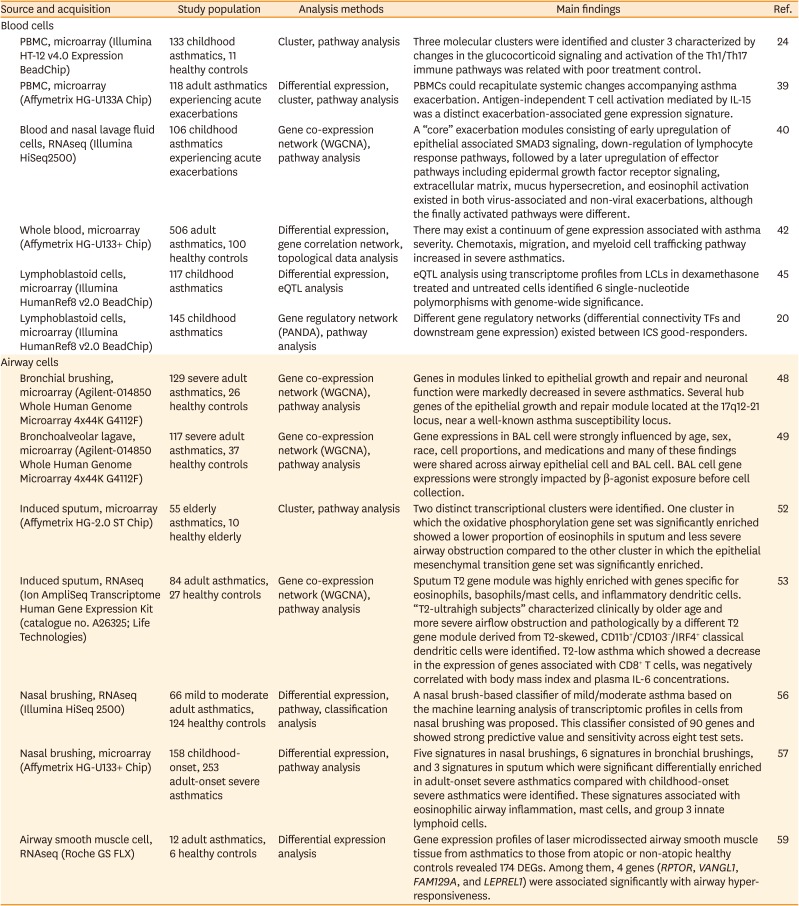
The purpose of this manuscript is to review transcriptom studies in asthma. First, we briefly review how to analyze transcriptome data (Figure) and next we provide a summary of recent transcriptom studies focusing on asthma pathogenesis and asthma drug responses. We categorize studies reviewed here into 2 classes based on the tissues utilized: blood cells (e.g. peripheral blood mononuclear cell [PBMC] and lymphoblastoid [immortalized] B cell [LCL]) and airway cells (e.g. cell obtained from bronchial brushing, bronchoalvelolar lavage [BAL], nasal brushing, or induced sputum and airway smooth muscle [ASM] cell biopsy). Notable findings are summarized in Table. In this review, we do not deal with small non-coding RNAs (e.g. miRNA, siRNA, etc.).
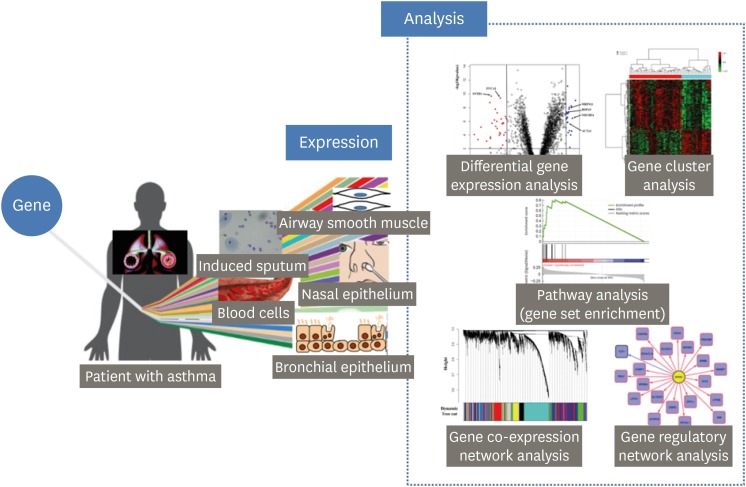 | FigureThe outline of asthma transcriptomic study.Gene expression is cell- or tissue-specific. Various cells can be used transcriptomics studies focusing on asthma pathogenesis and asthma drug responses; blood cells, cells from induced sputum, bronchial epithelial cells, airway smooth muscle cell, and nasal epithelial cells. A direct and intuitive method of transcriptome analysis is to evaluate differentially expressed genes between sample groups. A gene set enrichment is the way to assign additional meaning to a list or grouping of differentially expressed genes. Using a gene set, rather than an individual gene, we can deepen our understanding of underlying biological pathways and processes considering gene-gene interactions. Gene co-expression patterns can be extracted from transcriptome data as meaningful biological information and can be used for construction of edges in networks. Gene regulatory networks attempt to look beyond gene co-expression and to identify the influencing patterns of transcription factors on gene expression in a mechanistic fashion.
|
Table
Summary of asthma transcriptomic studies
| Source and acquisition | Study population | Analysis methods | Main findings | Ref. | |
|---|---|---|---|---|---|
| Blood cells | |||||
| PBMC, microarray (Illumina HT-12 v4.0 Expression BeadChip) | 133 childhood asthmatics, 11 healthy controls | Cluster, pathway analysis | Three molecular clusters were identified and cluster 3 characterized by changes in the glucocorticoid signaling and activation of the Th1/Th17 immune pathways was related with poor treatment control. | 24 | |
| PBMC, microarray (Affymetrix HG-U133A Chip) | 118 adult asthmatics experiencing acute exacerbations | Differential expression, cluster, pathway analysis | PBMCs could recapitulate systemic changes accompanying asthma exacerbation. Antigen-independent T cell activation mediated by IL-15 was a distinct exacerbation-associated gene expression signature. | 39 | |
| Blood and nasal lavage fluid cells, RNAseq (Illumina HiSeq2500) | 106 childhood asthmatics experiencing acute exacerbations | Gene co-expression network (WGCNA), pathway analysis | A “core” exacerbation modules consisting of early upregulation of epithelial associated SMAD3 signaling, down-regulation of lymphocyte response pathways, followed by a later upregulation of effector pathways including epidermal growth factor receptor signaling, extracellular matrix, mucus hypersecretion, and eosinophil activation existed in both virus-associated and non-viral exacerbations, although the finally activated pathways were different. | 40 | |
| Whole blood, microarray (Affymetrix HG-U133+ Chip) | 506 adult asthmatics, 100 healthy controls | Differential expression, gene correlation network, topological data analysis | There may exist a continuum of gene expression associated with asthma severity. Chemotaxis, migration, and myeloid cell trafficking pathway increased in severe asthmatics. | 42 | |
| Lymphoblastoid cells, microarray (Illumina HumanRef8 v2.0 BeadChip) | 117 childhood asthmatics | Differential expression, eQTL analysis | eQTL analysis using transcriptome profiles from LCLs in dexamethasone treated and untreated cells identified 6 single-nucleotide polymorphisms with genome-wide significance. | 45 | |
| Lymphoblastoid cells, microarray (Illumina HumanRef8 v2.0 BeadChip) | 145 childhood asthmatics | Gene regulatory network (PANDA), pathway analysis | Different gene regulatory networks (differential connectivity TFs and downstream gene expression) existed between ICS good-responders. | 20 | |
| Airway cells | |||||
| Bronchial brushing, microarray (Agilent-014850 Whole Human Genome Microarray 4x44K G4112F) | 129 severe adult asthmatics, 26 healthy controls | Gene co-expression network (WGCNA), pathway analysis | Genes in modules linked to epithelial growth and repair and neuronal function were markedly decreased in severe asthmatics. Several hub genes of the epithelial growth and repair module located at the 17q12-21 locus, near a well-known asthma susceptibility locus. | 48 | |
| Bronchoalveolar lagave, microarray (Agilent-014850 Whole Human Genome Microarray 4x44K G4112F) | 117 severe adult asthmatics, 37 healthy controls | Gene co-expression network (WGCNA), pathway analysis | Gene expressions in BAL cell were strongly influenced by age, sex, race, cell proportions, and medications and many of these findings were shared across airway epithelial cell and BAL cell. BAL cell gene expressions were strongly impacted by β-agonist exposure before cell collection. | 49 | |
| Induced sputum, microarray (Affymetrix HG-2.0 ST Chip) | 55 elderly asthmatics, 10 healthy elderly | Cluster, pathway analysis | Two distinct transcriptional clusters were identified. One cluster in which the oxidative phosphorylation gene set was significantly enriched showed a lower proportion of eosinophils in sputum and less severe airway obstruction compared to the other cluster in which the epithelial mesenchymal transition gene set was significantly enriched. | 52 | |
| Induced sputum, RNAseq (Ion AmpliSeq Transcriptome Human Gene Expression Kit (catalogue no. A26325; Life Technologies) | 84 adult asthmatics, 27 healthy controls | Gene co-expression network (WGCNA), pathway analysis | Sputum T2 gene module was highly enriched with genes specific for eosinophils, basophils/mast cells, and inflammatory dendritic cells. “T2-ultrahigh subjects” characterized clinically by older age and more severe airflow obstruction and pathologically by a different T2 gene module derived from T2-skewed, CD11b+/CD103−/IRF4+ classical dendritic cells were identified. T2-low asthma which showed a decrease in the expression of genes associated with CD8+ T cells, was negatively correlated with body mass index and plasma IL-6 concentrations. | 53 | |
| Nasal brushing, RNAseq (Illumina HiSeq 2500) | 66 mild to moderate adult asthmatics, 124 healthy controls | Differential expression, pathway, classification analysis | A nasal brush-based classifier of mild/moderate asthma based on the machine learning analysis of transcriptomic profiles in cells from nasal brushing was proposed. This classifier consisted of 90 genes and showed strong predictive value and sensitivity across eight test sets. | 56 | |
| Nasal brushing, microarray (Affymetrix HG-U133+ Chip) | 158 childhood-onset, 253 adult-onset severe asthmatics | Differential expression, pathway analysis | Five signatures in nasal brushings, 6 signatures in bronchial brushings, and 3 signatures in sputum which were significant differentially enriched in adult-onset severe asthmatics compared with childhood-onset severe asthmatics were identified. These signatures associated with eosinophilic airway inflammation, mast cells, and group 3 innate lymphoid cells. | 57 | |
| Airway smooth muscle cell, RNAseq (Roche GS FLX) | 12 adult asthmatics, 6 healthy controls | Differential expression analysis | Gene expression profiles of laser microdissected airway smooth muscle tissue from asthmatics to those from atopic or non-atopic healthy controls revealed 174 DEGs. Among them, 4 genes (RPTOR, VANGL1, FAM129A, and LEPREL1) were associated significantly with airway hyper-responsiveness. | 59 | |
PBMC, peripheral blood mononuclear cell; IL, interleukin; WGCNA, weighted gene co-expression network analysis; eQTL, expression quantitative trait locus; LCL, lymphoblastoid (immortalized) B cell; PANDA, passing attributes between networks for data assimilation; TF, transcription factor; ICS, inhaled corticosteroid; BAL, bronchoalvelolar lavage; DEG, differentially expressed gene.
![]()
Go to : 
HOW TO ANALYZE TRANSCRIPTOME DATA
General data analysis principles
As a general principle, quantiles of raw expression and principal components across arrays or sequences are examined before and after background adjustment normalization and log2 transformation and the results compared. This is to insure that the quality is comparable across the arrays. We recommend background adjustment, log2 transformation, and quantile normalization of the arrays. Probes should be annotated to the human genome. We recommend limiting the expression set to the annotated probes for autosomal chromosomes. Then, we recommend removing the expression of genes with variance less than 20% within arrays and account for the sources of expression heterogeneity and confounders (i.e., batch effect) using Surrogate Variable Analysis.
Gene set enrichment analysis
A direct and intuitive method of transcriptome analysis is to evaluate differentially expressed genes (DEGs) between sample groups. Genes can be ordered in a ranked list according to their differential expression between group types. Often investigators just look at fold changes in individual genes. While simple to do, the meaning of such data is problematic, since genes tend to operate coordinately in groups and a fold change may be a crude measure of effect. A gene set enrichment is the way to assign additional meaning to a list or grouping of differentially expressed genes.4 Using a gene set, rather than an individual gene, we can deepen our understanding of underlying biological pathways and processes considering gene-gene interactions. For example, a set of genes involved in oxidative phosphorylation showed a significant coordinate down-regulation in diabetic patients, but none of these genes were down-regulated by more than 20%.56 Eventually, it turned out that these genes were controlled by a specific PCG1A transcription factor that was itself down-regulated in diabetic patients, which lead to a deeper understanding of the regulation of the oxidative phosphorylation pathway in the disease.56 This finding would not have been revealed simply by differential gene expression analysis. Gene set enrichment analysis (GSEA), a specific knowledge-based approach, is now a standard method for the analysis of transcriptome data and has inspired the development of a large number of conceptually similar methods employing alternative ranking metrics, enrichment statistics, and significance estimation schemes.7 GSEA requires only gene set membership information to compute enrichment scores, handles the whole ranked list of genes, and retains the gene-gene dependency that may reflect underlying biology. All these features yield a reasonable compromise between sensitivity and applicability.7
Gene co-expression network analysis
Various molecular entities, such as genes, proteins and metabolites, as well as interactions between those components organize biological systems. These systems can be visualized as networks, also interchangeably recognized as acyclic graphs, in which components (e.g. genes) are nodes that are connected by edges (relationships between nodes).8 Gene co-expression patterns can be extracted from transcriptome data as meaningful biological information and can be used to construct edges in networks. A central feature of gene co-expression is that genes with similar, or correlated, expression patterns might influence each other, and be part of similar pathways or biological processes.9 Several algorithms have been developed and proposed including weighted gene co-expression network analysis (WGCNA),10 Partial Correlation and Information Theory,11 and gene co-expression network method.12 Gene co-expression networks enable us to identify co-expression modules. To test the biological importance of these modules, genes in the significant modules can be further assessed with gene set enrichment methods. Unexpectedly, we can encounter hidden biologically important genes in significant modules that were not captured by differential expression analysis (i.e. non-differentially expressed genes). This is known as a ‘guilt-by-association’ concept.13 A recent integrative analysis of blood transcriptome and metabolome data in childhood asthmatics to search for genomic signatures related to lung function is a good example of this type of analysis showing the potential usefulness of WGCNA.14
Gene regulatory network analysis
In statistics, it is said that correlation does not imply causation.15 Gene regulatory networks attempt to look beyond gene co-expression and to identify the influencing patterns of transcription factors (TFs) on gene expression in a mechanistic fashion.16 As reviewed elsewhere, the activation or repression of different TFs and their regulatory roles in gene expression may be one of the critical mechanisms underlying diverse asthma phenotypes and determining the responsiveness to therapy, particularly to anti-inflammatory drugs.17 The passing attributes between networks for data assimilation (PANDA) algorithm are an example method for constructing gene regulatory networks.18 PANDA begins with a model of TF-target gene interactions and uses message passing to update the network model given available transcriptome and protein-protein interaction data.19 PANDA is then able to compare the network models between experimental groups to explore transcriptional process differences.19 Recently, Qiu et al.20 found that TFs differentially affected gene expression in LCLs from childhood asthmatics between good and poor responders to inhaled corticosteroid (ICS) treatment by applying the PANDA algorithm.
Time series analysis
Transcriptome changes over time, and thus time series analysis present a unique opportunity to use the coordinated transcriptional response to environmental exposure to infer causal relationships between genes.21 Time series analysis are usually composed of 3 different settings; a single series time course to study a developmental transient pattern, a multi-series time course that interrogates multiple biological reactions to specific external stimuli at each time point, and a periodical time course in cell-cycle or circadian rhythmic data.22 There are several challenges to overcome in time series analysis. These data are generally high-dimensional and often exceeds the number of available time points and samples. As genes respond to exposure and return to baseline at different rates,23 it is difficult to find most reasonable time points. In addition, a static method of identifying differentially expressed gene has limitation in discerning temporal and spatial transcriptomic structure and analyzing complexity in dynamics.22 Different approaches and tools for time series transcriptome analysis have been developed, for examples, BETR,24 Next maSigPro,25 and EBseq-HMM.26 In general, more powerful algorithms, which so far have not been implemented due to technical infeasibilities, become more and more available.
Meta-analysis
Meta-analysis is a powerful approach to identifying differentially expressed genes in diseases of interest and combining information from multiple primary studies.27 Large sample sizes increase the statistical power to detect modest transcriptome changes. However, like the traditional systematic review, it is necessary to exclude incomparable studies in order to avoid bias in the analysis by adhering to the PRISMA guidelines.28 Multiple bioinformatics analyses are needed to carry out a meta-analysis, such as data quality check, inclusion of data from technical replicates, annotation of probes, and statistical procedures for meta-analysis. These steps were nicely summarized in other papers.2930 Currently, various programs are available for the meta-analysis of transcriptome data, for example, metaRNASeq,31 and BayesPoolMicro.32 There are also the user-friendly online platforms NetworkAnalyst33 and ExAtlas.34
Go to :
TRANSCRIPTOMICS STUDIES WITH BLOOD CELLS
It is thought that tissue-specific genes can be expressed in a non-tissue-specific manner,35 and blood cells express approximately 80% of the genes encoded by the human genome.36 Asthma is an immune-mediated disease, and blood contains many of the cells involved in immune responses. In addition, blood is an easily accessible tissue. For these reasons, blood cells have been widely used for asthma transcriptome studies, although they may not fully represent airway biology. Currently available transcriptome studies with blood cells have focused on molecular phenotyping of asthma and identification of genomics signatures related to asthma control and acute exacerbation. Cluster analysis of gene expression in PBMCs from 133 childhood asthmatics identified 3 molecular clusters with distinct inflammatory profiles.37 Among them, cluster 3 was characterized by changes in glucocorticoid signaling and activation of the Th1/Th17 immune pathways, and was related to poor treatment control.37 For asthma control status, it was reported that reproducible transcriptome components in blood existed in 1,170 adult asthmatics with varying degrees of control status and 2 biologic processes related to activation by triggering receptor expressed on myeloid cells 1 (TREM-1) and lipopolysaccharide would be optimal control genomic signatures.38 Comparing transcriptome profiles in PBMCs from 118 adult asthmatics between the stable and exacerbation states, Bjornsdottir et al.39 showed that PBMCs could recapitulate systemic changes accompanying asthma exacerbation from the view point of gene expression. Antigen-independent T-cell activation mediated by IL-15 was a distinct exacerbation-associated gene expression signature.39 Interestingly, a recent study revealed that “core” exacerbation modules consisting of early up-regulation of epithelial associated SMAD3 signaling, down-regulation of lymphocyte response pathways, followed by a later up-regulation of effector pathways including epidermal growth factor receptor signaling, extracellular matrix, mucus hypersecretion, and eosinophil activation existing in both virus-associated and non-viral exacerbations using transcriptome data in blood and nasal lavage cells from childhood asthmatics, although the finally activated pathways were different in the 2 tissues.40 An early transcriptomics study revealed a potential role of gene expression in PBMCs in identifying mechanisms underlying asthma severity.41 Recently, Bigler et al.42 analyzed blood transcriptome profiles in relatively well-characterized 498 adult asthmatics and found that both mild/moderate and severe asthmatics showed differential expression of similar gene sets, but severe asthmatics showed a greater magnitude of change. This finding suggested a possible continuum of gene expression associated with asthma severity. They also reported that chemotaxis, migration, and myeloid cell trafficking pathways increased in expression in severe asthmatics.42 Another important observation in this study was that the number of probe sets showing significantly differential expression reduced from 2,695 to 268 after repeated statistical adjustment for cell count with total white blood cell counts, monocytes, lymphocytes, neutrophils, and eosinophils as covariates to control cell-count effects.42 There is controversy concerning the value of adjustment for cell count in transcriptome studies. On the one hand such an adjustment could account for residual confounding due to cell count differences. On the other hand, this adjustment could be an over adjustment for cells considered to be in the causal pathway for asthma. An increasingly attractive approach is to focus on an individual cell type or to use single cell RNAseq in order to do cellular decomposition of whole blood. For examples, occasionally pure CD4+ or CD8+ T cells isolated from blood cells were utilized for transcriptome studies.43
Genome-wide gene expression profiling of in vitro drug perturbations has proven to be useful for drug discovery and elucidation of drug mechanisms of action.44 Using gene expression as a continuous variable, Qiu et al.45 conducted an expression quantitative trait loci (eQTL) analysis using transcriptome profiles from LCLs in glucocorticoid (dexamethasone)-treated and untreated cells derived from 117 childhood asthmatics. The authors identified 6 single-nucleotide polymorphisms as eQTLs with genome-wide significance. In addition, the same group reported that different gene regulatory networks (differential connectivity to TFs and downstream gene expression) existed between ICS good and poor ICS responders using the PANDA algorithm.20 They first sought differential connectivity between the 2 PANDA networks using transcriptome profiles in LCLs treated with dexamethasone or sham and then compared the PANDA networks between the good and poorresponders.20 Interestingly, it was reported that the dexamethasone-regulated genes significantly overlapped in primary B cells and LCLs from the same 6 childhood asthmatics as well as common genes showing significantly decreased expression in both cell types46 and were enriched in immune responses and pro-inflammatory signaling pathways. Taken together, these results suggest the glucocorticoid-induced perturbation of transcriptome profiles in LCLs may provide a potential predictor for glucocorticoid treatment responses in asthmatics.
Go to :
TRANSCRIPTOMIC STUDIES WITH AIRWAY CELLS
Needless to say, airway epithelium plays an important role in the pathogenesis of asthma, and thus transcriptome studies of airway epithelium can provide a direct window into the disease. A recent meta-analysis of airway epithelium (either bronchial or nasal epithelium) transcriptome data in 355 asthmatics and 193 controls identified 1,273 DEGs.47 Among them, 450 with large effect sizes were robust to study population differences in clinical profiles, and the magnitude of differential expression of these genes was highly similar in bronchial and nasal airway epithelia.47 GSEA revealed a number of consistently dysregulated biological pathways including putative transcriptional and post-transcriptional regulators.47 For severe asthma, Modena et al.48 performed WGCNA using transcriptome profiles in bronchial brushing samples from 155 subjects with asthma and healthy control subjects in the Severe Asthma Research Program (SARP) and found that genes in modules linked to epithelial growth and repair as well as neuronal function were markedly decreased in severe asthmatics. Interestingly, several hub genes of the epithelial growth and repair module were located at the 17q12-21 locus, a well-known asthma susceptibility locus, especially for childhood-onset asthma.55 Another study using BAL cells from 154 severe asthmatics and control subjects in the SARP showed that gene expression in BAL cells was strongly influenced by age, sex, race, cell proportions, and medications, and many of these findings were shared across airway epithelial (obtained from bronchial brushing48) and BAL cells.49 One gene module related to all indicators of severe asthma was enriched for cAMP signaling components, and an in vitro cellular model showed that this phenomenon might be related to exposure to β-agonists before cell collection.49 The authors concluded that changes in gene expression strongly impacted by β-agonist exposure might not relate to disease mechanisms, which suggests that medication effects should be considered when performing transcriptome studies.
Induced sputum noninvasively provides a good assessment of bronchial inflammation in asthma.50 Similar to previous cluster analysis of clinical features, unsupervised hierarchical clustering of gene expression in cells from induced sputum showed the potential to discriminate asthma subtypes at a molecular level (so-called transcriptional endotypes).51 Recently, Kim et al.52 aimed to identify biological pathways related to elderly asthma based on transcriptome profiles in sputum cells and identified 2 distinct transcriptional clusters. One cluster in which the oxidative phosphorylation gene set (one of the hallmark gene sets on MSigDB, version 6.0) was significantly enriched showed a lower proportion of eosinophils in sputum and less severe airway obstruction compared to the other one in which the epithelial mesenchymal transition gene set (again one of the hallmark gene sets on MSigDB, version 6.0) was significantly enriched.52 Considering that the pathogenesis of elderly asthma is still unclear, this study provides a small clue to help understand how elderly asthma develops. Like blood cells, sputum cells are a mixture of different cell types. To overcome this problem, Peters et al.53 first selected immune cell type-specific marker genes using transcriptome profiles from the human Immunological Genome Project and the Immune Response In Silico Project and then evaluated which immune cell type-specific gene sets were enriched in gene modules identified by WGCNA of transcriptome profiles in sputum cells from asthmatics. As a result, they found that the sputum T2 gene module was highly enriched with genes specific for eosinophils, basophils/mast cells, and inflammatory dendritic cells.53 In addition, they identified “T2-ultrahigh subjects” characterized clinically by older age and more severe airflow obstruction and pathologically by a different T2 gene module derived from T2-skewed, CD11b+/CD103−/IRF4+ classic dendritic cells.53 They also provided new insights into the T2-low asthma which showed a decrease in the expression of genes associated with CD8+ T cells, which was negatively correlated with body mass index and plasma IL-6 concentration.53
Previous reports have shown that there is shared airway biology between the upper and lower airways.5455 Considering the easy accessibility of the nose, a nasal biomarker of asthma is of high interest. A recent study proposed a nasal brush-based classifier of mild/moderate asthma based on the machine learning analysis of transcriptome profiles in cells obtained by nasal brushing.56 This classifier consisted of 90 genes and showed strong predictive value and sensitivity across the 8 test sets.56
There has also been an effort using integrative analysis covering heterogeneous airway samples. Hekking et al.57 searched for gene signatures discriminating adult-onset severe asthmatics from childhood-onset severe asthmatics using transcriptome profiles in cells obtained from nasal/bronchial brushing and induced sputum. They found 5 signatures in nasal brushings, 6 signatures in bronchial brushings, and 3 signatures in sputum samples that were significant differentially enriched in adult-onset severe asthmatics compared to childhood-onset severe asthmatics.57 These signatures were associated with eosinophilic airway inflammation, mast cells, and group 3 innate lymphoid cells.57
ASM abnormalities that include changes in cell number, size, phenotype, or function are central to the pathophysiology of asthma.58 However, due to technical challenges in obtaining ASM, there have been a limited number of transcriptome studies using this cell type. Yick et al.59 compared gene expression profiles of laser microdissected ASM from asthmatics to those from atopic or non-atopic healthy controls, and found 174 DEGs.59 Among them, 4 (RPTOR, VANGL1, FAM129A, and LEPREL1) were associated significantly with airway hyperresponsiveness.59 Kan et al.60 evaluated glucocorticoid-induced changes in transcriptome profiles in ASM from donors with fatal asthma and donors without asthma, and compared ASM-specific changes with 13 publicly available glucocorticoid-response transcriptome datasets corresponding to 7 cell types. They found that ASM has a distinct glucocorticoid-response signature compared to 6 other cell types although transcriptome changes in response to glucocorticoid exposure were similar in donors with and without fatal asthma.60
Go to :
CONCLUSION AND FUTURE DIRECTIONS
As Bigler et al.42 mentioned, sometimes a link between the identified transcriptome profiles to clinical aspects of disease have not been established. However, transcriptome studies aim to uncover underlying, fundamental aspects of asthma. The missing biological relevance of transcriptome profiles at present will likely come out in the near future as more sophisticated study designs and network modeling are applied to the data. To achieve this, a large prospective asthma transcriptomics study is essential, as most studies have been cross-sectional and done with a small number of asthmatics so far. In addition, integrative analysis covering transcriptome, epigenome, and metabolome should be encouraged. In this sense, future results from a large cohort of subjects in Europe (the Unbiased Biomarkers in Prediction of Respiratory Disease study; U-BIOPRED) characterized by comprehensive phenotyping and abundant biological samples are eagerly anticipated.
In 2002, the Nature family of journals adopted the minimum information about microarray experiments (MIAMEs) standard (developed by the Microarray Gene Expression Data Society),61 making it mandatory that all microarray data (including annotations) used in publishable research must be deposited in an acceptable public repository. As many other journals have adopted this policy, currently several public databases, such as NCBI Gene Expression Omnibus (GEO),62 ArrayExpress,63 and Center Information Biology Gene Expression Database (CIBEX),64 host thousands of free transcriptome data sets. In addition, there are many software tools developed for reanalysis or meta-analysis of publicly available datasets.6566 Researchers now have the opportunity to design specific questions and search for a previous transcriptome dataset to narrow down the list of candidate genes involved with asthma pathogenesis.
Recently, single-cell RNA-seq (scRNA-seq) has drawn a great deal of attention. This scRNA-seq examines the sequence information of the transcriptome from individual cells and help understand the higher resolution of cellular differences (e.g. picking up rare cell populations) and the function of an individual cell in the context of its microenvironment (e.g. tracking the trajectories of distinct cell lineages in a specific condition).67 For example, scRNA-seq on 36,931 individual cells isolated from the upper and lower airways and lung parenchyma of healthy control subjects and asthmatics has revealed that differences in the proportions and transcriptional phenotype of structural and inflammatory cells between upper and lower airways and lung parenchyma.68 When it came to samples from asthmatics, the investigators described new mucous ciliated cells and goblet cells that may have contributed to hyperplasia in the lower airway and also uncovered intraepithelial mast cells, pathogenic effector Th2 cells, and type 2 cytokine immune cells in those with asthma, along with broader shifts in the cell-cell interactions and diminished structural cell communication in the lung.68 Furthermore, scRNA-seq technologies are still developing. Although many issues on single-cell isolation, library preparation, and computational analysis pipelines are needed to be settled,69 scRNA-seq will greatly contribute to the fields of transcriptomics and personalized medicine.
In this review, we acknowledged that transcriptomic studies may help predict asthma risk and response to treatment. We believe, by using unbiased analysis approaches, novel insights into asthma pathogenesis can be anticipated in asthma transcriptome studies.
Go to :
 XML Download