

 PDF
PDF ePub
ePub Citation
 Print
Print


INTRODUCTION
The human face is the area of the head between the trichion superiorly and menton inferiorly, and between the two ears. Among all factors about an individual for having a positive first impression, aesthetically appealing face, in addition to an attractive smile, ranks uppermost [1]. The face is divided into three horizontal thirds: upper, middle and lower thirds. The linear distance from: the hairline (trichion) to the glabella, is the upper third; the glabella to the subnasale, is the middle third; and the subnasale to the menton is the lower third [2].
Few studies have been conducted on horizontal facial third [1,2,3,4]. There is a dearth of empirical studies on horizontal facial thirds of the face, more so in Africa and indeed Nigeria. This will militate against facial recognition of an individual through ethnic or racial facial profile, and the provision of objective dimensions in preoperative assessment of facial rejuvenation surgery of the horizontal facial thirds.
The purpose of this study was to:
i . provide normative data on the horizontal facial thirds of the face;
ii. compare the horizontal facial thirds, which represent facial heights of the Izon and Urhobo ethnic groups;
iii. compare the horizontal facial thirds of males and females the Izon and Urhobo, so as to establish if there is a difference between them; and
iv. also compare the results of the present study with those of previous ones.
The results obtained from this study will be useful to the aesthetic facial and oral maxillofacial surgeons as well as the orthodontists in facial surgery. It will also be of significance in anthropology for human identification using facial features.
MATERIALS AND METHODS
The descriptive method of the quantitative design was used. All undergraduates, 18~30 years old, of Izon and Urhobo ethnic groups in the Delta State University and Niger-Delta University formed the study population. The systematic sampling technique was used to select 530 subjects; 250 Izon (127 males and 123 females), and 280 Urhobo (130 males and 150 females).
All subjects gave informed consent prior to participation based on Helsinki Declaration as revised (WMA, 2001) [5]. Also, the Research and Ethics Committee of Faculty of Basic Medical Sciences approved the Methods adopted.
Measurements of horizontal facial thirds
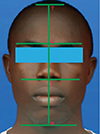
Each subject was made to sit upright with the face well positioned for the eyes to be in Frankfurt horizontal plane. The following landmarks were identified and marked off: trichion (T), glabella (G), subnasale (S) and menton (M) (Fig. 1). The lengths of the upper third (T-G), the middle third (G-S) and lower third (S-M) of the face were measured in millimeters (mm) with the digital sliding caliper (Mitutoyo, Japan).
Only subjects who were healthy, without facial abnormalities were included in the study. Another inclusion criterion for the subject was that both parents were from the particular ethnic group under consideration. Exclusion criteria included subjects with clinical history of surgery of the face and congenital abnormality of the face.
Analysis of data was done with IBM SPSS statistic 23. In order to summarize the data, descriptive statistics such as mean and standard deviation were used; while test of significant mean difference between males and females was done with the unpaired samples t-test. One way analysis of variance (ANOVA) was used to find out significant mean differences among horizontal facial thirds, and the post hoc Tamhane for multiple comparison of horizontal facial thirds. Statistical significance was fixed at p<0.05.
RESULTS
Demographic study showed that 47.2% of the entire participants were Izon while 52.8% were Urhobo. Izon males constituted 50.8% and females 49.2% of the ethnic group, with a mean (SD) age of 22.59 (3.35) years. Also, 46.4% and 53.6% of the Urhobo were males and females, respectively, with a mean (SD) age of 22.40 (2.62) years.
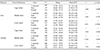
Table 1 showed a comparison of facial thirds between between males and females in both the Izon and Urhobo. The mean length of each third of the face was significantly longer in males than in females (p<0.05), except the middle third of the Urhobo in which female was longer but the difference was not significant (p>0.05). Table 1 also showed the total data in each ethnic group in decreasing order of facial proportion was: lower third>upper third>middle third for the Izon; lower third>middle third>upper third for the Urhobo.
Comparison of combined data for the three facial thirds between the two ethnic groups indicated that the mean length of the upper third (see Table 1) was significantly longer in the Izon than the Urhobo (t=−2.672; p=0.008). This is similarly so for the lower facial third (t=−3.676; p<0.001). For the middle facial third, the mean length (see Table 1) was significantly longer in the Urhobo than the Izon (t=3.084; p=0.002). Furthermore, comparison of mean male data for the facial thirds between the Izon and Urhobo indicated that the mean length of the male lower third (see Table 1) was significantly longer in the Izon than the Urhobo. (t=7.167; p<0.001), but there were no significant ethnic differences in the male data for the upper third (t=1.942; p=0.053) and middle third (t=−0.263; p=0.793). When the mean female data were compared between the Izon and the Urhobo (see Table 1), it was observed that Urhobo females had significant longer middle third than the Izon females (t=−3.958; p<0.001), but there were no significant ethnic differences in the female data for the upper third (t=1,637; p=0.103) and lower third (t=−1.818; p=0.070).
One way analysis of variance (ANOVA) showed there were significant differences among the three horizontal facial proportions in the combined data: p<0.001 (F=248.34) for the Izon and p<0.001 (F=145.45) for the Urhobo. Table 2 showed post hoc multiple comparisons using Tamhane statistic. Among the Izon, the lower third was statistically significantly longer than the upper third and middle third (p<0.05), while the upper third was also significantly longer than the middle third (p<0.05). Among the Urhobo, the lower third was statistically significantly longer than the middle third and upper third (p<0.05), but there was no significant difference between middle third and upper third (p>0.05).
Considering gender, the ANOVA showed there were significant differences among the three horizontal facial thirds in both males and females data: p<0.001 (F=310.73) in males and p<0.001 (F=54.76) in females of the Izon; and p<0.001 (F=91.23) in males and p<0.001 (F=65.62) in females of the Urhobo. Table 3 showed multiple comparisons of horizontal facial thirds in both genders. In Izon males, the lower third was significantly longer than the upper and middle thirds, while the upper third was significantly longer than the middle third. In Izon females, the lower third was significantly longer than upper and middle thirds, but the upper third was not significantly longer than the middle third. In Urhobo males the lower third was significantly longer than the upper and middle thirds, but the upper third was not significantly longer than the middle third. In Urhobo females, the lower third was significantly longer than the middle and upper thirds, while the middle third was significantly longer than the upper third.
DISCUSSION
In this study, the upper and lower thirds of the Izon and Urhobo are similar as they were significantly longer in males than females. However, while the middle third of the Izon showed no significant gender difference, that of the Urhobo was significantly longer in females than males. In addition to aforementioned ethnic variations, the differences observed whereby upper and lower thirds are significantly higher in the Izon than the Urhobo, contrary to the lower third situation, could be related to population differences between the two ethnic groups and genetics, as the Izon and Urhobo are coastal and inland dwellers respectively. This same reason is attributed to the longer lower third in Izon females and longer middle third in Urhobo females.
Generally, while the lower third is longer than the upper third which in turn is longer than the middle third in the Izon; the lower third is longer than both middle and upper thirds, but no difference between the middle and upper thirds of the Urhobo ethnic group.
In both Izon males and females, the lower third is longer than the upper and middle third, but while the upper third is longer than the middle third in males, in females, there was no difference between upper and middle thirds. Similarly, in both Urhobo males and females, the lower third is longer than the upper and middle third. However, while there was no difference in length between the upper and middle thirds in males, the middle third in females is longer than the upper third.
Previous studies on facial thirds had reported varied results [3,4,5,7,8]. In a study of horizontal facial thirds in Belgrade, Serbia, on anonymous and attractive females, Milutinovic et al. [1] observed that ANOVA was not significant for the attractive females, but significant for the anonymous females. Nonetheless, a post hoc multiple comparison showed no statistical significance between each pair of the horizontal thirds.
Fathallah et al. [6] in a study on vertical and horizontal facial measurements of the Sermites, Arian and mixed races in Basrah, reported that in all populations and gender, the upper and lower thirds are greater than the middle third; while the upper third was greater than the lower third.
It has also been reported that, the height of middle third of the face was greater than the upper and lower thirds in black males [7], and white individuals [4]. Porter and Olson [8] reported that the upper third was shorter than the middle and lower thirds in Chinese females, contrary to black females with longer upper third.
Reports of a study on Caucasians profile showed long lower third compared to the middle and upper thirds; with a short middle third compared to the upper third [4]. It has also been reported that ‘the middle third of the face is greater than the upper third and equal to the lower third, and the upper third is less than the lower third’ in the East Asians [3].
The ‘appropriateness of a well-proportioned facial segments gives rise to pleasing face’ is an axiom, but a canon of ‘equal thirds’ to apply across ethnic groups, races and genders cannot hold sway as these factors and indeed genetics affect biological structures.
In conclusion, the mean lengths of the upper and lower thirds were significantly longer in the Izon than the Urhobo, while the mean height of the middle third was significantly longer in the Urhobo than the Izon. Furthermore, the mean height of the male lower third was significantly longer in the Izon than the Urhobo, while Urhobo females had significant longer middle third than the Izon. In view of the inequalities of the three facial segments, across ethnic groups and gender, the use of ‘upper face, middle face and lower face’ is more appropriate. The outcome of this study will be useful to guide the oral maxillofacial surgeon, orthodontist and orthognathic surgeon concerned with aesthetic surgery of the face.


 XML Download