

 PDF
PDF ePub
ePub Citation
 Print
Print


INTRODUCTION
Adjusting the anesthetic dose in intellectually disabled (ID) patients is particularly challenging due to difficulties in interpreting clinical signs related to their mental state and to a variety of brain-targeting drugs that these patients take. By contrast, these patients often have limited verbal abilities, and the assurance of an adequate depth of anesthesia is vital to avoid situations of undiagnosed awareness. Despite the advances in cerebral monitoring during general anesthesia, none of the available monitors has been validated for patients with non-normal brains. The most widely used monitor is the bispectral index (BIS) [1], a parameter derived from the electroencephalogram (EEG) by a proprietary algorithm, with values ranging from 0, indicating suppression of detectable brain electrical activity, to 100, indicating the awake state. A target range between 40 and 60 has been advocated both to promote awareness and to reduce the dose of anesthetic agent to be administered [2]. Although this is well established in the general population, its effectiveness in patients with intellectual disability (ID) is questioned. The available research on the use of BIS in patients with ID is limited, and the results from prospective studies are somewhat conflicting. In one study, no significant differences were found between the BIS values in patients with varying degrees of ID, leading the authors to conclude that this condition did not affect the BIS and that it could be used to monitor these patients' anesthesia [3]. However, in two other studies, the BIS values were systematically lower in patients with ID when compared to healthy patients [45]. Nevertheless, one conclusion was common to these three studies: relative reductions in the BIS value correlate well with increasing sevoflurane concentrations in these patients. Due to the heterogenicity of the ID population, more research on this subject is required to understand if the BIS or other EEG-derived parameters could be helpful in monitoring these patients.
EEG asymmetry has been associated with unilateral brain lesions [6], some features of autism [7] and has been studied in children with learning difficulties [8]. However, little is known about EEG asymmetry in patients with ID submitted for anesthesia. Although the BIS monitor has a bilateral sensor with the possibility of recording the BIS asymmetry in anesthetized patients, its usefulness for anesthesia monitoring remains unclear [9].
In the present study, we evaluated the performance of BIS and spectral parameters in patients with ID submitted to dental surgery through correlation scores and prediction probabilities. The EEG asymmetry was also analyzed.
Go to : 
MATERIAL AND METHODS
After obtaining an ethical committee approval (“Comissão de Ética para a Saúde, Centro Hospitalar São João” on 20/10/2014) and informed consent, seventeen 9.6 ± 2.9-year-old patients with ID, with body mass index of 19 ± 2.5 kg/m2, 43.4 ± 17.3 kg, ASA II and III, and with scheduled oral procedures were enrolled in this study. The data were collected between December 2014 and September 2016 at Hospital de São João, Porto, Portugal.
Before induction of general anesthesia, two attempts were made to secure an intravenous access to administer propofol (2–3 mg/kg IV). Whenever intravenous access could not be achieved, anesthesia was induced with 8% sevoflurane in 100% oxygen at 15 L/min through facemask. In this case, intravenous access was performed after the induction of anesthesia when the patient has no eyelash reflex. Rocuronium (0.5 mg/kg) was administered to facilitate tracheal intubation. Analgesia was achieved by submucosal infiltration of lidocaine and adrenaline. If the patients allowed, the BIS sensor was placed before the induction of anesthesia. Otherwise, if the patients did not tolerate sensor placement when awake, this was performed right after the induction. The BIS adhesive sensors (BIS Sensor [4 sensors], Covidien, MA, USA) were placed in the frontal and temporal regions, according to the manufacturer's instructions. The BIS sensor has four self-prepping silver/silver chloride electrodes that are placed on the forehead corresponding to the bipolar montage in the international 10–20 system of Fz (Fpz or Afz: lead 1) to F7 (F9 or FT9: lead 3) and F3 (AF3: lead 2) to F7. Lead 4 is the ground electrode and measures electromyography activity of the frontalis muscle below the sensor. Before placing the sensor, the skin was prepared with alcohol, mild debridement with gauze was performed, and 2–5 s of digital pressure was applied over the sensor lead. The BIS sensor was connected to a BIS Vista® monitor (Covidien). Maintenance of anesthesia was performed with sevoflurane, adjusted for clinical signs by an anesthesiologist blinded to the BIS value. N2O was not used.
The RugLoop II Waves® software (Demed Engineering, Temse, Belgium), installed in a personal computer and connected to the BIS monitor, was used to continuously record the BIS values, as well as other indexes derived from the monitor: EEG suppression ratio (SR-%), spectral edge frequency 95% (SEF95-Hz), total power (TP - µV), electromyographic activity (EMG - %), and signal quality index (SQI - %). Asymmetry index (ASYM) was also recorded every second. ASYM index is an EEG-derived parameter that indicates the percentage of EEG power present in the left or right hemispheres with respect to the total (left and right) EEG power [10]. Because this parameter indicates the percentage of EEG in one of the two brain hemispheres without discrimination, we normalized it by subtracting all the values that were below 50% up to 100% to be able to analyze this parameter.
An Aysius monitor (GE Healthcare, WI, USA) was used to evaluate the peripheral oxygen saturation, pulse rate (PR - ppm), respiratory rate, end-tidal carbon dioxide partial pressure, end-tidal sevoflurane partial pressure (EtSevo - %), noninvasive blood pressure (mmHg), temperature, and electrocardiogram. Neuromuscular monitoring was performed according to international consensus guidelines, using evoked electromyography of the adductor pollicis muscle [11]. The Rugloop Waves software was connected to the carestation allowing the recording of cardiorespiratory parameters.
The recording of the parameters derived from the BIS monitor and all the hemodynamic and respiratory parameters was performed until the patient's mental state returns prior to induction of anesthesia. All important events (drug administration, intubation, start and end of the procedure, discontinuation of sevoflurane administration, recovery, extubation, and unexpected events) were recorded with the Rugloop software. All patients received analgesia (paracetamol 15 mg/kg and NSAID) 30 min before the end of anesthesia.
At the end of the procedure, sevoflurane administration was discontinued, and reversion of neuromuscular block was performed with neostigmine or sugammadex. After the return of spontaneous breathing and recovery of the mental state, tracheal extubation was performed, and the patients were transferred to the recovery room and discharged home according to the customary guidelines practiced in the institution.
1. Data Analysis
Data selected for analysis consisted of EEG-derived parameters collected by the BIS monitor (BIS, SEF95, TP, SR, and EMG) from both sides of the frontal area and the asymmetry index calculated by the ASYM, mean arterial pressure (MAP), pulse rate (PR), and EtSevo (%) from approximately the highest depth of anesthesia achieved after induction until recovery, defined as the return to the mental state prior to anesthesia. The data recorded by the BIS monitor were synchronized with the hemodynamic and respiratory data with a sampling frequency of 1 value every 5 s. The data were then exported to GraphPad Prism® Version 7.03 (GraphPad Software, La Jolla, USA) for statistical analysis.
Data were first tested for normal distribution by using the Shapiro-Wilk normality test. Correlation analysis was calculated by using GraphPad prism, and prediction probability (Pk) analysis was performed by using a macro for Windows Excel published by Smith et al. [12]. These parameters were calculated for each patient by stacking the same data described before in columns. Depending on whether data followed a normal distribution, Pearson or Spearman Rank correlation coefficients were then calculated between the parameters collected by the BIS monitor, MAP, and PR versus EtSevo. For this analysis, data from 1 minute around the following key events were selected: (1) in an awake patient; (2) at the highest EtSevo concentration achieved after induction; (3) in the beginning, (4) half-way, and (5) at the end of surgery; (6) when sevoflurane was turned to zero on the vaporizer; (7) when the patient moved; (8) when spontaneous ventilation returned; (9) at extubation; and (10) upon recovery of the mental state that the patients had before anesthesia.
Prediction probabilities were calculated according to the method of Smith et al. [12] by using the available macro for Microsoft Excel. For each clinical state, a graded scale was attributed: Awake state before induction (6 points), recovery of the mental state observed before anesthesia (5 points), extubation (4 points), movement (3 points), surgery (2 points), and the greatest depth of anesthesia achieved after induction of anesthesia (1 point). The scale data and the corresponding index values were inserted in two side by side columns and the macro was run to calculate the Pk value, which varies from 0 (no prediction capacity of the index) to 1 (best prediction capacity). Only patients who had at least three levels of clinical depth were included in the analysis.
A paired t-test or non-parametric alternative test was used to compare correlation coefficients and Pk values between the left and right side indexes, and to compare correlation coefficients and Pk values among the different parameters (BIS vs SEF vs TP vs EMG vs MAP vs PR). An unpaired t-test or the Mann-Whitney U test was used to compare the EtSevo and index values between patients that had high correlations and Pk values and those with low correlations and Pk values.
The average values of 1 minute around four key events were used for comparisons over time: in an awake patient, after induction, halfway through surgery, and after recovery of the mental state that patients had prior to anesthesia. This analysis comprised paired t-tests or the non-parametric alternative (Wilcoxon Rank test) when data did not follow a normal distribution. P < 0.05 was considered significant.
Go to :
RESULTS
In this study, 17 pediatric patients were studied. Table 1 presents the patient characteristics. Induction of anesthesia was smooth and uneventful for every patient. Tracheal intubation was difficult in only one patient; this patient was maintained in spontaneous ventilation, and a neuromuscular blocking agent was not administered, as previously described.
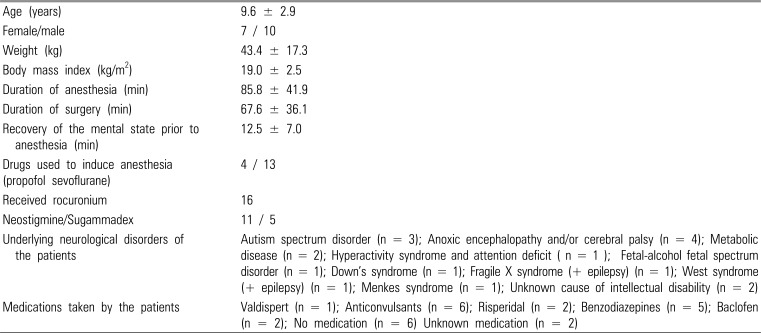
Table 1
Characteristics of the patients included in this study (N=17). Demographic data, anesthetic procedure data, and underlying neurological disorders in patients studied, as well as the patients' medication, are presented.
![]()
Data from 10 moments were selected for correlation analysis, as previously described. When performing data analysis, it was evident that some patients exhibited BIS values very different from those that would be expected in pediatric patients with normal brain function, such as a patient with Lennox-Gastaut Syndrome who had awake BIS values of 58 (left side) and 46 (right side) in the awake state, and values between 60 – 80 during surgery. Correlation analysis with end-tidal sevoflurane and Pk values revealed a clear tendency for a group of patients to exhibit lower correlations and Pk values between the BIS and end-tidal sevoflurane and the clinical scale of anesthesia, while the other group exhibited good values for these statistical measures, as shown in Fig. 1. All patients with either Lennox-Gastaut syndrome or West syndrome, and two patients with cerebral palsy and epilepsy, had the lowest correlation values between BIS and EtSevo (average 0.51 ± 0.19) and Pk (average 0.76 ± 0.16) compared with average correlation of 0.73 ± 0.11 (P < 0.05) and average Pk of 0.84 ± 0.10 (P < 0.05) for the remaining patients (including autism, hyperactivity syndrome, fetal-alcohol disorder, cerebral palsy, metabolic diseases, between other). To better understand these disparities among patients, a neurophysiologist performed a visual analysis of all patients' electroencephalograms, confirming that the four patients that had lower correlation values for BIS, SEF95, and TP had the most evident electroencephalographic anomalies, such as spike activity and spike-wave discharges. Based on these findings, the patients were then divided into a “high correlation” group (n = 13) and a “low correlation” group (n = 4). The correlation coefficients and prediction probability values for all patients are shown in Table 2. There were significant differences in the correlation coefficients and prediction probabilities between the two groups of patients (high and low correlation groups) for BIS, SEF95, and TP, as shown in Figure 1. In general, the BIS had, overall, higher correlation and prediction probability values, followed by SEF95. The EMG and clinical parameters, MAP and PR, had poor average correlation with EtSevo and prediction probabilities.
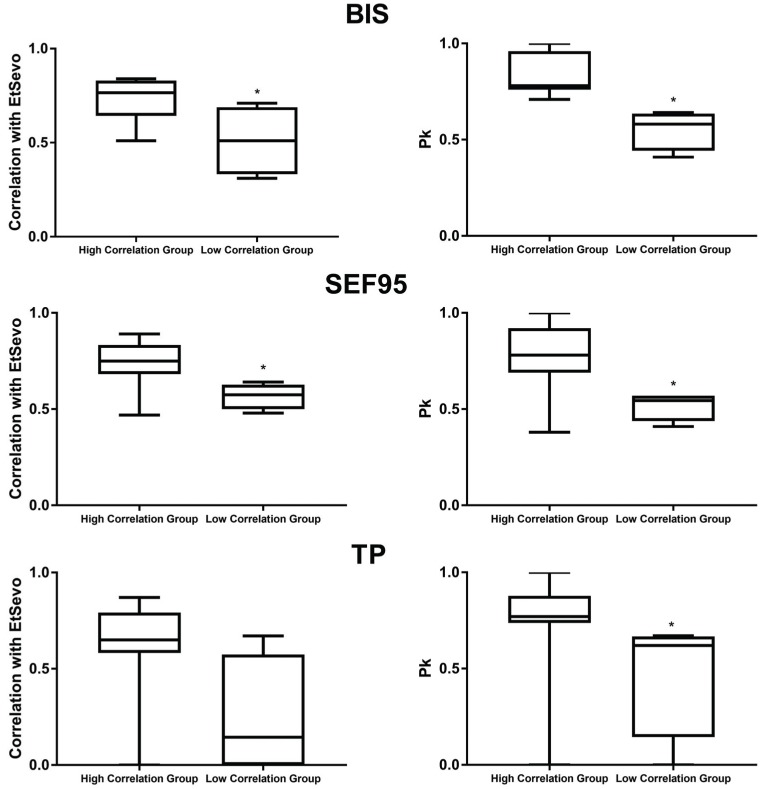 | Fig. 1Box and Wiskers representing the minimum, maximum, and median values of the Spearman correlation coefficients obtained between the end-tidal sevoflurane (EtSevo) and the indexes studied (on the left) as well as the prediction probability values (Pk) on the right. The results are shown for the bispectral index (BIS), spectral edge frequency 95% (SEF95 - %) and total power (TP -uV). *represents significant differences at P < 0.05 level between the group with high and those with low correlation between the indexes and EtSevo and the clinical scale of anesthesia.
|
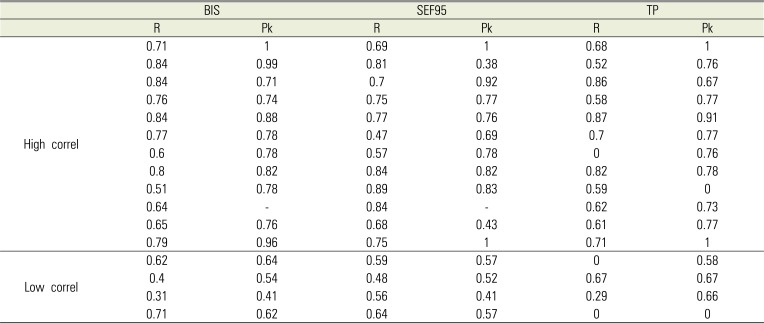
Table 2
Correlation coefficients (Spearman Rank R – R value) and Precition probabilities (Pk) for the bispectral index (BIS), spectral edge frequency (SEF95), and total power (TP).
![]()
Table 3 shows the mean and standard deviation of EtSevo, BIS, SEF95, TP, and ASYM at the moments selected for analysis, for the group of patients that had better correlation of EEG-derived indexes with EtSevo and the clinical scale of anesthesia, and for the group of patients that had inferior performance in these indicators. There were significant changes in the group that had higher correlations for EtSevo, which increased significantly from the awake state to the moment when greatest depth of anesthesia was achieved in both groups of patients (P < 0.001). In the group with high correlations with EtSevo and clinical scale of anesthesia, EtSevo decreased significantly from this moment until the beginning of surgery (P = 0.02), from the beginning of surgery to half-way through surgery (P = 0.03), from this moment to the end of surgery (P < 0.001) and from the end of surgery to the moment when sevoflurane administration was stopped (P = 0.006).
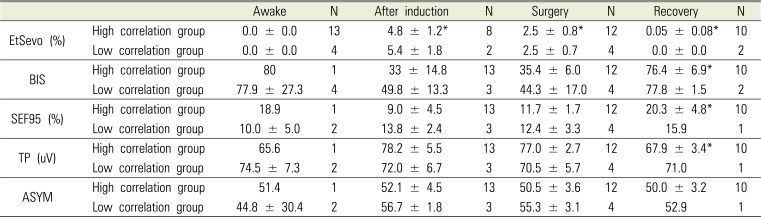
Table 3
Description of the anesthesia periods selected for analysis and mean values of the studied indexes at each moment in the group of patients who had high correlation with the end-tidal sevoflurane concentration and high prediction probabilities (“High correlation group”) and in the group of patients who had low correlation with the end-tidal sevoflurane concentration and high prediction probabilities (“Low correlation group”).
After induction – in the moment of highest anesthetic depth after induction of anesthesia
Recovery – when the patient recovered the mental state prior to anesthesia
EtSevo-%: End-tidal sevoflurane concentration; BIS: bispectral index; SEF95: spectral edge frequency 95%; TP: total power; Mean and standard deviation are shown. ASYM: Asymmetry indicator. The number of subjects (N) at each study period are shown.
*Statistically significant P-value at the 0.05 level in comparison to the previous time period; ¥ Statistically significant P-value at the 0.05 level when comparing indexes values recorded from the left and right
![]()
BIS, SEF95, and TP increased significantly in the high correlation group, from surgery to the moment when patients recovered the mental state they had prior to anesthesia (P < 0.05). No significant differences over time were observed for the group of patients that had lower correlations with EtSevo and the clinical scale. No significant differences were found between the two groups in these parameters, at any of the moments considered.
The values of BIS, SEF95, TP, and EMG were compared for the right and left sides of the frontal area. There were differences between the left and right sides only in the awake state (P = 0.02) and after induction (P = 0.01), when all patients were analyzed together. The ASYM had no significant differences over time in either of the two groups; however, in the awake state, the low correlation group showed ASYM values of 71.6%. There were no significant differences between the left and right sides in the index values, correlation coefficients, or prediction probabilities in either of the two groups of patients. Because of this, the results are shown for the indexes recorded in the frontal region of the left hemisphere for all patients.
When comparing all correlation coefficients among the different parameters (BIS vs SEF95 vs TP vs EMG vs MAP vs PR), there were significantly lower correlation coefficients for PR, compared with BIS (P < 0.01), SEF95 (P < 0.01), TP (P = 0.04), and MAP (P = 0.01). The same analysis regarding the prediction probabilities revealed significantly lower prediction for PR compared with BIS (P = 0.01), and lower prediction for MAP (P = 0.04) and PR (P < 0.01) compared with EMG.
The suppression rate (SR) was always 0% for all patients, reflecting the absence of any burst suppression patterns in the EEG during the entire anesthesia period. MAP showed significant differences only between values recorded during spontaneous ventilation and at the moment of extubation (P = 0.018). No significant differences were found in PR.
Go to :
DISCUSSION
This study investigated the capacity of EEG-derived indexes to reflect depth of anesthesia in children with ID. Correlations with EtSevo and prediction probabilities using a score attributed to the clinical depth of anesthesia were used as measures of index performance.
The correlation analysis revealed that there were patients with BIS values that were very different from those that would be expected in pediatric patients with normal brain function, such as a patient with Lennox-Gastaut Syndrome who had awake BIS values of 58 (left side) and 46 (right side) in the awake state, as well as values between 60–80 during surgery. There was a clear tendency for one group of patients to have lower correlations and prediction probabilities of the BIS with end-tidal sevoflurane and the clinical scale of anesthesia, while the other group had good values for these statistical measures. In the group of patients that showed higher correlations, the BIS and spectral parameters (SEF95 and TP) seemed to distinguish between anesthetized, awake, and recovery states, as indicated by high Pk values. The Pk reflects the capacity of an index to distinguish among different depths of anesthesia, reflected by a clinical scale in which a numeric value is attributed to each anesthetic depth. This measure was developed to identify anesthetic depth indicators that are promising for use in clinical monitoring [12]. To better understand the meaning of Pk, given two randomly selected data points with distinct observed anesthetic depths and anesthetic depth index values, Pk is the probability that the index values of the data points predict correctly which data points represent lighter (or deeper) anesthesia. A Pk of 0.5 signifies that the index of anesthetic depth correctly predicts anesthetic depth 50% of the time, i. e., no better than a 50: 50 chance, while a Pk value of 1 signifies that the index correctely predicts anesthetic depths 100% of the time [12]. In this study, the BIS and SEF95 had values of Pk above 0.5 for 13 of 17 patients, reflecting a good prediction capacity for the clinical states of the scale used in patients with certain types of neurological disease or intellectual impairment [12]. Previous studies have already reported good discrimination between awake and anesthetized states by the BIS [3], although with lower BIS values than in healthy patients [45]. This could not be evaluated in the present study due to the small number of patients that allowed the recording of BIS in the awake state; however, the tendency observed in three patients was to exhibit awake values below 80, which is lower than the awake BIS values for healthy patients [4]. Furthermore, patients recovered their mental state prior to anesthesia with average BIS values of 76.4 and 78.8 for the groups with high and low correlation values, respectively. It is important to note that the patient with Lennox-Gastaut Syndrome had awake BIS values of 58 (left) and 46 (right), and BIS values during surgery between 50 and 60, with similar EtSevo concentrations relative to other patients. This may be related to EEG alterations that are reflected in the anesthetic depth indexes, such as spike-wave discharges observed in this study. In a case report of BIS and bilateral raw EEG monitoring in a patient with this syndrome, the EEG spike activity increased with the increase in sevoflurane concentration [13]. This could explain why, in our study, the patient with this syndrome had such poor performance of BIS and SEF95: due to a paradoxical increase of the index values, with increased spike activity during deeper anesthesia. We conclude that, in patients with Lennox-Gastaut Syndrome, the BIS and spectral parameters may not adequately reflect the depth of anesthesia.
Three other patients showed lower correlation and Pk results: a patient with West syndrome and two patients with cerebral palsy and epilepsy. Surprisingly, patients with autism, hyperactivity syndrome, and fetal-alcohol disorder, and other patients with cerebral palsy and epilepsy, showed better correlations between the indexes and EtSevo and the clinical scale. This suggests that the most important limitation for the use of BIS in these patients might be the baseline EEG characteristics and the degree of ID, rather than the underlying neurological disorder.
The BIS showed a better correlation with the anesthetic dose and clinical scale of anesthesia than SEF95 and TP. This is not surprising, because these spectral parameters do not consider the nonlinear characteristics of the EEG. However, they have the advantage of a straightforward interpretation, in that they depend solely on the frequency and amplitude of the signal. However, the EEG from these patients during general anesthesia seems to be better analysed by the BIS algorithm with linear and non-linear components. Other non-linear methods could be explored in these patients, such as Approximate entropy and Permutation entropy [1415].
When comparing the performances of the different parameters studied, correlations with EtSevo and the prediction probabilities were higher for BIS and SEF95 when compared to TP, EMG, MAP or PR. BIS had the highest overall correlations and Pk values, suggesting that it may be a better indicator of the depth of anesthesia in these patients, compared with the spectral parameters. However, it should be emphasized that the performance of the BIS varies widely among patients with different neurologic disorders. In summary, it seems to reflect the depth of anesthesia better in patients with autism spectrum disorder, hyperactivity syndrome, and attention deficit and fetal alcohol syndrome, and to have worse performance in patients with metabolic syndromes (e. g., Lennox Gastaut) and epilepsy.
In this study, a comparison was made between the indexes recorded from the left and right side of the forehead. Assymetry in the EEG power has been observed in patients with neurologic conditions, such as autism [716], learning disabilities [8] and unilateral brain lesions [6]. In this study, there were no differences in the left and right side, either in the ASYM indicator calculated by the BIS monitor, or between the BIS from left and right sides. Higher rates of asymmetry were expected in the group of patients with lower correlation results for the EEG-derived indexes. Indeed, these patients had an average of 71.6% of asymmetry by the ASYM indicator in the awake state; however, the number of patients in this analysis is an important limitation in making appropriate conclusions. Nevertheless, this high level of asymmetry suggests that this indicator and its implications for anesthetic depth monitoring should be further explored in ID and healthy patients. A higher number of patients with different neurologic conditions may be required for better understanding of the behavior and utility of processed EEG in ID patients. The reduced number of patients and high heterogenicity of the sample are important limitations of the present study. Neverthless, there are important considerations for future research: it would be interesting to include raw EEG analysis of all patients with the definition and quantification of specific EEG abnormalities, together with the indexes of depth of anesthesia, as well as the evaluation of the degree of ID. This could enable understanding of which clinical changes and which EEG features are associated with different index performances, and would allow better correlation with what is known regarding EEG changes in awake patients with these neurologic conditions.
In conclusion, in this study performed in 17 children with ID, despite high variability in the performace of the BIS among patients with different neurological conditions, in the majority of patients it correlated well with the concentration of sevoflurane and exhibited a good overall prediction capacity of the clinical scale of anesthesia, with better results than SEF95 and TP. From this study we can conclude that the BIS may be a useful tool to monitor anesthesia in patients with some types of ID, but large-scale studies with a higher number of patients are required before recommending the use of BIS in these patients. Furthermore, it is important to define the neurological conditions and/or degrees of disability that may allow anesthesiologists to use BIS monitoring and to reveal possible adjustments that should be performed regarding the index scale.
Go to :
 XML Download