

 PDF
PDF ePub
ePub Citation
 Print
Print


INTRODUCTION
Knowing that hypnotic agents alter the electroencephalogram (EEG) dates back to when the brain was discovered to exhibit electrical activity. In 1875, Caton used chloroform to verify that the electrical oscillation from the brain was biological [1]. Berger measured the effect of chloroform on EEGs in the 1920s and 1930s, when electrical amplifiers were used to record small potentials passing through skulls [2]. In 1937, Gibbs et al. reported that EEG activity was altered by hypnotic agents from a fast waveform with a low potential to a slow waveform with a high potential, and that the EEG could be used to measure the effect of hypnotic agents [3]. In 1952, Faulconer showed that the anesthetic depth based on the EEG form correlates with the arterial blood ether concentration [3]. He also demonstrated that N2O reduces the arterial blood concentration of the ether required to obtain the given EEG effect.
The EEG can be used for hypnotic depth measurements for several reasons. The EEG represents the electrical activity of the cerebral cortex originating from the sum of excitatory and inhibitory postsynaptic activity, which is regulated by the subcortical thalamic nuclei. This electrical activity has direct physiological relevance to hypnotic depth. Cerebral blood flow and brain metabolism are related to the degree of EEG activity. Hypnotic agents affect brain physiology and EEG morphology. When patients are unconscious and unresponsive, the EEG is a noninvasive indicator of brain function. Recording an unprocessed raw EEG involves accumulation of large amounts of EEG records, but recent computer analysis techniques have made it possible to summarize and refine the EEG to provide meaningful information. Recently, several signal processing techniques have been developed to better analyze changes in the EEG. The purpose of these technologies is to simplify and analyze the EEG for use in various fields such as neurological disease, intraoperative anesthesia, and diagnosis of brain ischemia. Although some signal-processed EEG parameters have achieved limited success in certain areas, there is still no parameter acceptable for use as a standard. This is because the signal processing techniques do not consider all the statistical properties of the EEG.
The EEG is a complex signal that represents the electrical activity of the brain. Like other signals, the EEG can also be split into a series of sinusoids. Most signal-processed EEG parameters are based on power spectral analysis, which represents the amplitude of sinusoids as a function of frequency. However, power spectral analysis does not quantify the possible relationships between sinusoids. Such relationships between these elements typically appear in signals generated in nonlinear systems such as the brain. Power spectral analysis of the EEG clearly ignores the relationship between sinusoids. Almost all biological systems show considerably nonlinear behavior. Especially because of the nonlinear characteristics of neuronal activity, the EEG signal has very complex dynamics. An analytical technique that can detect and quantify any aspect of this nonlinear change may better reflect the dynamic structure of the EEG. Here, the basic elements and terminology of signal processing, followed by Fourier analysis and power spectrum analysis, were briefly reviewed. Based on this, the characteristics of the EEG changes in the sedation state were investigated.
SIGNALS AND SAMPLING
Changing an analog signal to a digital signal is called sampling or digitizing. The digital signal analysis system used for signal processing continuously collects EEG samples at regular time intervals. For example, if the time interval between samples is Δt and the number of samples in a particular segment in the collected data is M, successive samples of the EEG signal x can be denoted by x(k·Δt), where k = 0, 1, 2, …, M−1. This refers to the value of the EEG signal x in time 0·Δt, 1·Δt, 2·Δt, … (M−1)·Δt. The entire sampled EEG data can be represented by x(k), and x(k) can be divided into a series of sequential epochs (same time segments). These epochs may overlap each other or be contiguous.
If the statistical characteristics of the signal do not change with time, the signal is called stationary. The stationary signal can be represented by the sum of simple mathematical functions (elements) and all information of the signal can be stored here.
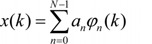
k = 0, 1, 2, …, M−1
x(k): signal
φn(k): the nth element among all N elements
an: the coefficient associated with the nth element
There are a number of functions that can be used as elements. However, the most commonly used are sine and cosine waveforms, or sinusoids. The Fourier series is the representation of a signal as a sum of sinusoids.
SINUSOIDS
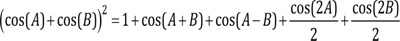
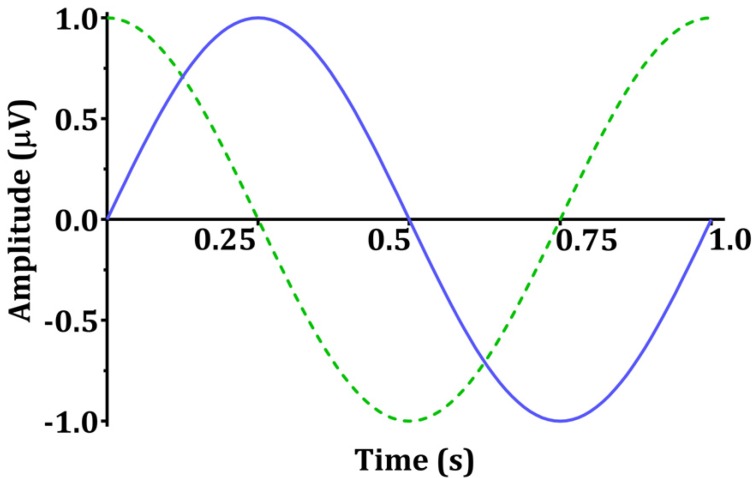
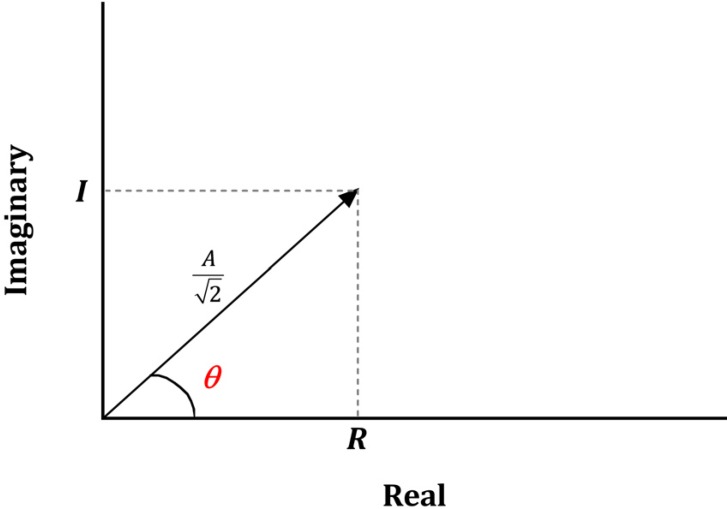
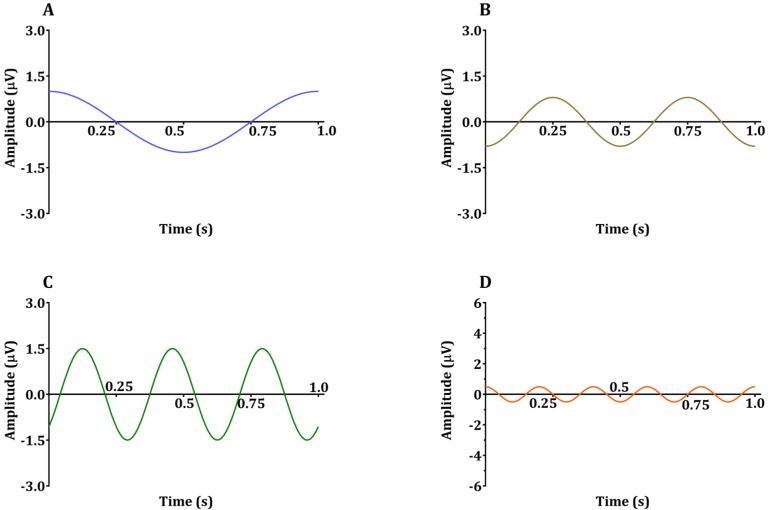
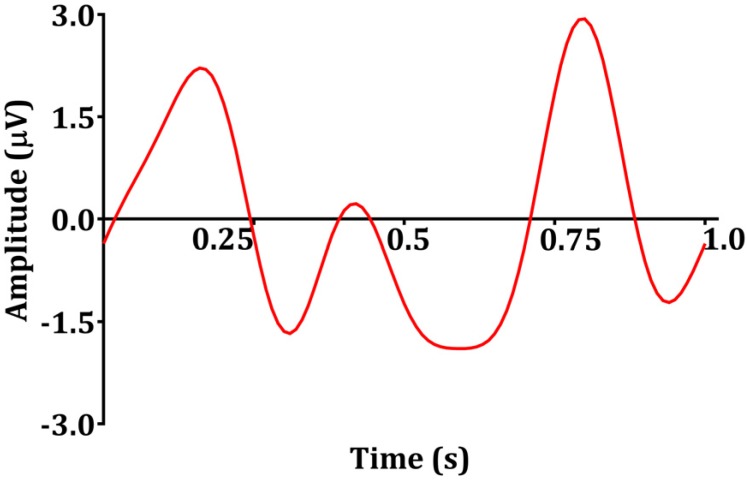
Sinusoids are defined by three basic elements: amplitude, frequency, and phase angle. For EEG, the unit of amplitude is most commonly used in µV. The phase angle θ indicates the extent to which the start time of the sinusoids compares to time zero. θ represents the duration to which the sinusoids have shifted relative to the starting point and is expressed as a fraction of the total period. The unit of the phase angle is °, which is between 0–360°. Phase angle 360° means that one cycle is fully turned. In reality, the phase angle is expressed in radians. Consider a sinusoid with amplitude A (µV), frequency f (Hz, 1/s), and phase angle θ (rad). Angular velocity or angular frequency ω = 2πf (rad/s). Then, the time-dependent sine function f(t)=A·sin(ω·t+θ)=A·sin(2π·f·t+θ). Here the unit of time is s. The parentheses in the sine function are all in radians; 360° = 2π rad, 180° = π rad, 90° = π/2 rad, and 0° = 0 rad. Fig. 1 shows a sinusoid with A = 1 µV, f = 1 Hz, θ = 0° (0 rad) and 90° (π/2 rad). Sinusoids can be represented as vectors with size and direction. The size (length) of the vector is the amplitude of the sine wave divided by  . The direction of the vector is the phase angle θ, measured counterclockwise from the horizontal axis. The size and phase angle of the vector can be visualized by plotting the lines on real and imaginary axes as shown in Fig. 2. Sinusoids can be used as the foundation of the Fourier series to produce almost any continuous signal, whether simple or complex. That is, one can add or subtract sinusoid elements with different amplitude, frequency, and phase angles until the desired signal is obtained. As independent sinusoids (independent components, fundamentals) are added together, the signal becomes more complex. The four sinusoids in Fig. 3 can be added to become Fig. 4.
. The direction of the vector is the phase angle θ, measured counterclockwise from the horizontal axis. The size and phase angle of the vector can be visualized by plotting the lines on real and imaginary axes as shown in Fig. 2. Sinusoids can be used as the foundation of the Fourier series to produce almost any continuous signal, whether simple or complex. That is, one can add or subtract sinusoid elements with different amplitude, frequency, and phase angles until the desired signal is obtained. As independent sinusoids (independent components, fundamentals) are added together, the signal becomes more complex. The four sinusoids in Fig. 3 can be added to become Fig. 4.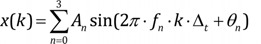
k = 0, 1, 2, 3, …, M−1: represents discrete time of 0·Δt, 1·Δt, 2·Δt, …, (M−1)·Δt
n = 0, 1, 2, 3: element
frequency of the sinusoid of each element (fn) = 1, 2, 3, 5 Hz of the sinusoid of each element
amplitude of the sinusoid of each element(An) = 1, 0.8, 1.5, 0.5 µV
phase angle of the sinusoid of each element(θn) = 90° (0.5π rad), 270° (1.5π rad), 315° (1.75π rad), 90° (0.5π rad)
Signal x(k) is the sum of sinusoids elements.
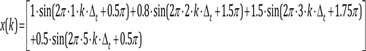
k = 0, 1, 2, 3, …, M−1
FOURIER TRANSFORM AND POWER SPECTRAL ANALYSIS
By converting the signal to a Fourier series, each sinusoid element can be studied. This is a common concept in quantitative EEG analysis. EEGs often exhibit delta (δ, 1–4 Hz) theta (θ, 5–8 Hz), alpha (α, 8–13 Hz), and gamma (γ, 30–80 Hz) bands. In general, the conversion of the signal to the amplitude and frequency of the sinusoids of the Fourier series is called the Fourier transform. The Fourier transform converts a time series signal x(t), whose amplitude or power is a function of time, into a frequency series signal X(f), whose amplitude or power is a function of frequency. The Fourier transform of the sampled signal x(k) is defined as follows. The Fourier transform is also a type of integral transform and uses e-ik2πf as a kernel function
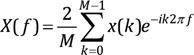
As a result, the Fourier transform X(f) consists of a series of discrete values, each corresponding to a particular signal frequency element f. The frequency range of X(f) is 0-fs/2 Hz. fs is the sampling frequency in samples/s. The Fourier transform computed in Eq. (4) has both positive and negative frequencies, but only positive frequencies are taken for convenience. The frequency resolution of X(f) is denoted by fs/N Hz, where X(f) is a few Hz apart, and N is the total number of samples of signal x(k). For example, if x(k) is data for 4 s and fs = 100 samples/s, N becomes 400, the frequency range of X(f) is 0–50 Hz, and the frequency resolution is 0.25 Hz. Therefore, the order of each value of X (f) is X(0.00), X(0.25), X(0.50), … , X(50.00). The limitation of the Fourier transformed signal X(f) to this frequency range is unavoidable because the sampling rate is not fast enough. To find sinusoids, it is necessary to have at least two sample points within one cycle (reciprocal of the signal frequency, 1/f). If at least two sample points cannot be found in one cycle due to slow sampling rate, it appears to be slower than the original analog signal. That is, if the sampling rate is low, a fast analog signal is converted to a slow digital signal. The frequency range should be limited to less than fs/2 to prevent this aliasing error (the high frequency sinusoids component in the Fourier transform being mistaken for low frequency sinusoids) while obtaining signal. If the frequency range is limited to 0-fs/2 Hz, the Fourier transformed signal X (f) will have all the information of the original sampled signal x(k). Therefore, by inverse Fourier transform of X(f), the original signal x(k) can be obtained from X(f). In other words, when acquiring the signal, the sampling frequency (fs) should be at least twice the signal frequency (f).
The power of each sinusoid element in the Fourier series can be found by calculating the power spectrum P (f).
EEG data can be generally divided into epochs and the power spectrum of the total EEG data is calculated by averaging the power spectrum of all epochs. This reduces the variance of the power spectrum as the frequency resolution becomes low enough to be acceptable. There is only power and frequency information in the power spectrum and no information about the phase angle. The power spectrum can be used to examine how the absolute value and distribution of power changes in response to changes in the central nervous system, and is therefore useful for monitoring and evaluating changes in the central nervous system. For example, in awake normal subjects, most of the power in the EEG is in the alpha and beta bands, but when hypnotic agents are administered, the power distribution shifts to a lower frequency band.
PHASE COUPLING
Nonlinear systems often have dependent sinusoids in response to sinusoidal input signals. For example, suppose there is a simple nonlinear system where the output γ(k) is the square of the input x(k)
If the input signal is frequency f1, f2, respectively, and the phase angle is θ1, θ2 (the phase angles are random and independent of each other), the output signal is:
Input:

First of all:
Output:
Let γ1(k) be the output for the input signal x1(k) to the system, and γ2(k) be the output for the input signal x2(k). Here, this system is defined as linear only if the output for the input signal a·x1(k) + b·x2(k) is a·γ1(k) + b·γ2(k).
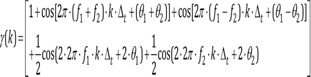
The elements of f1 + f2, f1−f2, 2·f1, 2·f2 of γ(k) are dependent on f1, f2. The sinusoids element of the output signal resulting from multiplying the input signal sinusoids element (excluding addition or subtraction) is called the intermodulation product (IMP). The non-multiple output signal sinusoids elements are called fundamental, and there is no such basic form in this example. If a sinusoid element is in the form of an IMP, it is phase-coupled. This process is called quadratic or second-order phase coupling. Phase coupling is a typical feature of nonlinear systems. The ability to analyze the degree of phase coupling within the signal to the external stimulus and the variation of the phase linkage will enable a deeper understanding of the system. For the central nervous system, correlation analysis between phase coupling of clinical conditions and EEG can be done. The degree of phase coupling cannot be quantified by power spectral analysis or other quantitative EEG parameters. For example, a signal γ1(k) with the same power spectrum as γ(k) of Eq. 8 can be made by adding frequency f1 + f2, f1−f2, 2·f1, 2·f2 to the independent frequency elements.
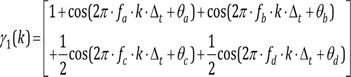
fa = f1 + f2, fb = f1−f2, fc = 2·f1, fd = 2·f2
θa, θb, θc, θd are random and independent
The signal γ1(k) has a phase structure completely different from that of the phase-correlated signal γ(k). However, the power spectrum is the same as the phase-coupled signal. Although these two signals originate from fundamentally different processes, they cannot be distinguished by the power spectrum because the phase information is ignored. Here, all the phase interlocking information is suppressed. The bispectral analysis should be used to characterize the degree of phase coupling in the signal. This bispectral analysis is also included in the algorithm of the bispectral index (BIS® monitor; Covidien, Boulder, CO, USA).
INTRODUCTION OF SIGNAL PROCESSING USING POWER SPECTRAL ANALYSIS
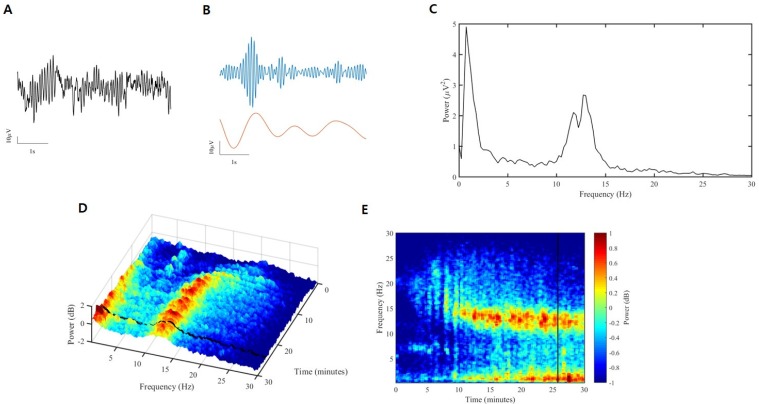
The process of conversion from raw EEG to spectrogram is briefly described in Fig 5. First, raw EEG can be separated by sinusoids. This converts from time domain to frequency domain, usually using Fourier transforms. At this time, the unit of the X-axis is the frequency, and the unit of the Y-axis is the power. Power is often expressed as a decibel concept, defined as the amplitude of a given EEG frequency component squared, taken as a log of base 10, and then multiplied by 10. This can be summarized as follows:
This is the two-dimensional representation and can be expressed as a three-dimensional spectrogram if considering time (Fig. 5D). This can be expressed in two dimensions, which is called a density spectral array (Fig. 5E). This figure shows at a glance whether the power of a certain frequency increases or decreases with time.
GENERAL CLINICAL CIRCUMSTANCES AND EEG CHARACTERISTICS DURING LOSS OF CONSCIOUSNESS INDUCED BY HYPNOTIC AGENTS
When hypnotic agents are not present in the body, the patient's conscious state shows normal arousal, while the alpha band activity is predominant when the eyes are closed and still [4]. Hypnotic agents acting on γ-Aminobutyric acid type A (GABAA) receptors, including propofol, can be slowly administered to induce sedation. In general, the patient becomes calm and normally closes his or her eyes, but recovery can be easily achieved by stimulating the surrounding area [5]. Increasing the dosage of the hypnotic agents can lead a paradoxical excitation state, which may result in purposeless movements, unrelated speech, or a feeling of joy or discomfort [46]. Paradoxical excitation caused by propofol can be explained by two mechanisms. First, the inhibition of GABAA1-mediated inhibitory input from globus pallidus to thalamus increased the expiratory input from thalamus to cortex [7]. Second, simulation studies show that low doses of propofol temporarily block slow potassium currents in cortex neurons [7]. At this time, an increase in the activity of the beta band is observed in the EEG [8]. Here, when the dose of hypnotic agent is further increased, the patient's respiratory rhythm becomes irregular and may progress to apnea. The response to verbal commands can be lost or accompanied by a reduction in skeletal muscle tone [4]. Loss of consciousness can cause tracking eye movements to disappear, nystagmus to appear, and blinking to increase. Oculocephalic reflex, eyelash reflex, and corneal reflex disappear but pupillary light reflex remains [910]. The blood pressure may increase or decrease, but the heart rate generally increases. As the level of hypnotic depth increases after consciousness is lost, four typical EEG characteristics appear [4]. First, the activity of the beta band is decreased and the activity of the alpha and delta bands is increased in shallow general anesthesia [11]. In the second stage, where deeper levels of sleep are induced, the activity of the beta band in the anterior region of the brain is reduced less than in the posterior region and the activity of the alpha and delta bands is increased [1112]. In the third stage of deeper sleep, the EEG flattening period begins to appear between alpha and beta band activation, and is often referred to as burst suppression [13]. When it becomes deeper, an isoelectric EEG appears in the last step.
EEG PROPERTIES OF CERTAIN DRUGS IN A SEDATED STATE
1. Propofol
The molecular mechanisms of propofol, which is commonly used for sedation and general anesthesia, are well known. γ-Aminobutyric acid type A (GABAA) receptors binds postsynaptically to open the chloride channel and hyperpolarize postsynaptic neurons, leading to inhibitory responses [1415]. Because propofol is lipid soluble and GABAergic inhibitory interneurons are widely distributed in the cortex, thalamus, brainstem, and spinal cord, propofol may induce changes in consciousness at various sites. Especially in the cerebral cortex, propofol increases GABA receptor-mediated inhibition of pyramidal neurons [15].
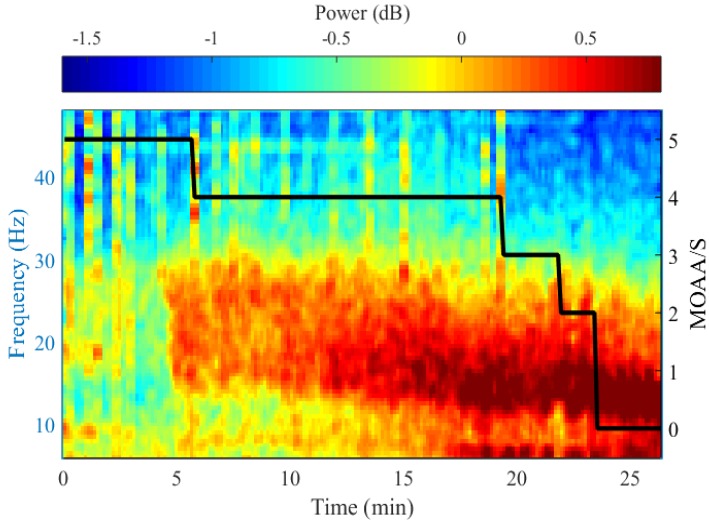
Regular beta oscillation is common in sedation, and slow delta oscillation occurs at the time of loss of consciousness [16]. The amplitude of these oscillations is 5–20 times greater than the gamma oscillation seen in arousal states [1617]. Fig. 6 shows the results of power spectral analysis by measuring the EEG of greater hypnotic depth in the awake state from 5 to 0, using the Modified Observer's Assessment of Alertness/Sedation Scale (MOAA/S). As the MOAA/S score decreases, the peak frequency decreases, the power of the alpha-beta band gradually increases, and the delta band power increases after loss of consciousness.
2. Midazolam
Midazolam is a benzodiazepine drug, classified as a short-acting agent. Like propofol, the mechanism of action is selective for GABAA receptors [18]. Benzodiazepine drugs have binding sites on peripheral tissues, which are independent of GABA receptors, and also bind to the translocator protein (TSPO) in the tissues present in the peripheral immune cells and gastrointestinal tract. The exact mechanism of action of TSPO is unknown, but is probably related to immune activity [19].
Because its mechanism of action is the same as that of propofol, EEG properties are similar to propofol. In other words, when sedated with midazolam, a diffuse beta band oscillation appears, and the activity of the alpha band weakens [20]. Therefore, power spectral analysis shows that the power in the beta band is increased [21].
3. Ketamine
Ketamine binds to the N-methyl-d-aspartate (NMDA) receptor in the brain and spinal cord [22] and acts as a channel blocker [23]. Because the channels of the inhibitory interneurons are generally more active than the channels of the pyramidal neurons, small to moderate ketamine acts predominantly on the inhibitory interneuron [2425]. By blocking the input from the inhibitory interneuron, ketamine makes the downstream excitatory neurons less inhibitory or more active [422]. This is why cerebral metabolism increases when a small amount of ketamine is administered. Therefore, intravenous administration of ketamine increases the cerebral metabolic rate and cerebral blood flow and promotes hallucinations [2627]. After ketamine administration, the EEG shows an aroused state. When a small amount of ketamine is administered, fast oscillation is observed in the high beta band and low gamma band at 25–32 Hz [16]. This beta-gamma oscillation does not occur until 2 min after ketamine administration. Compared with propofol, the slow oscillation of ketamine is less regular.
4. Dexmedetomidine
Dexmedetomidine mainly changes the level of consciousness through the presynaptic α2-adrenergic receptor of the projecting neurons in the locus coeruleus. When dexmedetomidine binds to the α2-adrenergic receptor, it hyperpolarizes the locus coeruleus neurons and reduces norepinephrine secretion [2829]. Hyperpolarization of locus coeruleus neurons results in the disappearance of the inhibitory inputs in the preoptic area of the hypothalamus. Because the GABAergic and galanergic inhibitory projections are transmitted to the major arousal centers in the midbrain, pons, and hypothalamus of the preoptic area [2230], loss of the inhibitory input from the locus coeruleus activates these inhibitory pathways from the preoptic area to the arousal center, resulting in sedation. The activity of the inhibitory input in the preoptic area is an important factor in how nonrapid eye movement (NREM) sleep begins [3132].
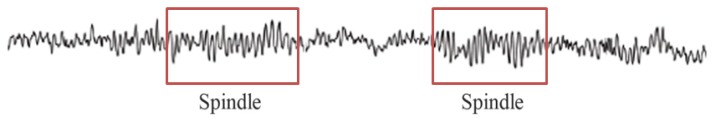
The association between the activity of dexmedetomidine and the initiation of non-rapid eye movement (NREM) sleep in the preoptic area helps to explain the similarity of the EEG characteristics of this drug and NREM sleep. A small dose of dexmedetomidine can induce a depth of hypnosis suitable for sedation, with the ability to respond to minimal auditory or tactile stimuli. The EEG is characterized by slow delta oscillation and spindle oscillation at 9–15 Hz for 1–2 s (Fig. 7), similar to the alpha oscillation observed with propofol, yet weaker [16].
5. N2O
N2O showed potential as a hypnotic agent in the late 1800s, and is now commonly used in clinical practice as an anesthetic adjunct [33], because it is not an inhaled anesthetic and alone is not powerful enough to induce general anesthesia. Thus, inhaling a sufficient dose of N2O alone to lose consciousness would cause nausea and vomiting [34]. Unlike other ether anesthetics, when inhaled with oxygen, slow alpha oscillation is not seen, and there is a pronounced beta and gamma oscillation with slow delta oscillation of relatively low power [3435]. Slow delta oscillations are often seen when converting anesthetics such as ether anesthetics or propofol to N2O [3637]. Slow delta oscillations tend to be transient, but beta and gamma oscillations are common when inhaling N2O.
CONCLUSION
Power spectral analysis of raw EEG revealed the characteristics of each hypnotic agent; these characteristics are related to the mechanism of the agent. Beta oscillation is common when inducing sedation with propofol and slow-delta oscillation appears at the time of loss of consciousness. Midazolam shows an EEG pattern similar to that with propofol, as its action mechanism is the same, and beta oscillation is predominant when inducing sedation. For ketamine, beta and gamma oscillations in the 25–32 Hz band are evident. Dexmedetomidine is characterized by slow delta oscillation and spindles. Although commercially available monitoring devices that report hypnotic depth during the sedation process do not display spectral analysis results on screen, it will help you to understand the effect of hypnotic agents on the brain if you are familiar with these EEG characteristics.


 XML Download