

 PDF
PDF Citation
 Print
Print


INTRODUCTION
Nephrolithiasis or urolithiasis (kidney stone) is the presence of renal calculi caused by disruptions in the balance between the solubility and the precipitation of salts in the urinary tract and kidneys [1]. The incidence of nephrolithiasis peaks between 20 and 30 years of age [1], but varies by sex and race [2]. Men have a twofold risk of stone formation compared with women, with a peak incidence at 30 years of age, whereas women have a bimodal age distribution, with peaks at 35 and 55 years [3].
Nephrolithiasis is a common disorder in developed countries and is considered to be a disease of affluence [45], with substantial direct and indirect costs among working-age adults [6] and with a reported lifetime prevalence of 10% to 12% in men and 5% to 6% in women [78]. Romero et al. [9] reported a 5.0% prevalence of nephrolithiasis in South Korea, whereas Kim et al. [10] reported an expected lifetime prevalence of 6.0% and 1.8% among Korean men and women, respectively. Recently, a worldwide increase in the occurrence of kidney stone disease has been reported [11], and an estimated 8% to 16% of the US population experience at least one symptomatic stone by the age of 70 years [12]. However, few epidemiologic studies have investigated urolithiasis in Asia [13].
The pathogenesis of kidney stone formation is complex and involves both metabolic and environmental risk factors [14]. Nephrolithiasis risk factors include male sex, age, race [9], high socioeconomic status [15], body mass index (BMI) [16], blood pressure levels [1516], diabetes [16], gout [16], chronic kidney disease (CKD) [16], hyperparathyroidism [17], inflammatory bowel disease (IBD) [18], smoking [19], alcohol consumption [20], and metabolic syndrome [21]. Kidney stones (calculi) are mineral concretions in the renal calyces and pelvis, which may be free or attached to the renal papillae [22]. Stones that develop in the urinary tract (known as urolithiasis or nephrolithiasis) form when the urine becomes excessively supersaturated with respect to a mineral, leading to crystal formation, growth, aggregation, and retention within the kidneys [23]. In some circumstances, urine can also become supersaturated with certain relatively insoluble drugs or their metabolites, leading to crystallization in the renal collecting ducts or iatrogenic stones [24].
The prevalence and incidence of nephrolithiasis have increased in most Asian countries in previous decades [25]. Tae et al. [13] emphasized the urgent need for nephrolithiasis preventive efforts owing to the rapidly changing prevalence of nephrolithiasis in Korea. Although the prevalence and disease burden of nephrolithiasis have been increasing in Korea [26], to date no nephrolithiasis risk prediction equations have been developed for the Korean population. Some models have been developed for nephrolithiasis-related outcomes in some populations; however, many of the prediction models developed in a particular population may not perform well in other populations [27]. Here, we developed and validated prediction equations and a simplified risk score to estimate risk for nephrolithiasis in a Korean population using data from general medical practice and based on risk predictors that individuals from the general population are likely to know.
MATERIALS AND METHODS
We developed and validated risk prediction equations in accordance with guidelines and protocols recommended by TRIPOD (transparent reporting of a multivariable prediction model for individual prognosis or diagnosis) [28].
1. Study design and participants
This was a population-based prospective cohort study in Korea using National Health Insurance Service–National Sample Cohort (NHIS-NSC) data collected from January 1, 2002, to December 31, 2010. This cohort comprised members from different professions and demographic attributes, making it representative of the general Korean population. The database contains longitudinal anonymized patient records of all claims data, including diagnostic codes of diseases, treatment details, monthly insurance premiums, prescriptions, clinical laboratory results, physician visits, and demographic information. The diagnostic codes are based on the Korean Classification of Diseases, Sixth Revision (KCD-6), which is compatible with the International Classification of Diseases, Tenth Revision (ICD 10th Revision). The data are arranged on the basis of date of medical treatment and not date of claim [29]. A detailed description of the cohort profile has been published elsewhere [29]. This study was approved by the Seoul National University Institutional Review Board (certificate number: E1811/002-008). This study was based on anonymised health records with no personal identifiers. Therefore, there was no need for informed consent (no direct interaction with patients) and the study was exempted.
2. Data extraction and risk predictors
We extracted data on all risk factors and randomly allocated participants to the derivation and validation samples according to a split sample method using a ratio of 2:1. On the basis of literature reviews and established hypotheses, we extracted data including disease diagnoses, date of diagnosis, sex, age, insurance premium as a proxy for income grade (socioeconomic status), anthropometric measures, smoking status, alcohol consumption, physical activity, fasting blood glucose, total cholesterol, blood pressure, and premorbidities based on medical history (diabetes, hypertension, ulcerative colitis or IBD [Chrohn's disease], CKD, gout, hyperparathyroidism, and coronary artery disease). We imputed missing data by using covariate values measured at the nearest time points.
3. Assessment of covariates
BMI was categorized as <18.5 kg/m2, ≥18.5 kg/m2 to 25 kg/m2, >25 kg/m2 to 30 kg/m2, and >30 kg/m2; smoking as never, former, and current smokers; and alcohol consumption as rarely (<2 times/month), moderate drinker (2 to 3 times/month), and heavy drinker (≥4 times/month). Physical activity was categorized based on frequency per week into low (none), moderately active (1 to 2 times/week), and very active or high (≥3 times/week). Socioeconomic status was categorized based on insurance premium on a scale of 100% to proxy income grade as low (<30%), medium (30% to 60%), and high (>60%). Baseline age was categorized as <25 years, 25 to 34 years, 35 to 44 years, 45 to 54 years, and >54 years. Hypertension status was categorized as systolic blood pressure (SBP) <120 mm Hg and diastolic blood pressure (DBP) <80 mm Hg, SBP ≥120 to 139 mm Hg or DBP ≥80 to 89 mm Hg, SBP ≥140 to 159 mm Hg or DBP ≥90 to 99 mm Hg, and SBP ≥160 mm Hg or DBP ≥100 mm Hg or medication use due to hypertension. Fasting glucose was categorized as <100 mg/dL, 100 to 125 mg/dL, and ≥126 mg/dL or medication use due to diabetes. Total cholesterol was categorized as <200 mg/dL, 200 to 240 mg/dL, and >240 mg/dL. History of diagnosed medical conditions was based on the presence of ICD-10-CM records for diabetes (E10–14), hyperparathyroidism (E21.0–E21.5), hypertension (I10–I15), coronary artery disease or ischemic heart disease (I20–I25), CKD (N18.1–N18.9), gout (M10.0–M10.17), and IBD as selected related codes (K50–K52).
4. Outcome ascertainment and exclusion criteria
The outcome of interest was first diagnosis of nephrolithiasis. Nephrolithiasis (ICD-10-CM) diagnostic codes were extracted as codes N20 (calculus of kidney and ureter), N20.0 (calculus of kidney), N20.1 (calculus of ureter), and N20.2 (calculus of kidney with calculus of ureter). Participants who experienced at least one nephrolithiasis episode at baseline (before January 1, 2004) were excluded from the study. The earliest recorded date of nephrolithiasis diagnosis was the index date for the diagnosis. Participants were censored at the last recorded date, death, or study end date (December 31, 2010).
5. Statistical analyses
1) Descriptive statistics
We used Student's t-test for continuous variables and χ2-test for categorical variables to examine the differences in baseline characteristics between participants in the derivation and validation cohorts stratified on the basis of nephrolithiasis.
2) Model derivation and construction of point-based risk scoring system
We used Cox proportional-hazard regression models to assess associations between risk predictors and nephrolithiasis and to derive prediction equations in the derivation sample. We defined time to event as the time from the first examination date to the date of first nephrolithiasis diagnosis, last recorded date, or date of death. Participants who were not diagnosed with nephrolithiasis or experienced death without nephrolithiasis were censored at date of death or end of study.
We initially conducted three analyses including univariate analysis, partially adjusted analysis, which adjusted for age and sex, and a fully adjusted analysis, which adjusted for age, sex, income grade, smoking status, physical activity, and alcohol consumption. We examined Cox proportional hazards assumptions and assessed the functional form of covariates and adopted clinically meaningful categories for nonlinear covariates. We used hierarchical cluster analysis and assessed estimated coefficients for predictors in the univariate analysis to select representative predictors for each cluster of correlated variables. The model was fitted and variables retained if they were significant at α=0.15 using a backward selection procedure. To construct a risk score, the estimated β coefficient for each variable was multiplied by 100 and rounded to the nearest integer.
3) Model validation and performance evaluation
Calibration is used to measure agreement between predicted probabilities and the actual outcomes. We used Hosmer– Lemeshow (H–L) type χ2 (Nam and D'Agostino), which was calculated by dividing the data into deciles on the basis of the predicted probabilities from the model with the average predicted probabilities for each decile being compared with the actual risk probabilities of nephrolithiasis estimated by the Kaplan–Meier approach. We obtained the associated calibration plot. Discrimination is used to measure the model's ability to distinguish between non-events and events. The model discrimination performance was evaluated on the basis of Harrell's C-statistic, specificity, and sensitivity. We also determined the predictive accuracy (Brier score) and explained variation using Schemper–Henderson predictive measure (R2). All analyses were conducted by using SAS version 9.4 (SAS Inc., Cary, NC, USA) and Python (version 3.7).
RESULTS
1. Baseline characteristics of the derivation and validation groups
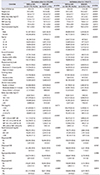
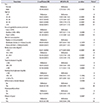
The extracted data for 502,342 participants. We excluded 4,641 participants who had experienced at least one nephrolithiasis episode before January 1, 2004. During a median follow-up time of 8.5 years (range, 2.0–8.9 years) and among 497,701 participants, a total of 15,783 participants (3.2%) were diagnosed with nephrolithiasis. The total number of personyears of follow-up was 4,183,410 years. The mean (standard deviation) value for covariates and the distribution of the baseline characteristics stratified by nephrolithiasis in the derivation and validation cohorts are presented in Table 1. There were no discrepancies between the cohorts. However, there was a significant difference in baseline characteristics between those who developed nephrolithiasis and those who did not (p<0.05; Table 1).
2. Model derivation
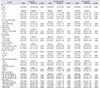
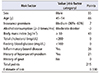
Table 2 presents the estimated coefficients and hazard ratios (HRs) for each covariate in the univariate, partially adjusted, and fully adjusted analyses. On the basis of the univariate associations and after assessment of multicollinearity, a total of 14 covariates that were significantly associated with nephrolithiasis were assessed in the model derivation and retained if they were significant at α=0.15. The parsimonious model comprised age, sex, income grade, alcohol consumption, BMI, fasting blood glucose, IBD, total cholesterol, gout, and hyperparathyroidism. Table 3 presents the estimated coefficients and HRs for predictors in the parsimonious model. In the right-most column of the table are the points associated with the presence of a given level of a risk factor (with the reference level assigned zero points).
3. Model validation
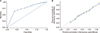
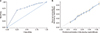
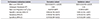
The Harrell's C-statistics were 0.806 (95% confidence interval [CI], 0.790–0.821) and 0.805 (95% CI, 0.782–0.827) for the derivation and validation cohorts, respectively. A value of 0.50 represents no discrimination and 1.00 represents perfect discrimination. The model showed good calibration in the derivation and validation cohorts (H-L χ2=8.6659, p=0.8879, and χ2=8.5893, p=0.8351). The Brier scores were 0.0318 (95% CI, 0.0312–0.0324) and 0.0316 (95% CI, 0.0308–0.0325) in the derivation and validation cohorts, respectively. The Brier score ranges from 0.0 to 1.0 with lower values indicating higher prediction accuracy. The sensitivity and specificity in the validation cohort were 0.793 (95% CI, 0.740–0.875) and 0.510 (95% CI, 0.389–0.653), respectively. The equations explained 34% and 36% of the variation in time to diagnosis of nephrolithiasis in the derivation and validation cohorts, respectively. Table 4, Figs. 1, and 2 presents the model validation results. Subgroup analysis was conducted and model performance was comparable to the results from the main analyses.
4. Prediction equations
The individualized probability of diagnosis of nephrolithiasis within the years of follow-up (ȶ=8) can be estimated by using the following equation:

In the above equation, So(ȶ) denotes the baseline survival probability at time (ȶ) for an individual with all covariates equivalent to zero (0), (βi's) denotes change in log hazard rate, and (xi's) denotes the values of the predictors.
5. Simplified risk score
The median score was 87, and the 25th and 75th percentiles were 61 and 118, respectively. The Youden's index suggested a risk score of ≥89 as the optimal cutoff to define high-risk individuals on the basis of the simplified risk score. This threshold identified 68.3% of individuals who developed nephrolithiasis, whereas application of the lower threshold at the 25th percentile identified 86.2% of the nephrolithiasis events.
6. Practical application of the nephrolithiasis risk score
Based on Table 5, the following example illustrates how nephrolithiasis risk can be estimated by using the simplified points system.
Case: a 52-year-old male with income grade of 30% to 60% who is a moderate drinker (2–3 times/month), is obese (BMI >30 kg/m2), has normal total cholesterol (<200 mg/dL), has normal fasting blood glucose (<100 mg/dL), and is without gout but has hyperparathyroidism and IBD.
For this case, S0(ȶ) is nephrolithiasis-free average survival probability at the end of follow-up (ȶ=8 years), estimated by Cox regression analysis. Based on the point system, the probability of nephrolithiasis can be estimated as follows:
P (Nephrolithiasis) = 1 − (0.9545)exp[(215/100)] = 0.330
DISCUSSION
We derived and validated prediction equations and a simplified risk score to estimate the risk for nephrolithiasis based on a combination of predictors that individuals are likely to know and that are routinely collected in general medical practice. The study was based on a large, representative Korean population from a validated nationwide database [29]. Risk prediction models derived from routinely collected health data are more readily applicable in clinical practice. This model is based on 10 risk predictors: age, sex, income grade, alcohol consumption, BMI, total cholesterol, fasting blood glucose, gout, IBD, and hyperparathyroidism. The model showed excellent calibration, a performance measure that is essential with regard to informing or making decisions in clinical practice. Model calibration primarily determines clinical utility together with the distribution of prediction around the optimum cutoff value and discrimination. The prediction equations also showed good discrimination, with a Harrell's C-statistic value of at least 0.805 in the validation cohort.
Knowledge of personalized risk for nephrolithiasis may motivate individuals to reduce their risks through appropriate interventions, thereby promoting population health and reducing personal and societal costs. This model can be used when a physician counsels an individual after a routine check-up to provide information about the nephrolithiasis risk profile and to give the exact probability of nephrolithiasis. This may motivate lifestyle adjustments and promote adherence to treatment of premorbidities that are predictive of nephrolithiasis. Reducing risk factors associated with metabolic syndrome, proper therapy for individuals with metabolic syndrome, and management of hyperparathyroidism can greatly reduce nephrolithiasis risk. Lifestyle modification can reduce nephrolithiasis risk conferred through components of metabolic syndrome (prevention of complications from obesity, diabetes, and dyslipidemia). However, this prediction model was developed by using data from general medical practice and its performance may be higher in clinical practice settings than in the general population. Nevertheless, the ICD-10-CM codes in Korean health insurance claims data have good accuracy and correspondence with actual health status based on medical charts [30]; therefore, we believe the derived equations are applicable in medical practice.
There does not seem to exist a proper and confirmed method of preventing nephrolithiasis, but lifestyle and dietary adjustments may be helpful, and treatment of premorbidities may generally reduce nephrolithiasis risk. The equations will also improve self-awareness of general health status because the predictors in the model are also predictive of other health outcomes. The information could also be used by the government to reduce the burden of nephrolithiasis risk factors at the population level. Knowledge of the overall health status of a patient with respect to nephrolithiasis risk and expert knowledge from clinical practitioners will create a much clearer picture than either one alone. These variables in the model can easily be obtained in clinical practice, and the points system is simple to use.
Other studies have been done of clinical prediction to diagnose nephrolithiasis on the basis of symptoms, but our study focused on the risk of developing nephrolithiasis in apparently nephrolithiasis-free participants. Previous studies developed diagnostic models in patients suspected of having nephrolithiasis, in patients eligible for computed tomography, for symptomatic stone recurrence, and for determining the presence and type of renal stone. These studies were based on small samples and did not incorporate routinely collected medical data. Here, we have developed and validated prediction equations to estimate future risk of nephrolithiasis among apparently healthy individuals in a large cohort using routinely collected data. Furthermore, the existing models were developed in predominantly white populations and thus may not be appropriate and accurate in predicting nephrolithiasis risk among Asians. Racial differences in distribution and risk for nephrolithiasis have been reported in Asia. To our knowledge, the present study provides the first nephrolithiasis risk model for the Korean population. This model will improve individual decision-making, guide physicians in practice, and define groups at high risk for nephrolithiasis. This study also offers an opportunity for external validation of the model using data from other populations as well as the opportunity to update the model by incorporating other risk predictors in other settings, especially in this era of precision medicine.
This study has the strengths of representativeness, adequate sample size, long follow-up, and lack of selection, recall, and respondent biases. Data collected from health insurance claims in Korea have good accuracy [30], and the diagnosis of nephrolithiasis was made by clinicians and was not based on patient reports [13]. The Korea National Health Insurance Service (KNHIS) covers X-ray, intravenous pyelogram, and non-enhanced computed tomography imaging, and all physicians are required to provide evidence documenting nephrolithiasis [13]. Therefore, this study has considerable face validity.
The KNHIS database was not designed primarily for surveillance but supports other health care activities. Diagnostic suspicion and surveillance biases may occur because symptomatic or high-risk patients are more likely to undergo screening, and a differential intensity search for nephrolithiasis among patients with covariates associated with nephrolithiasis increases the probability of diagnosis. This systematic screening can result in detection of asymptomatic cases of nephrolithiasis in addition to symptomatic cases. Therefore, the incidence rate reported in this study may be higher than the number of symptomatic cases encountered in practice. Our study was also limited by known predictors that are not routinely recorded in medical practice, including family history and dietary risk factors.
CONCLUSIONS
We have derived and validated prediction equations and a simplified nephrolithiasis risk score by using data representative of the entire Korean population. These prediction equations showed good performance and can be used in medical practice by health professionals to identify highrisk groups. Knowledge of individualized risk will motivate lifestyle adjustments and adherence to treatment of premorbidities, thereby reducing nephrolithiasis risk and improving general health.
 XML Download