Journal List > Ann Lab Med > v.40(4) > 1143290

Yang, Hur, Kim, Kim, Shin, Di Somma, and on behalf of the GREAT Network: HDL Subclass Analysis in Predicting Metabolic Syndrome in Koreans With High HDL Cholesterol Levels

Abstract

Background

High-density lipoprotein cholesterol (HDL-C) is a complex mixture of subclasses with heterogeneous atheroprotective activities. We analyzed HDL-C subclass in relation to cardiovascular risk and metabolic syndrome (MetS) in a population with high HDL-C levels.

Methods

A total of 300 Korean individuals with high HDL-C levels (≥2.331 mmol/L) were enrolled following a comprehensive general medical examination including body composition analysis. HDL3-C levels were measured using the HDL3-EX SEIKEN kit (Randox Ltd., Crumlin, UK) and non-HDL3-C levels were calculated by subtracting HDL3-C levels from total HDL-C levels.

Results

HDL3-C levels and HDL3-C proportion had a weak positive correlation with low-density lipoprotein cholesterol (LDL-C) and triglycerides (r=0.21, r=0.25; r=0.26, r=0.34, respectively, all P<0.001); in contrast, non-HDL3-C levels had a weak negative correlation with these parameters (r=−0.17 and r=−0.25, respectively, both P<0.005). HDL3-C levels and HDL3-C proportion were significantly higher in the MetS group (N=8) than in the non-MetS group (0.71 vs 0.63 mmol/L, P=0.001; 29.7 vs 25.8%, P=0.001, respectively); these were the only predictors of MetS among the lipid variables (areas under the curves [AUC]=0.84 and 0.83, respectively, both P=0.001).

Conclusions

In populations with high HDL-C levels, HDL-C subclass may provide a greater amount of information on cardiovascular risk and MetS than HDL-C levels alone.

INTRODUCTION

High-density lipoprotein (HDL) cholesterol (HDL-C) is a well-known independent, inverse predictor of cardiovascular diseases (CVD); it has a modest but useful effect on refining risk estimation [12]. However, the association may be more complicated under certain conditions (e.g., genetically altered HDL-C, use of drugs that elevate HDL-C levels, and extremely high HDL-C levels) [345], and its effect may not be seen in some populations, particularly in those with relatively high HDL-C levels [67]. Furthermore, recent studies have highlighted that very high HDL-C levels may not consistently indicate cardiovascular (CV) risks [56].
HDL comprises several subclass particles, which differ in size, density, and components: the two major subclasses, based on density gradient ultracentrifugation, are larger and buoyant particles of HDL2 (density 1.063–1.125 g/mL) and smaller and denser particles of HDL3 (density 1.125–1.210 g/mL) [891011121314]. These HDL subclasses are thought to play different roles in arteriosclerosis progression and regression, and total HDL-C levels do not always represent HDL particle numbers, subclass distribution, or HDL functions such as cholesterol efflux capacity [8]. Whether HDL subclasses play different roles in atherosclerotic CVD protection or whether measuring HDL subclasses improves risk prediction compared with measuring total HDL-C levels alone has not been determined [1516171819202122].
Metabolic syndrome (MetS) is a cluster of multi-dimensional CV risk factors related to abdominal obesity, type 2 diabetes, dyslipidemia, and hypertension [2324]. Given that low HDL-C levels are one of the five components of MetS diagnosis, it is debatable whether it is necessary to subclassify HDL for a more accurate diagnosis of MetS. A few studies have explored the association between HDL and MetS components, mostly using ultracentrifugation methods, in patient populations [25262728].
Recently, a fully-automated homogeneous assay for HDL3-C measurement has become commercially available; compared with the classic ultracentrifugation method, it allows for simpler, more rapid, and more effective measurement of HDL3-C levels, making it suitable for routine clinical practice [101112]. We analyzed HDL-C subclass in relation to the CV risk and MetS in a Korean population with high HDL-C levels, using a fully automated direct HDL3-C assay. We hypothesized that HDL-C subclass analysis would provide additive value for assessing the CV risk and MetS even in a rather homogenous population with high HDL-C levels.

MATERIALS AND METHODS

Study populations and design

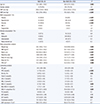
This cross-sectional study was conducted according to the World Medical Association Declaration of Helsinki, and the protocol was approved by the institutional review board of Konkuk University Medical Center (KUMC), Seoul, Korea. Between March and December 2018, we enrolled a total of 300 adult individuals (237 women and 63 men) with high HDL-C levels (≥2.331 mmol/L) based on their annual general medical examination (GME) program, which included body composition analysis and routine blood analysis. We retrospectively reviewed their medical records including routine check-up results and self-administered questionnaires; no gender difference was observed in their lipid profiles and they were considered free of coronary heart disease (CHD). Individual characteristics are presented in Table 1.
Body composition was analyzed using InBody770 (InBody Co., Ltd., Seoul, Korea) based on the direct segmental multi-frequency bioelectrical impedance method [29]. The following parameters were determined: body weight (kg), skeletal muscle mass (kg), body mass index (BMI, kg/m2), waist circumference (cm), waist/hip ratio, body fat mass (kg), body fat (%), and visceral fat area (cm2).
MetS was defined according to the National Cholesterol Education Program Adult Treatment Panel III [23] and modified Asian criteria [24] as the presence of any three of the following five traits: (1) Abdominal obesity in Asians, defined as a waist circumference ≥90 cm in men and ≥80 cm in women; (2) fasting serum triglyceride (TG) levels ≥1.695 mmol/L or drug treatment for elevated TG; (3) serum HDL-C levels <1.036 mmol/L in men and <1.295 mmol/L in women or drug treatment for low HDL-C levels; (4) blood pressure (BP) ≥130/85 mm Hg or drug treatment for elevated BP; (5) fasting plasma glucose (FPG) level ≥5.55 mmol/L or drug treatment for elevated FPG level. As the HDL-C levels in all individuals were >2.331 mmol/L, MetS was diagnosed based on the other four criteria.

Lipid analysis

Blood samples were drawn after at least 12 hours of overnight fasting following the routine GME protocol and were centrifuged within 1 hour. The serum samples were stored at −80℃ until use. Total cholesterol (Total-C), low-density lipoprotein cholesterol (LDL-C), HDL-C, and TG levels were measured using commercially available enzymatic reagents (Kyowa Kirin Co., Ltd., Tokyo, Japan) on a chemistry analyzer (TBA-200FR NEO, Toshiba Medical Systems Co., Tokyo, Japan). HDL3-C levels were measured on the same analyzer using the HDL3-EX “SEIKEN” kit (Randox Laboratories Ltd., Crumlin, UK), according to the manufacturer's protocol. Briefly, this fully automated direct HDL subclass assay consists of two reaction steps. First, the cholesterol released from the lipoprotein particles is degraded to water and oxygen through hydrolysis by cholesterol esterase, oxidization by cholesterol oxidase, and the subsequent catalase reaction. Second, a specific surfactant selectively reacts with HDL3-C. Compared with the ultracentrifugation method, this assay showed a much stronger correlation (r=0.92 based on the manufacturer's claim; r=0.90 with a mean difference of 0.13 mmol/L according to Gómez, et al. [12]). The manufacturer claimed that the assay range was from 4 to 60 mg/dL (0.1036–1.554 mmol/L) and that the CVs (%) for total precision were 1.6% and 1.4% (Control I and II, respectively). Non-HDL3-C levels were calculated by subtracting HDL3-C levels from total HDL-C levels.

Statistical analysis

We performed the statistical analysis using dBSTAT (DBSTAT version 5.0 Chuncheon, Korea: DBSTAT Co; 2010. http://dbstat.com) and SPSS software version 17.0 (SPSS Inc., Chicago, IL, USA). Data were expressed as medians (interquartile ranges) for continuous variables or numbers (percentages) for categorical or binary variables. We assessed the correlation between continuous variables using Pearson's correlation coefficient (r), and the correlation was interpreted as negligible (<0.1), weak (0.1–0.39), moderate (0.40–0.69), strong (0.70–0.89), or very strong (≥0.9) based on the absolute magnitude [30]. We compared clinical, body composition, and laboratory data of individuals with or without MetS using the Mann-Whitney U-test (continuous variables) and chi-square test or Fisher's exact test (categorical variables). Individuals were assigned to one of four groups by the number of MetS components (0, N=201; 1, N=78; 2, N=13; and 3, N=8) and compared using the Kruskal-Wallis test with a post hoc Dunn test. To identify predictors of MetS, we analyzed receiver-operating characteristic (ROC) curves and compared the areas under the curves (AUC). P (2-tailed)<0.05 was considered statistically significant.

RESULTS

HDL subclass distribution and correlations with other parameters

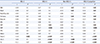
The correlations between HDL subclass and GME parameters reflecting MetS components or lipid profiles are presented in Table 2. Non-HDL3-C levels showed a weak negative correlation with body component parameters (BMI, waist circumference, and fat mass) and lipid profiles (LDL-C and TG levels). In contrast, HDL3-C levels and HDL3-C proportion showed weak positive correlations with these parameters, especially with LDL-C and TG levels (r=0.21 and r=0.25; r=0.26 and r=0.34, respectively, all P<0.001).

MetS

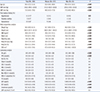
Of the 300 individuals, eight (2.7%) were diagnosed as having MetS (Table 3) [31]. No differences in total HDL-C levels were observed between the two groups; however, HDL3-C levels and HDL3-C proportion were significantly higher in the MetS group than in the non-MetS group (0.71 vs 0.63 mmol/L, P=0.001; 29.7% vs 25.8%, P=0.001, respectively).
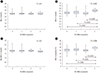
HDL3-C levels and HDL3-C proportion differed significantly across the four groups according to the number of MetS components (P=0.002 and P=0.006, respectively); in each group, they were significantly higher in the three MetS component group than in the other groups (Fig. 1).
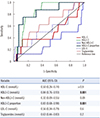
ROC curve analysis demonstrated that only HDL3-C levels and HDL3-C proportion could predict MetS in a population with high HDL-C levels (both P=0.001; Fig. 2). Using an optimal cutoff level of 0.653 mmol/L, HDL3-C levels predicted MetS with 100% sensitivity and 60.6% specificity. Using an optimal cutoff level of 40%, HDL3-C proportion predicted MetS with 75.0% sensitivity and 87.3% specificity.

DISCUSSION

To the best of our knowledge, this is the first HDL subclass analysis using a fully automated homogenous assay for HDL3-C in a population with high HDL-C levels (≥2.331 mmol/L). In general, high HDL-C levels alone have been considered a negative risk factor for CHD and a GME setting naturally excludes acute cardiac diseases. We hypothesized that HDL-C subclass analysis would provide additive value to for assessing the CV risk and MetS in this population and demonstrated a potential additive value in subclassifying HDL-C compared with total HDL-C levels; the following were noted: (1) different correlations between HDL subclasses and BMI, waist circumference, fat mass, LDL-C levels, and TG levels; (2) improved prediction of MetS with HDL3-C levels (AUC=0.84) and HDL3-C proportion (AUC=0.83), but not with total HDL-C levels (AUC=0.5).
Interestingly, with regard to body composition and lipid parameters, an inverse correlation was observed between HDL subclasses (HDL3-C vs non-HDL3-C) and well-established CVD risk factors; in contrast to non-HDL3-C, HDL3-C levels and HDL3-C proportion showed a weak positive correlation with BP, LDL-C levels, and TG levels (Table 2). Given that the role of HDL subclass in atheroprotective effects has not been consistently determined, it was interesting to observe this contrasting relationship in this homogenous population, especially as all individuals in this study group had high HDL-C levels. Our findings indicate the potential value of HDL subclass analysis in a wide range of individuals. The use of proportions or ratios might be preferable to using simple subclass levels in order to generalize across the full spectrum of HDL-C levels [26]. Although a causal relationship could not be elucidated [3233], we demonstrated the dynamic changes in HDL3-C proportion, suggesting its potential role as a biomarker for atherosclerotic CVD [25].
Our study is unique in terms of study population; we enrolled individuals with high HDL-C levels, without prior CHD. Of note, HDL3-C levels or HDL3-C proportion demonstrated an additive value for MetS prediction compared with total HDL-C alone, even in this population; HDL subclass distribution successfully refined the risk of MetS, as a higher HDL3-C proportion indicated MetS (Figs. 1 and 2). Despite a strong inverse correlation between HDL-C levels and MetS, higher levels of HDL3-C predicted MetS in a contradictory manner; this “HDL3-C paradox” might be an important concept for understanding lipid dynamics related to MetS [25262728]. For example, exercise increases total HDL-C, mostly HDL2 or the “good HDL” subfraction via reduced hepatic lipase activity and elevated lecithin–cholesterol acyltransferase activity (conversion of HDL3 into HDL2); this may decrease an individual's susceptibility to MetS [27].
Our study has several limitations. This was a small-sized, single-center study on an Asian population. Accordingly, the results may not be extrapolated, particularly to other geographical regions or ethnicities. We wanted to explore the heterogeneity of HDL-C subclass even in a relatively homogenous and specific population with high HDL-C levels. Owing to this narrow study population, only 3% of the individuals were diagnosed as having MetS, and there is a possibility that we failed to identify some changes with potential significance [34]. Additionally, confounding factors (e.g., diet, exercise, smoking, alcohol, or genetic factors) were not controlled and non-HDL3-C levels were not measured but calculated by subtracting HDL3-C levels from total HDL-C levels. A longitudinal study involving a larger number of individuals with a wider range of HDL3-C levels would be necessary to elucidate the clinical value of HDL-C subclass analysis.
In conclusion, we demonstrated that in a population with high HDL-C levels, HDL-C subclasses can refine the CV risk and MetS risk profiles better than HDL-C levels alone. The clinical utility of HDL-C subclass analysis would be further facilitated using a fully automated assay. Further studies spanning a full-range HDL-C population are warranted to determine the subclass distribution and major adverse CV events more broadly and to support and generalize the present findings.

Figures and Tables

Fig. 1

Box-and-whisker plots for the distribution of HDL-C (A), HDL3-C (B), non-HDL3-C (C), and HDL3-C proportion (D) stratified by the number of MetS components (0, N=201; 1, N=78; 2, N=13; and 3, N=8). HDL3-C levels and HDL3-C proportion were significantly higher in the three MetS component group than in the other groups (P<0.05, Kruskal-Wallis test with post-hoc Dunn test; P with statistical significance is indicated). The central box represents the values from the lower to upper quartile (25–75 percentile). The middle line represents the median. The vertical line extends from the minimum to the maximum value.

Abbreviations: HDL-C, high-density lipoprotein cholesterol; HDL3-C, high-density lipoprotein 3 cholesterol; MetS, metabolic syndrome.
alm-40-297-g001
Fig. 2

Receiver operator characteristic curves of lipid profiles for predicting MetS in individuals with high HDL-C levels (≥2.331 mmol/L). HDL3-C levels and HDL3-C proportion were significant (P=0.001) and comparable (P=0.9) for predicting MetS.

Abbreviations: MetS, metabolic syndrome; HDL-C, high-density lipoprotein cholesterol; HDL3-C, high-density lipoprotein 3 cholesterol; LDL-C, low-density lipoprotein cholesterol; AUC, area under the curve; CI, confidence interval.
alm-40-297-g002
Table 1

Characteristics of the study population

alm-40-297-i001

Values are expressed as median (interquartile range), number (percentage), or proportion.

P is based on the comparison between men and women using the Mann-Whitney U test (quantitative variables) and Chi-square or Fisher's exact test (categorical variables); bold text indicates P<0.05.

*Treated with single calcium channel blockers (N=4), single angiotensin II receptor blockers (N=2), calcium channel blockers with angiotensin II receptor blockers (N=2), or lifestyle modification only (N=3).

Treated with sitagliptin (N=1) or lifestyle modification only (N=1).

Treated with atorvastatin (N=6), rosuvastatin (N=3), pitavastatin (N=2), or lifestyle modification only (N=4).

Abbreviations: SBP, systolic blood pressure; DBP, diastolic blood pressure; BMI, body mass index; VFA, visceral fat area; Hb, hemoglobin; FPG, fasting plasma glucose; HbA1C, glycated hemoglobin; Total-C, total cholesterol; LDL-C, low-density lipoprotein cholesterol; HDL-C, high-density lipoprotein cholesterol; HDL3C, high-density lipoprotein 3 cholesterol; TG, triglycerides; AST, aspartate transaminase; ALT, alanine transaminase; GFR, glomerular filtration rate based on the Modification of Diet in Renal Disease Study equation.

Table 2

Correlations between HDL subclass and parameters reflecting metabolic syndrome components or lipid profiles

alm-40-297-i002

Bold text indicates P<0.05.

Abbreviations and units: see Table 1.

Table 3

Comparison between the two groups with and without metabolic syndrome (MetS)

alm-40-297-i003

Values are expressed as median (inter-quartile range) or number (percentage).

Bold text indicates P<0.05.

*National Cholesterol Education Program Adult Treatment Panel III with Asian modification: (1) abdominal obesity: waist circumference ≥90 cm (men) or ≥80 cm (women) in Asian individuals; (2) blood pressure ≥130/85 mm Hg or medication; (3) fasting glucose ≥5.55 mmol/L or drug treatment; (4) HDL-C <1.036 mmol/L (men) or <1.295 mmol/L (women) or drug treatment; (5) TG ≥1.695 mmol/L or drug treatment [2324].

Data was available for 294 subjects. Adequate is defined as one standard drink (14 g of ethanol, as found in five ounces of wine or 12 ounces of beer) per day or seven standard drinks per week with no more than three drinks per occasion. Heavy alcohol use is defined as binge drinking (four drinks for women and five drinks for men) on five or more days in the past month [31]. There was a weak positive correlation with alcohol grade vs HDL3-C (r=0.13, P=0.03), but not with HDL-C (r=0.04, P=0.5; data not shown).

Abbreviations: see Table 1.

ACKNOWLEDGEMENTS

None.

Notes

AUTHOR CONTRIBUTIONS HSY, SJK, and MH designed the research; HK and MH performed experiments; HSY, HK, SJK, and SS analyzed the data; HSY and MH wrote the manuscript; SDS served as a scientific advisor; all authors reviewed and approved the manuscript.

CONFLICT OF INTEREST No potential conflicts of interest relevant to this article were reported.

RESEARCH FUNDING This work was supported by Konkuk University Medical Center Research Grant 2018.

References

1. Wilson PW, Abbott RD, Castelli WP. High density lipoprotein cholesterol and mortality. The Framingham Heart Study. Arteriosclerosis. 1988; 8:737–741.
crossref
2. Gordon DJ, Rifkind BM. High-density lipoprotein–the clinical implications of recent studies. N Engl J Med. 1989; 321:1311–1316.
pmid
3. Voight BF, Peloso GM, Orho-Melander M, Frikke-Schmidt R, Barbalic M, Jensen MK, et al. Plasma HDL cholesterol and risk of myocardial infarction: a Mendelian randomisation study. Lancet. 2012; 380:572–580.
pmid pmc
4. AIM-HIGH Investigators. Boden WE, Probstfield JL, Anderson T, Chaitman BR, Desvignes-Nickens P, et al. Niacin in patients with low HDL cholesterol levels receiving intensive statin therapy. N Engl J Med. 2011; 365:2255–2267.
crossref pmid
5. Madsen CM, Varbo A, Nordestgaard BG. Extreme high-density lipoprotein cholesterol is paradoxically associated with high mortality in men and women: two prospective cohort studies. Eur Heart J. 2017; 38:2478–2486.
pmid
6. Catapano AL, Graham I, De Backer G, Wiklund O, Chapman MJ, Drexel H, et al. 2016 ESC/EAS guidelines for the management of dyslipidaemias. Eur Heart J. 2016; 37:2999–3058.
crossref pmid
7. Mortensen MB, Afzal S, Nordestgaard BG, Falk E. The high-density lipoprotein-adjusted SCORE model worsens SCORE-based risk classification in a contemporary population of 30,824 Europeans: the Copenhagen General Population Study. Eur Heart J. 2015; 36:2446–2453.
pmid pmc
8. Vallejo-Vaz AJ, Ray KK. Cholesterol efflux capacity as a novel biomarker for incident cardiovascular events: has high-density lipoprotein been resuscitated? Circ Res. 2015; 116:1646–1648.
pmid
9. Wallentin L, Fåhraeus L. HDL3 and HDL2 determination by a combined ultracentrifugation and precipitation procedure. Clin Chim Acta. 1981; 116:199–208.
crossref pmid
10. Mueller O, Chang E, Deng D, Franz T, Jing D, Kincaid R, et al. PROCAM Study: risk prediction for myocardial infarction using microfluidic high-density lipoprotein (HDL) subfractionation is independent of HDL cholesterol. Clin Chem Lab Med. 2008; 46:490–498.
crossref pmid
11. Ashmaig ME, Gupta S, McConnell JP, Warnick GR. Validation of a novel homogeneous assay for of HDL3-C measurement. Clin Chim Acta. 2013; 425:37–41.
crossref pmid
12. Gómez F, Camps J, Simó JM, Ferré N, Joven J. Agreement study of methods based on the elimination principle for the measurement of LDL- and HDL-cholesterol compared with ultracentrifugation in patients with liver cirrhosis. Clin Chem. 2000; 46:1188–1191.
pmid
13. Rosenson RS, Brewer HB Jr, Chapman MJ, Fazio S, Hussain MM, Kontush A, et al. HDL measures, particle heterogeneity, proposed nomenclature, and relation to atherosclerotic cardiovascular events. Clin Chem. 2011; 57:392–410.
crossref pmid
14. Camont L, Chapman MJ, Kontush A. Biological activities of HDL subpopulations and their relevance to cardiovascular disease. Trends Mol Med. 2011; 17:594–603.
crossref pmid
15. Joshi PH, Toth PP, Lirette ST, Griswold ME, Massaro JM, Martin SS, et al. Association of high-density lipoprotein subclasses and incident coronary heart disease: The Jackson Heart and Framingham Offspring Cohort Studies. Eur J Prev Cardiol. 2016; 23:41–49.
crossref
16. Yu S, Yarnell JW, Sweetnam P, Bolton CH. High density lipoprotein subfractions and the risk of coronary heart disease: 9-years follow-up in the Caerphilly Study. Atherosclerosis. 2003; 166:331–338.
crossref pmid
17. Albers JJ, Slee A, Fleg JL, O'Brien KD, Marcovina SM. Relationship of baseline HDL subclasses, small dense LDL and LDL triglyceride to cardiovascular events in the AIM-HIGH clinical trial. Atherosclerosis. 2016; 251:454–459.
crossref pmid pmc
18. Martin SS, Khokhar AA, May HT, Kulkarni KR, Blaha MJ, Joshi PH, et al. HDL cholesterol subclasses, myocardial infarction, and mortality in secondary prevention: the Lipoprotein Investigators Collaborative. Eur Heart J. 2015; 36:22–30.
crossref pmid
19. Williams PT, Feldman DE. Prospective study of coronary heart disease vs. HDL2, HDL3, and other lipoproteins in Gofman's Livermore Cohort. Atherosclerosis. 2011; 214:196–202.
crossref pmid
20. Lamarche B, Moorjani S, Cantin B, Dagenais GR, Lupien PJ, Després JP. Associations of HDL2 and HDL3 subfractions with ischemic heart disease in men. Prospective results from the Quebec Cardiovascular Study. Arterioscler Thromb Vasc Biol. 1997; 17:1098–1105.
pmid
21. Salonen JT, Salonen R, Seppänen K, Rauramaa R, Tuomilehto J. HDL, HDL2, and HDL3 subfractions, and the risk of acute myocardial infarction. A prospective population study in eastern Finnish men. Circulation. 1991; 84:129–139.
crossref pmid
22. Superko HR, Pendyala L, Williams PT, Momary KM, King SB 3rd, Garrett BC. High-density lipoprotein subclasses and their relationship to cardiovascular disease. J Clin Lipidol. 2012; 6:496–523.
crossref pmid
23. Expert Panel on Detection, Evaluation, and Treatment of High Blood Cholesterol in Adults. Executive summary of the third report of the National Cholesterol Education Program (NCEP) expert panel on detection, evaluation, and treatment of high blood cholesterol in adults (Adult Treatment Panel III). JAMA. 2001; 285:2486–2497.
pmid
24. Tan CE, Ma S, Wai D, Chew SK, Tai ES. Can we apply the National Cholesterol Education Program Adult Treatment Panel definition of the metabolic syndrome to Asians? Diabetes Care. 2004; 27:1182–1186.
crossref pmid
25. Lee M, Jang Y, Kim K, Cho H, Jee SH, Park Y, et al. Relationship between HDL3 subclasses and waist circumferences on the prevalence of metabolic syndrome: KMSRI-Seoul Study. Atherosclerosis. 2010; 213:288–293.
crossref pmid
26. Moriyama K, Negami M, Takahashi E. HDL2-cholesterol/HDL3-cholesterol ratio was associated with insulin resistance, high-molecular-weight adiponectin, and components for metabolic syndrome in Japanese. Diabetes Res Clin Pract. 2014; 106:360–365.
crossref pmid
27. Tabara Y, Arai H, Hirao Y, Takahashi Y, Setoh K, Kawaguchi T, et al. Different inverse association of large high-density lipoprotein subclasses with exacerbation of insulin resistance and incidence of type 2 diabetes: The Nagahama study. Diabetes Res Clin Pract. 2017; 127:123–131.
crossref pmid
28. Generoso G, Bensenor IM, Santos RD, Santos IS, Goulart AC, Jones SR, et al. Association between high-density lipoprotein subfractions and low-grade inflammation, insulin resistance, and metabolic syndrome components: The ELSA-Brasil study. J Clin Lipidol. 2018; 12:1290–1297.e1.
crossref pmid
29. McLester CN, Nickerson BS, Kliszczewicz BM, McLester JR. Reliability and agreement of various InBody body composition analyzers as compared to dual-energy X-ray absorptiometry in healthy men and women. J Clin Densitom. 2018; 11. 03. DOI: 10.1016/j.jocd.2018.10.008. [Epub ahead of print].
crossref
30. Schober P, Boer C, Schwarte LA. Correlation coefficients: appropriate use and interpretation. Anesth Analg. 2018; 126:1763–1768.
pmid
31. Patrick ME. High-intensity drinking. Alcohol Res. 2018; 39:49–55.
pmid pmc
32. Anagnostis P, Stevenson JC, Crook D, Johnston DG, Godsland IF. Effects of menopause, gender and age on lipids and high-density lipoprotein cholesterol subfractions. Maturitas. 2015; 81:62–68.
crossref pmid
33. Tian L, Li C, Liu Y, Chen Y, Fu M. The value and distribution of high-density lipoprotein subclass in patients with acute coronary syndrome. PLoS One. 2014; 9:e85114.
crossref
34. Yang D, Cai Q, Qi X, Zhou Y. Postprandial lipid concentrations and daytime biological variation of lipids in a healthy Chinese population. Ann Lab Med. 2018; 38:431–439.
crossref pmid pmc
TOOLS
ORCID iDs

Hyun Suk Yang
https://orcid.org/0000-0002-7056-3648

Mina Hur
https://orcid.org/0000-0002-4429-9978

Hanah Kim
https://orcid.org/0000-0002-3266-638X

Sun Jong Kim
https://orcid.org/0000-0003-3237-4499

Sojung Shin
https://orcid.org/0000-0003-1851-4993

Salvatore Di Somma
https://orcid.org/0000-0002-1717-6585

Similar articles