

 PDF
PDF Citation
 Print
Print


INTRODUCTION
Balance is the ability to maintain the body's center of mass over its base of support in a given environment. This is a complex process affected by various factors. Balancing requires accurate evaluation of sensory information and appropriate motor response to this information [12]. Patients with stroke exhibit various sequelae including impaired balance. Balance control ability is an essential part of daily living, and is important for stable and effective performance of gait, movement, and activities of daily living [34]. Thus, evaluating balance control ability in stroke patients is important for preventing unsafe activities and establishing effective treatment interventions.
Scales which are commonly used to evaluate balance control ability in clinical practice include: the Korean version of the Berg Balance Scale (K-BBS), the Motor Assessment Scale, the arm raise and forward reach test, the step/tap and step-up tests, and the Modified Functional Reach Test [5678]. In the meantime, there are many studies in post-stroke balance control impairment focus on the assessment and training of balance in hemiplegic patients [91011].
Previous studies have reported an attempt to objectively evaluate and quantify sitting balance [12]. However, to measure sitting pressure, most studies measure the mean peak pressure of the center of pressure. We measured the difference of sitting pressure between the affected and unaffected sides (DSPAU) using sitting pressure to identify sitting imbalance. None of the studies measured the degree of recovery of sitting imbalance using DSPAU. Moreover, there are few studies that examine the changes in sitting pressure after stroke rehabilitation, or the correlations between sitting pressure and functional assessment results.
Therefore, we examine changes in sitting pressure using a force platform and functional assessment before and after rehabilitation in hemiplegic stroke patients. We analyze data according to stroke characteristics, and examine the correlations between sitting pressure and functional assessment results. This study aimed to investigate the differences between sitting balance and functional status or parameters according to characteristics stroke patients.
MATERIALS AND METHODS
Participants
We enrolled patients who were transferred to our Department of Physical Medicine & Rehabilitation after completing acute treatment at the Department of Neurology and Neurosurgery. These stroke patients were diagnosed with hemiplegia due to the first stoke between March 2012 and September 2016. Exclusion criteria were as follows: 1) double hemiplegia from lesions in bilateral hemispheres, 2) subjects with visual or auditory abnormalities that could affect balance control, 3) patients with severe cognitive impairment or aphasia who could not follow the examiner's instructions, 4) subjects who were suffering from a severe internal disease, and 5) subjects with musculoskeletal problems such as back pain. This retrospective medical record review at our institution was approved by the Institutional Review Board (IRB) of Chonbuk National University Hospital, and the need for informed consent was waived by the board (IRB number CUH 2019-06-060-001).
Procedure
After being transferred to the Department of Physical Medicine and Rehabilitation, patients underwent comprehensive rehabilitation therapy lasting 3 weeks, including sitting training using core muscle strengthening exercises and trunk rotation, in order to strengthen trunk stability.
Measures
Sitting pressures were evaluated using a force platform, and other clinical functional scales were concurrently measured, such as the Korean version of Modified Barthel Index (K-MBI), K-BBS, 10-meter walk test (10mWT), and Medical Research Council (MRC) scales. These tests were conducted before and after rehabilitation therapy.
Sitting pressure measurement
Measurement of sitting pressure was performed using a CONFOR Mat® System (Tekscan, South Boston, MA, USA). This device consists of a force platform, a computer, and a Liquid-crystal display monitor. When pressure is applied to the force platform, a different color is displayed according to the amount of pressure. Prior to testing, the force platform was placed on a therapeutic bed and an automatic normalization process was implemented. The patient stands with a support next to the therapeutic bed and then, upon the examiner's instruction, sits safely on the force platform. After sitting on the force platform, the patient placed both feet on the ground, placed both hands on their lap, and sat upright without support for approximately 10 seconds, at the end of which the pressure from the patient's buttocks was measured [121314] (Fig. 1). We measured pressure for 10 seconds, ensuring that both buttocks and thighs were well distributed throughout the quadrants as shown in Fig. 2. We then took the mean value to calculate the difference in mean pressure between the affected and unaffected buttocks. In contrast to previous studies, which mostly measured sitting pressure at the center of pressure, we used DSPAU to determine the difference in sitting balance between the left and right sides. Measurements were taken twice and the mean value was used in the analysis.
Fig. 1
Posture for measuring the sitting pressure.
After sitting on the force platform, the patient places both feet on the ground, both hands on their lap, and sits upright without support for approximately 10 seconds, at the end of which, the pressure exerted by the patient's buttocks is measured.
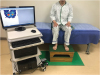
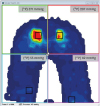
Fig. 2
Measuring the sitting pressure on a force platform by CONFOR Mat® System (Tekscan, South Boston, MA, USA). As shown in the figure, pressure was measured for 10 seconds once both, the buttocks and thighs were well-distributed in the quadrants. After measuring the mean pressure for the affected and unaffected buttocks, the difference between the 2 pressures was computed. The numbers on the upper right side of each quadrant are the mean pressure. Difference in the mean sitting pressure between the affected and unaffected buttock areas = mean sitting pressure in the affected buttock area − mean sitting pressure in the unaffected buttock area.
K-MBI
The K-BMI is an index used to assess the activities of daily living in stroke patients, which has been standardized for use in Korea. It has proven reliability and validity [15]. This index consists of 10 items for assessment (grooming, bathing, feeding, toilet use, stairs, dressing, bowels, bladder, ambulation, and bed to chair transfer). Each item is scored on a 5-point scale, and the individual scores are weighted according to the importance of each item. Higher scores indicate an independent level of ability to perform activities of daily living.
K-BBS
The K-BBS is comprised of 14 items in total, which quantitatively measure balance control ability and fall risk [6]. Each item is scored from 0 to 4. A total score closer to 56 points indicates better balance and lower fall risk. The instrument has a high inter-tester reliability when used on stroke patients [3], thereby facilitating the evaluation of balance control across patients using 1 simple instrument.
10mWT
In the 10mWT, the subject is asked to walk a straight 14 m path at a comfortable speed. To account for acceleration and deceleration, the first and last 2 m of the path are excluded, and the time for the subject to walk the middle 10 m is measured. When used as an index to predict gait ability in stroke patients, the 10mWT shows good reliability [16]. In this study, patients who were capable of walking 10 m independently were defined as ambulatory, irrespective of the use of a walking stick or leg brace. After the 10mWT, walking speed (m/s) was calculated and used in the study analysis.
Statistical analysis
We performed the statistical analyses using SPSS version 24.0 for Windows (SPSS Inc., Chicago, IL, USA). First, the general characteristics of the subjects were analyzed using descriptive statistics. The changes of the sitting pressure and functional assessment in measured variables before and after treatment were verified using a paired t-test when the normality is satisfied or Wilcoxon-signed test if the normality requirement is not satisfied. The significance of changes in sitting pressures and functional assessment between subgroups (right and left hemiplegia groups, ambulatory and non-ambulatory groups, and groups by MRC scales) was verified using an independent t-test and one-way analysis of variance (ANOVA) in a group of data with normality, and Mann-Whitney and Kruskal-Wallis test in the other groups without normality. The Scheffe's method was used for post-hoc test. The Pearson correlation coefficient was used to analyze the correlation between changes in sitting pressure and functional measurements. Statistical significance was taken to be p < 0.05.
RESULTS
General characteristics of the subjects
Of the 73 subjects, 47 were male and 26 were female. The average age was 60.56 ± 15.86 years. Forty-eight patients had ischemic stroke and 25 patients had hemorrhagic stroke. Left hemiplegia was observed in 39 patients and right hemiplegia in 34 patients. At the initial evaluation, 35 patients were able to perform the 10mWT and 38 patients were not able to. When the patients were divided according to the MRC grade for upper and lower limbs, 28 patients had an MRC grade of between 3 and 5 for both upper and lower limbs, and 17 patients had an MRC grade of between 3 and 5 for upper limbs but between 0 and 2 for lower limbs. Seven patients had an MRC grade of between 3 and 5 for lower limbs but between 0 and 2 for upper limbs, and 21 patients had a MRC grade of between 0 and 2 for both upper and lower limbs. After stroke, patients were transferred to the Department of Rehabilitation within a mean of 24.07 ± 78.64 days (Table 1).
Table 1
Demographic and baseline clinical characteristics of stroke patients
Changes in measurements before and after treatment
The DSPAU, the K-BBS, the 10mWT, and the K-MBI were measured before and after 3 weeks of rehabilitation therapy. The DSPAU was 158.92 ± 109.73 mmHg before rehabilitation therapy, and 92.51 ± 85.59 mmHg after rehabilitation. K-MBI was 51.33 ± 25.55 before rehabilitation therapy and was 71.16 ± 17.86 after rehabilitation. K-BBS was 23.71 ± 17.17 before rehabilitation and was 35.58 ± 15.85 after rehabilitation. Walking speed in the 10mWT was 0.29 ± 0.36 m/s before rehabilitation and was 0.58 ± 0.45 m/s after rehabilitation. The DSPAU, K-MBI, K-BBS, and 10mWT were significantly changed following rehabilitation (p < 0.001) (Table 2).
Table 2
Changes in DSPAU and functional scale scores after the 3-week rehabilitation period

Comparisons of changes in sitting pressure in each group before and after rehabilitation treatment
We classified the patients into subgroups according to affected brain lesion, performance in 10mWT, and MRC grade for upper and lower limbs, in order to examine the difference in DSPAU and functional test results according to stroke characteristics. Then, DSPAU, K-MBI, K-BBS, and 10mWT values before and after rehabilitation, as well as the changes in these parameters, were compared for each subgroup.
Right hemiplegia and left hemiplegia groups
DSPAU and functional assessment parameters were compared before and after rehabilitation in 39 right hemiplegia patients and 34 left hemiplegia patients. Furthermore, the changes in these parameters after rehabilitation in both groups were compared. Before rehabilitation, DSPAU in the right and left hemiplegia groups were 153.85 ± 106.30 mmHg and 164.74 ± 114.86 mmHg, respectively, and K-MBI was 48.41 ± 25.33 and 54.68 ± 25.77, respectively. K-BBS in the right and left hemiplegia groups was 24.90 ± 16.35 and 22.35 ± 17.90, respectively, and 10mWT was 0.30 ± 0.32 m/s and 0.27 ± 0.41 m/s, respectively. There were no significant differences in all tests between the 2 groups prior to rehabilitation. After rehabilitation, the right hemiplegia group showed a DSPAU of 86.38 ± 84.27 mmHg, K-MBI of 70.38 ± 18.38, K-BBS of 36.08 ± 15.74, and 10mWT 0.60 ± 0.45 m/s. The left hemiplegia group showed a DSPAU of 99.53 ± 87.82 mmHg, K-MBI of 72.06 ± 17.48, K-BBS of 35.00 ± 16.20, and 10mWT of 0.54 ± 0.44 m/s, with no significant differences between the 2 groups. In the right hemiplegia group, the change (Δ) in DSPAU (ΔDSPAU) was 67.46 ± 61.18 mmHg, ΔK-MBI was 21.97 ± 14.16, ΔK-BBS was 11.18 ± 7.14, and Δ10mWT was 0.30 ± 0.28 m/s. In the left hemiplegia group, ΔDSPAU, ΔK-MBI, ΔK-BBS, and Δ10mWT were 65.21 ± 64.64 mmHg, 17.38 ± 13.81, 12.65 ± 10.82, and 0.27 ± 0.24 m/s, respectively. There were no statistically significant differences in these parameters between the 2 groups (Table 3).
Table 3
Comparison of values and changes in DSPAU and functional scale scores between the right and left hemiplegia groups

Ambulatory and non-ambulatory groups
Patients were divided into the ambulatory group (n = 35), who were able to perform 10mWT prior to rehabilitation, and the non-ambulatory group (n = 38), who were not able to perform 10mWT prior to rehabilitation. The ambulatory group showed a DSPAU of 89.00 ± 63.40 mmHg, K-MBI of 67.69 ± 18.69, and K-BBS of 35.89 ± 14.28. The non-ambulatory group showed a DSPAU of 223.32 ± 104.18 mmHg, K-MBI of 36.26 ± 21.52, and K-BBS of 12.50 ± 10.81. Significant differences were observed in all parameters between the 2 groups (p < 0.001). After rehabilitation, DSPAU in the ambulatory group and non-ambulatory group was 47.06 ± 46.93 mmHg and 134.37 ± 92.08 mmHg, respectively, and K-MBI was 82.14 ± 9.97 and 61.05 ± 17.62, respectively. K-BBS was 44.94 ± 10.38 and 26.95 ± 15.19, respectively. The 2 groups significantly differed in DSPAU, K-MBI, and K-BBS after rehabilitation (p < 0.001). In the ambulatory group, ΔDSPAU, ΔK-MBI, and ΔK-BBS were 41.94 ± 38.59 mmHg, 14.46 ± 10.61, and 9.06 ± 7.78 respectively. In the non-ambulatory group, ΔDSPAU was 88.95 ± 71.52 mmHg, ΔK-MBI was 24.79 ± 15.17, and ΔK-BBS was 14.45 ± 9.38. In a comparison of the 2 groups, significant differences were observed in DSPAU, K-MBI, and K-BBS in the non-ambulatory group as compared to the ambulatory group (p < 0.001, p = 0.001, and p = 0.005, respectively) (Table 4).
Table 4
Comparison of values and changes in DSPAU and functional scale scores between the ambulatory and non-ambulatory groups

Classification according to MRC grade
Patients were divided into the following 4 groups: MRC grade 3–5 for both upper and lower limbs (whole dominant group, n = 28), MRC grade 3–5 for upper limbs but 0-2 for lower limbs (upper dominant group, n = 17), MRC grade 3–5 for lower limbs but 0–2 for upper limbs (lower dominant group, n = 7), and MRC grade 0–2 for both upper and lower limbs (whole weakness group, n = 21). One-way ANOVA revealed that all 4 groups significantly differed in DSPAU, K-MBI, K-BBS, and 10mWT both before and after rehabilitation. Both before and after treatment, DSPAU was the lowest in the whole dominant group, followed by lower dominant group, upper dominant group, and whole weakness group. Further, the functional test scores were the greatest in the whole dominant group, followed by the lower dominant group, the upper dominant group, and the whole weakness group. The results for the 10mWT speed were the same (p < 0.001, Table 5). With regard to the change in functional assessment, after rehabilitation, the amount of ΔDSPAU was the greatest in the whole weakness group, followed by the lower dominant group, the upper dominant group, and the whole dominant group. ΔK-MBI was the greatest in the upper dominant group, followed by the whole weakness group, the lower dominant group, and the whole dominant group. ΔK-BBS was the greatest in the upper dominant group, followed by the lower dominant group, the whole weakness group, and the whole dominant group. Finally, Δ10mWT speed was the greatest in the lower dominant group, followed by the whole dominant group, the upper dominant group, and the whole weakness group (Table 5).
Table 5
Comparison of the values and changes in the DSPAU and functional scale scores according to the MRC grade

Data are shown as mean ± standard deviation.
DSPAU, difference of sitting pressure between the affected and unaffected sides; K-BBS, Korean version of the Berg Balance Scale; 10mWT, 10-meter walk test; K-MBI, Korean version of the Modified Barthel Index; MRC, Medical Research Council scales.
*p < 0.05.
Correlations between DSPAU and K-MBI, K-BBS, and 10mWT
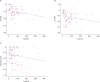
We analyzed the correlation between changes in DSPAU and changes in other measured functional assessments. The DSPAU was significantly correlated with the K-MBI, but there were no correlations between K-BBS and 10mWT walking speed. (Table 6 and Figure 3).
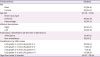
Table 6
Correlation between the changes of DSPAU and functional scale scores

| Functional measurements | Pearson R | p value* |
|---|---|---|
| K-MBI | −0.232 | 0.048 |
| K-BBS | −0.191 | 0.106 |
| 10mWT (m/s) | −0.147 | 0.214 |
Fig. 3
Scatter plots of the correlation between ΔDSPAU and (A) ΔK-MBI, (B) ΔK-BBS, (C) Δ10mWT (m/s).
DSPAU, difference of sitting pressure between the affected and unaffected sides; K-BBS, Korean version of the Berg Balance Scale; 10mWT, 10-meter walk test; K-MBI, Korean version of the Modified Barthel Index.
DISCUSSION
After rehabilitation, stroke patients with hemiplegia showed a reduction in DSPAU and an improvement in functional parameters. Further, asymmetry of sitting pressure was greater in the non-ambulatory group compared to the ambulatory group, and greatest in the whole weakness group, followed by the upper dominant group, the lower dominant group, and the whole dominant group. Improved functional parameters after rehabilitation was associated with decreased DSPAU, which indicates asymmetry of sitting pressure. Furthermore, DSPAU was significantly correlated with K-MBI.
Following a stroke, patients exhibit various sequelae, including motor weakness, posture imbalance, gait disturbance, unilateral neglect, cognitive impairment, dysphagia, and speech disturbance. In patients with hemiplegia, problems with trunk balance control, including sitting and standing balance, cause impairment of independent activities of daily living. Following a stroke, balance control has been reported to have a major effect on the activities of daily living upon discharge [3417]. Specifically, sitting balance control is related to the ability to perform activities of daily living, and acts as an important predictive factor for functional recovery in stroke patients [418]. In the acute treatment of stroke patients, it is important to establish appropriate goals and an effective treatment plan by early prediction of the extent of recovery of independent ambulation [19]. Thus, evaluating balance control ability in stroke patients is critical both to establishing a treatment plan and to preventing later complications and disability.
Various scales have been developed and are currently used to measure sitting balance in clinical practice. Kim et al. reported that there is no perfect clinical scale that is applicable in all patients with brain disease, and that each method has strengths and weaknesses [2]. In other words, several methods need to be used together in order to reduce the error when assessing a patient's function. This can lead to difficulties in the clinical interpretation of changes in balance control.
Previous studies have also attempted to find objective and quantitative methods of evaluating sitting balance control ability [9202122232425]. Cholewicki et al. [20] developed a method of evaluating balance control using a force plate, in which hemispheres of different diameters were placed on the force plate. Using this technique, the movement, distance, time, and speed of the center of pressure were measured while the subject sat on top of these hemispheres, thereby allowing researchers to determine trunk balance. In doing so, researchers demonstrated high reliability in healthy subjects. They also evaluated the postural control of the lumbar spine via the center of pressure during unstable sitting. Hwang et al. used a self-manufactured device to evaluate control of sitting balance in healthy individuals, and confirmed reliability in the assessment of various items [21]. In this study, a sitting balance test using a force platform was employed as an objective examination to quantify and visualize sitting balance control by measuring the center of pressure conveyed to the force platform while sitting. This method is used often in studies analyzing pressure [2627]. However, there have been no attempts to evaluate the change of sitting balance by DSPAU analysis, rather than by center of pressure analysis, after rehabilitation therapy in stroke patients. In our study, we measured the DSPAU using sitting pressure to identify sitting imbalance. We also compared changes in sitting pressures between groups, and analyzed correlations between the changes of sitting balance and other functional measurements.
After rehabilitation, K-MBI and K-BBS scores and 10mWT speed significantly increased, while DSPAU significantly decreased. Improvements in various functional assessment parameters after rehabilitation have been documented in the literature [28], and similar to these functional assessment parameters, DSPAU values also showed significant changes. In particular, DSPAU decreased, suggesting that patients' sitting balance improved after rehabilitation.
A review of the literature on stroke outcomes indicates that multiple factors are related to the prognosis of recovery, including brain lesion size and lesion location [2930313233]. Given that spatial integration is predominantly controlled by the right posterior parietal cortex [34], it is possible that the side of the cerebral lesion affects the recovery of balance control. Laufer et al. reported that the patient group with left hemisphere stroke included patients who were more likely to show improvements in balance control, as compared to the patient group with right hemisphere stroke [29]. However, Sackley [30] reported that there was no association between recovery of balance control and lesion of stroke. In our study, there were no significant differences in DSPAU, K-MBI, K-BBT, and 10mWT between the right and left hemiplegia groups both before and after rehabilitation. There were also no differences in the amount of changes (Δ) of DSPAU, K-MBI, K-BBT, and 10mWT after rehabilitation between the 2 groups.
With regard to the subgroups according to MRC grades for upper and lower limbs, DSPAU before and after rehabilitation was the greatest in the whole weakness group, followed by upper dominant group, lower dominant group, and whole dominant group. These results show that left and right asymmetry when seated increases when the MRC grade is lower, and when lower limbs are weaker, compared to the upper limbs. Similarly, K-MBI and K-BBS scores and 10mWT speed also follow the same order as DSPAU (above, Table 5). This is in line with previous findings that suggest that several functions, including sensory information and appropriate motor and cognitive function, are involved in balance, and that muscle strength is one of the important factors [13536]. Further, these results confirm that lower limbs have a greater impact than upper limbs on symmetrical sitting posture (Table 5). All 4 groups showed significant changes in each test parameter after rehabilitation, but the order of change differed for each parameter (Table 5). This is speculated to be due to the fact that K-MBI is more affected by upper limb muscles, while K-BBS and 10mWT are more affected by lower limb muscles, and the degree of recovery varies across patients.
This study found that DSPAU, sitting pressure measured force platform, decreased after rehabilitation, and that the change (Δ) in DSPAU was correlated with ΔK-MBI. These results support previous studies. Hsieh et al. reported that, in patients with stroke, sitting balance control in the acute phase could predict recovery from limitation of activities of daily living [4]. Sandin and Smith [37] reported a favorable outcome in the Barthel Index for patients who had good sitting balance in the acute phase after stroke, and in those who showed clear improvement in sitting balance after rehabilitation compared to those who did not. Furthermore, sitting balance control is related to performance of activities of daily living such as eating, grooming, dressing, and wheel chair transfer. Along with ambulation ability, it can act as an important predictive factor for functional recovery in stroke patients [3518]. With regard to post-treatment differences in ambulation, the non-ambulatory group showed a greater DSPAU and lower K-MBI and K-BBS both before and after treatment than that of the ambulatory group (Table 4). This may suggest that activities of daily living and standing balance may be hindered to a greater extent with a larger DSPAU, which is similar to previous findings. However, DSPAU was not significantly correlated with K-BBS or 10mWT. A lower correlation between K-BBS and 10mWT with DSPAU compared to K-MBI may be attributable to the fact that most K-BBS items are measured with the patient standing, and 10mWT is also performed based on standing balance.
This study has some limitations. First, we did not compare the pooled data by size and location of brain lesion in a subgroup analysis. Size and location of brain lesion can strongly affect stroke sequelae. Second, we did not investigate the changes that occurred following long-term treatment. Third, in evaluating trunk balance stability, because we only used the DSPAU in a static state, we were unable to sufficiently assess dynamic stability. Further studies will be required to assess overall trunk balance by evaluating both static and dynamic stability from various angles. Finally, the size of the comparison groups was relatively small. Future studies should use a larger number of patients, include long-term observations, and investigate the importance of recovery of sitting balance control ability in rehabilitation of stroke patients in the acute phase.
We observed that a decrease in DSPAU was associated with an improvement in functional parameters following rehabilitation. Though multiple factors are associated with the functional recovery in hemiplegic stroke patients, it is obvious that balance control, including sitting balance, is one of the key indices for predicting stroke recovery. Repeated measurements of sitting balance-using DSPAU be helpful to predict motor and functional recovery in stroke patient with hemiplegia.
 XML Download