

 PDF
PDF ePub
ePub Citation
 Print
Print


INTRODUCTION
The clinical and economic burden associated with diabetes mellitus and its management remain an enduring challenge to the healthcare community [12]. The primary clinical outcomes of type 2 diabetes mellitus (T2DM) include insulin resistance, abdominal obesity, and elevated glucose and triglyceride levels [3]. Metabolic organs including muscle, liver, and adipose tissue are involved in insulin resistance, of which the failure of muscle to response to insulin is thought to be a key pathophysiological factor in the development of T2DM [4]. These tissues have been shown to regulate glucose homeostasis via the secretion of various biologically and metabolically active polypeptide factors, providing an important conceptual framework to understand the pathophysiology of insulin resistance and T2DM.
Apolipoprotein J (ApoJ), also known as clusterin, is a disulfide-linked heterodimeric protein that is ubiquitously expressed in various tissues and bodily fluids [5]. An increase in the level of circulating ApoJ has been linked to various pathophysiologic conditions, including Alzheimer's disease, neoplastic conditions, and cardiovascular diseases [678]. Emerging data suggest that circulating ApoJ is closely correlated with markers of cardiovascular metabolism, suggesting a link between ApoJ and insulin resistance in human subjects [91011]. Previous work by our group demonstrated that changes in serum ApoJ levels by insulin-sensitizing therapy was inversely associated with changes in the glucose disposal rate in patients with T2DM, suggesting that circulating ApoJ is a marker of insulin resistance [12].
Exercise is recognized as a critical factor for T2DM prevention and treatment, providing significant improvements in insulin sensitivity and diabetes-related health complications with minimal undesired side effects [13]. Whereas aerobic exercise enhances insulin sensitivity, resistance training improves blood glucose uptake by increasing muscle mass and Glut4 expression, with synergistic effects possible between the two exercise types [14]. Based on these observations, current guidelines recommend that patients with T2DM should enroll in combined exercise programs to manage their glucose levels and insulin resistance [15]; however, details regarding the effects of combined exercise training on insulin resistance in diabetic individuals are limited [16].
Here, we examined the circulating ApoJ level and various cardiometabolic risk factors in postmenopausal patients with T2DM after introduction of combined aerobic exercise and resistance training for 12 weeks. The goal of this study was to assess the effects of combined aerobic and resistance training on the circulating ApoJ level and other cardiometabolic risk factors as potential markers of insulin resistance in postmenopausal women with T2DM.
METHODS
Participants
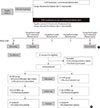
This study was approved by the Institutional Review Broad of Pusan National University Hospital (1306-004-019) and was performed in accordance with the Declaration of Helsinki. The current study was registered at the National Clinical Trial Registry (clinical trial no. KCT0004671; https://cris.nih.go.kr/cris/). Written informed consent was obtained from all subjects before enrollment in the study. To establish the effect of combined exercise on cardiometabolic parameters in T2DM, we enrolled postmenopausal women with T2DM from Pusan National University Hospital in Busan, Korea. The exclusion criteria were as follows: (1) active infection within the past month; (2) a recent history of acute myocardial infarction, stroke, trauma, or surgery; (3) neoplastic disorder; (4) occlusive peripheral vascular disease; (5) severe liver dysfunction; (6) taking antidepressants or neurotrophic drugs; and (7) Alzheimer's disease. We used power analysis to determine the sample size. Extrapolating for a medium size effect of 0.40, a minimum sample of 46 subjects was needed to achieve a power of 0.85 with an alpha level of 0.05. However, taking into account the possible 10% sample loss, a total of 50 patients were selected. A flowchart describing the selection of participants from the initial screening to the study endpoint is shown in Fig. 1. Of the initial 52 patients who were recruited, seven were excluded during the screening process, with the remaining 45 randomly assigned to either of the two groups. All participants were provided dietary consultation for diabetes by a clinical nutritionist (S.H.J.) 1 month before randomization. Then, they were randomly assigned to two groups, the exercise (EXE, n=30) and control (CON, n=15) groups at a ratio of 2:1. The participants in the EXE group performed combined aerobic exercise and resistance training, whereas those in the CON group performed no additional exercise during the 12-week period. Dietary consultation was provided to participants in both groups every month during the study period. At baseline, 4, 8, and 12 weeks, we measured body composition and metabolic parameters including homeostatic model assessment of insulin resistance (HOMA-IR) and the serum ApoJ level using enzyme-linked immunosorbent assay (ELISA).
Exercise protocol
The combined exercise program consisted of aerobic exercise and resistance training for 12 weeks. All exercise sessions were supervised by exercise physiologists and endocrinologists. Aerobic exercises entailed folk dances composed of rhythmic movements to music matching the emotions of older women. Exercise frequency was three times a week (Monday, Wednesday, and Friday) for a total of 12 weeks. Exercise duration was 20 minutes each day, including warm-up for 5 minutes and cool-down for 5 minutes. To enhance the aerobic effect and interest in the programs, exercise intensity was provided as rated perceived exertion (RPE) scale 11 to 12 (light) for weeks 1 to 4 and RPE scale 13 to 14 (somewhat hard) for weeks 5 to 12. Heart rate was measured using an X-trainer heart rate monitor (Polar Electro Oy, Kempele, Finland).
Resistance training involved performance of rubber band exercises three times each week. The exercise duration was approximately 30 minutes each day. The intensity was provided as RPE 11 to 12 (light) for weeks 1 to 4 and RPE 13 to 14 (somewhat hard) for weeks 5 to 12. Rubber band exercises consisted of nine movements to work the large and small muscle groups as described previously [17]: bench press, squat, elbow curl, seated row, knee curl, sit-up, knee extension, overhead press, and seated leg press. Each movement was performed at 70% of the maximal single-repetition resistance. Resistance was increased slowly if the participant could perform 20 repetitions without failure. To increase resistance within the recommended stretch distance of the rubber resistance equipment, participants increased the thickness of the rubber band being stretched. This was achieved using the range of different thicknesses of the resistance product.
Metabolic and anthropometric measurements
Body height and weight were measured using a digital electronic scale with participants wearing light clothing and no shoes. Waist circumference was measured horizontally at the level of the umbilicus. Body composition was measured using dual-energy X-ray absorptiometry (Lunar Prodigy; GE Medical Systems, Milwaukee, WI, USA). Blood samples were drawn at 8:00 AM after at least 12 hours of fasting from the antecubital vein of each participant. The blood samples were collected at baseline (0 week), 4, 8, and 12 weeks after randomization. Plasma samples were prepared within 30 minutes of collection by centrifugation for 15 minutes at 3,000 rpm; plasma was removed and stored at −70℃ until analysis. The plasma concentration of ApoJ was measured using a commercial ELISA kit (Boster Biological Technology, Pleasanton, CA, USA) according to the manufacture's protocols. Samples were diluted to enable analysis within the range of the standard curve (0.78 to 50 ng/mL). The sensitivity of the assay was <20 pg/mL. The intra- and inter-assay coefficients of variation were 4.2% to 4.6% and 6.9% to 7.5%, respectively. All samples were analyzed in duplicate. Serum glucose concentrations were measured within 4 hours of collection using Cobas (Roche Diagnostics, Mannheim, Germany). Serum insulin levels were measured by radioimmunoassay (Asbach Medical Products GmBH, Obrigheim, Germany). The intra- and inter-assay coefficients of variation were 2.1% and 6.5%, respectively. The HOMA-IR index was calculated using the formula: fasting plasma glucose (mmol/L)×fasting plasma insulin (mU/L)/22.5 [18].
Statistical analysis
Statistical analyses were performed using SPSS version 18.0 for Windows (SPSS Inc., Chicago, IL, USA). Data are presented as mean±standard deviation for normally distributed values and as median (interquartile range) for nonparametric values. Distributions of the continuous variables were examined for skewedness and kurtosis, and variables with a non-Gaussian distribution were logarithm-transformed prior to analysis. Geometric means are presented with 95% confidence intervals. The Mann-Whitney U test or independent Student's t-test was used to compare the baseline characteristics, as well as changes in the metabolic and anthropometric parameters and ApoJ levels, of the subjects between the between the CON and EXE groups after the 12-week period. Categorical variables are reported as frequencies and percentages and were compared using the chi-square test. Spearman's rank correlation analysis was used to assess the correlations between individual continuous variables. We used repeated-measures analysis of variance (ANOVA) on both time (baseline vs. post-exercise) and group (CON vs. EXE) factors to compare circulating ApoJ levels and other parameters at baseline, 4, 8, and 12 weeks after intervention. A P value of <0.05 derived from two-tailed Student's t-tests was considered statistically significant.
RESULTS
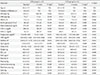
During the follow-up period, four subjects declined participation (EXE, n=3; CON, n=1). An additional four participants from the EXE group did not meet attendance criteria for the exercise program (≥80%). Thus, the final data analyses were based on 34 participants (EXE, n=20; CON, n=14) (Fig. 1B). The key characteristics of the subjects (n=34) utilized in the analyses, including anthropometric measures, metabolic parameters, and demographic features, are shown in Table 1. The mean age of the patients was 61.3±8.8 years. The mean duration of diabetes was 9.5±7.9 years, and the mean body mass index (BMI) was 24.9±2.8 kg/m2 . There were no significant differences in any metabolic or anthropometric parameter between the two groups at baseline (Table 1). At baseline, the median serum ApoJ level was 133.3±22.0 µg/mL and did not differ significantly between the two groups (135.6±22.9 µg/mL in EXE vs. 128.3±20.6 µg/mL in CON, P=0.299).
At week 12, body weight was significantly lower in the EXE than CON group (P=0.014 vs. at baseline in EXE; P=0.451 vs. at baseline in CON). After 12 weeks, total fat (%) and total fat mass (g) were decreased in both the CON and EXE groups (P=0.017 vs. P=0.040 and P=0.011 vs. P=0.017, respectively) relative to baseline. Weight-adjusted appendicular skeletal muscle mass (ASM/wt) was significantly increased in the EXE (P=0.005) but not the CON (P=0.820) group at 12 weeks relative to baseline. There was no significant change in glycosylated hemoglobin (HbA1c), android fat mass, or ASM between baseline and week 12 in either the EXE or CON group (P=0.278 vs. P=0.363, P=0.289 vs. P=0.865, P=0.170 vs. P=0.460, and P=0.434 vs. P=0.650, respectively). However, the level of high density lipoprotein (HDL)-cholesterol was greatly increased in the EXE (P=0.026), but not CON (P=0.573), group at week 12. The HOMA-IR value at the end of exercise was below that at baseline in the EXE, although this difference was not statistically significant (P=0.054). No significant difference was found in the HOMA-IR value between baseline and week 12 in the CON (P=0.617).
At baseline, the circulating ApoJ level in all patients was significantly correlated with the level of HDL-cholesterol (r=302, P=0.048) and ASM/wt (r=−0.332, P=0.019) (Supplementary Table 1). In contrast, the level of circulating ApoJ was positively correlated, albeit not significantly, with HbA1c (r=286, P=0.079) and HOMA-IR (r=297, P=0.067) at baseline.
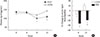
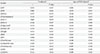
At weeks 8 and 12, the circulating ApoJ level was significantly lower in the EXE than CON (P=0.019 at week 8 and P=0.007 at week 12 by repeated-measures ANOVA) (Fig. 2A). In the EXE, the ApoJ level decreased 26.3% and 19.4% relative to baseline at weeks 8 and 12, respectively (Fig. 2B), and was significantly different between the two groups at weeks 8 and 12 (P<0.05 and P<0.001, respectively). Changes in the ApoJ level from baseline to the end of the 12-week period were not significantly correlated with changes in HbA1c, blood pressure, lipid profiles, body weight, or fat mass in all participants (Table 2). No relationship between the changes in body fat and ApoJ level was observed (r=0.212, P=0.214) (Fig. 3A); however, the decreased circulating ApoJ level after 12 weeks of combined exercise was significantly correlated with the changes in ASM/wt (r=−0.412, P=0.016) (Fig. 3B) and HOMA-IR (r=0.352, P=0.041) (Fig. 3C) in an unadjusted analysis (Table 2). After adjusting for age, the change in ApoJ level remained significantly associated with ASM/wt only (r=−0.408, P=0.024).
DISCUSSION
The data presented here show that exercise training resulted in significant improvements in insulin resistance-related outcomes, including increased ASM/wt, and these improvements were associated with a decreased circulating ApoJ level in postmenopausal women with T2DM. This study provides clear evidence supporting circulating ApoJ as a metabolic marker of insulin resistance, as well as the ability of a combined exercise to improve sarcopenic obesity in insulin-resistant individuals.
The circulating ApoJ level was significantly increased in individuals with conditions associated with insulin resistance such as obesity, metabolic syndrome, and T2DM [91219]. Following therapeutic intervention using a combination of weight reduction and thiazolidinedione to improve insulin sensitivity, circulating ApoJ levels were reduced [1220]. The data presented here build on those previous results, showing that a decrease in the circulating ApoJ level induced by physical exercise is accompanied by improvements in important insulin resistance indices, such as HOMA-IR, in T2DM. Together, these data support the notion that upregulation of circulating ApoJ is a feature of metabolically dysregulated states in insulin resistance conditions, including T2DM. Further support for this hypothesis comes from the finding that oral administration of ApoJ reduced atherosclerosis in ApoE-null mice and improved HDL inflammatory properties in monkeys [21]. In line with these findings, ApoJ was shown to play a protective role in individuals with insulin resistance, and an elevated serum ApoJ level may be the manifestation of adaptive or secondary effects, suggesting that circulating ApoJ is a useful maker for evaluating insulin resistance.
Sarcopenic obesity, defined as a loss of muscle mass and muscle strength, is prevalent among older diabetic patients and is closely related to insulin resistance [2223]. Of note, the current study found that the reduced circulating ApoJ level after exercise was correlated with an increase in skeletal muscle mass, although it remains uncertain whether exercise or the change in muscle mass itself was responsible for the change in the serum ApoJ level. Whereas no significant change in the serum ApoJ level was observed in subjects without changes in muscle mass in the EXE (data not shown), definitive conclusions are not possible due to the small number of subjects in the study and the strong correlation between muscle mass and the reduction in circulating ApoJ. Recent work from our lab demonstrated that muscle-specific deletion of low density lipoprotein (LDL) receptor-related protein 2, a potential receptor for ApoJ, resulted in an increased serum ApoJ level and insulin resistance in mice (not published). However, the mechanism by which acute endurance exercise affects the metabolic actions of ApoJ on muscle metabolism is unclear. Future study is needed to clarify this important issue.
A prior study found that the ApoJ level was not correlated with either BMI or the degree of weight loss, although weight loss lowered circulating ApoJ concentrations in obese patients [20]. These results are consistent with the data presented here showing that the circulating ApoJ level was not correlated with either body weight or fat mass. However, when we reclassified patients as those with and those without body weight change after exercise, ApoJ levels were significantly decreased only in the body weight change group (Supplementary Fig. 1). These data suggest that both an increase in skeletal muscle mass and a decrease in adiposity can affect the level of circulating ApoJ. Thus, we are able to explain why changes in the serum ApoJ level were not correlated with changes in ASM but were correlated with changes in ASM/wt.
Emerging evidence suggests that the circulating ApoJ level is independently correlated with insulin sensitivity in both healthy subjects and diabetic patients [1112]. However, we observed only marginal correlations between several insulin sensitivity indices and the circulating ApoJ level at baseline. In addition, there was a weak correlation between changes in insulin resistance and the circulating ApoJ level with physical exercise training, although this association did not reach statistically significance. These results are concordant with our previous data showing that circulating ApoJ was clearly correlated with metabolic parameters of insulin resistance in healthy subjects but not in those with T2DM [12]. This discrepancy could be explained by several possibilities. First, the diabetic patients in the current study had a relatively long duration of diabetes (approximately 10 years) and insulin deficiency due to β-cell failure. Second, because we did not exclude patients who were using insulin at enrollment, it is possible that insulin supplementation could have affected the serum ApoJ level during the course of exercise training. Third, many of the subjects enrolled in this study were taking a variety of prescriptions that potentially could have affected insulin sensitivity during the study period (Supplementary Table 2). However, there was no significant difference in the proportion of prescriptions affecting insulin sensitivity between the groups and no changes reported during the study period. Last, HOMA-IR might be not a reliable method for estimating insulin resistance, particularly in patients with advanced T2DM.
Rather, this variable is likely appropriate for epidemiologic studies involving a larger number of subjects [24]. The glucose clamp technique may be a more suitable method for assessing insulin sensitivity in skeletal muscle [25].
Several studies have reported that circulating ApoJ is significantly correlated with total cholesterol and LDL-cholesterol levels [102627]; however, there was no discernible evidence of a close relationship between changes in the ApoJ level and lipid profiles after combined exercise. One possible explanation for this could be that most participants had already taken cholesterol-lowering statins (Supplementary Table 2).
The limitations of the current study include the relatively small number of participants and the narrow spectrum of the population stemming from our selective use of Korean postmenopausal women with T2DM. We cannot exclude the possibility that circulating ApoJ levels induced by exercise training vary among different populations of obese patients with T2DM in Western countries. As this study was performed only in postmenopausal women, these findings cannot be generalized to either men or premenopausal women. Second, the 12-week intervention period may have been too brief to accurately determine the effects of exercise on ApoJ level and insulin sensitivity. Finally, changes in the serum ApoJ level were not correlated with changes in ASM but rather with changes in ASM/wt. Further studies examining a larger cohort of patients will be needed to clarify this discrepancy.
Taken together, the data presented here provide the first evidence demonstrating the regulation of circulating ApoJ in response to physical exercise in humans with T2DM. Interestingly, the circulating ApoJ level was markedly decreased by exercise training, and the change in the ApoJ level was inversely correlated with the change in muscle mass in patients with T2DM, along with an improvement in insulin sensitivity. Thus, circulating ApoJ could be a useful metabolic marker of the insulin-sensitizing effect of physical exercise in patients with T2DM.

 XML Download