

 PDF
PDF ePub
ePub Citation
 Print
Print


INTRODUCTION
Implant treatment has become an indispensable method in the treatment of edentulous areas. Implant surgery allows the patient to regain function and aesthetics through successful osseointegration [1]. A major factor affecting osseointegration is the bone structure in which the implant is placed. Therefore, it is important to evaluate the bone structure 3-dimensionally. Bone perforation and damage to critical structures may occur during implant placement [2], potentially resulting in inflammation, infection, and loss of the implant [3]. For the surgeon, it is difficult and time-consuming to control the ridge angle during implant placement. Although various anatomical regions can be analyzed using specific methods, such as the use of osteometry and diagnostic casts to assess the alveolar ridge, these techniques are not very effective at certain sites of the posterior mandible because the myeloid muscle prevents proper evaluation of this area [1].
Bone perforations mainly occur in the posterior region, which contains the inferior alveolar nerve and the submandibular fossa (lingual concavity). The posterior region is a high-risk site during implant placement due to risk of injuring the neurovascular bundle and perforating the lingual cortex. Perforation of the lingual cortex can cause both implant failure and arterial trauma with hematoma [4]. Therefore, the morphology, size, and characteristics of the submandibular fossa and the correct location of the mandibular canal are data that should be obtained as part of the preoperative evaluation.
Periapical and panoramic radiographs can be used to evaluate edentulous regions in the posterior mandible. However, these are inadequate in displaying the relevant anatomy, especially along the buccolingual or horizontal dimensions (i.e., for visualizing thickness). The American Academy of Oral and Maxillofacial Radiology reported that cross-sectional images provide optimal accuracy for visualizing the bony structure of the jaws [5]. Cone-beam computed tomography (CBCT) and computed tomography (CT) are the best methods for evaluating patients for dental implants, although they are often used in more complex cases and are not required for every patient [6]. However, CBCT has advantages over CT, including high-level resolution, lower doses of radiation, and lower costs [78]. Therefore, the use of CBCT in dental clinics is continuing to increase.
In this context, it is important to obtain detailed information regarding the presence of a lingual concavity in the posterior mandibular region. The aim of this article was to determine the morphological features and prevalence of lingual concavities in edentulous first molar regions using cross-sectional CBCT images of the mandible.
MATERIALS AND METHODS
This cross-sectional and retrospective study included 163 patients between 18 and 68 years of age who were admitted to our oral and maxillofacial radiology clinic between 2016 and 2017 and underwent CBCT for diagnosis and treatment. This study was approved by the local research ethics committee and complied with the guidelines laid out in the Declaration of Helsinki.
The original sample size of 163 subjects was determined using ClinCalc (ClinCalc LLC, Indianapolis, IN, USA) based on the assumption of a 2.7±0.92 mm measurement for the lingual concavity depth based on a previous study [1], with 90% power and a 2-sided alpha of 0.05. The estimated sample size was 129 subjects.
All images were acquired from a CBCT machine (Morita 3D Accuitomo 170, J Morita MFG Corp., Kyoto, Japan) at the Department of Oral and Maxillofacial Radiology, University of Necmettin Erbakan Faculty of Dentistry by board-certified oral and maxillofacial radiologists. Imaging parameters were set at a peak kilovoltage of 90 kVp and a current of 5 mA, with a rotation time of 17.5 seconds. The voxel size and the field of view varied depending on the arch. The occlusal and Frankfurt planes of each patient were positioned parallel to the ground according to the device's instructions. The CBCT images were saved as TIFF files without disclosure of patients' names or personal information. The radiological evaluations were performed by a dentomaxillofacial radiologist with 9 years of experience. A list of codes and corresponding names was created to protect the confidentiality of the patients.
All images used in the study were taken from the patient database of the clinic, and no specific CBCT images were taken for this article. CBCT scans were excluded if they showed poor-quality images, congenital and/or developmental disorders, abnormal morphology due to trauma, and/or pathological conditions potentially affecting the site of interest. The site of interest was the edentulous mandibular first molar area. The study included images with a sufficient vertical bone height and horizontal bone width (≥3.5 mm) to accommodate a 10-mm implant with at least 1 mandibular first molar tooth missing and with adjacent second premolar teeth [910].
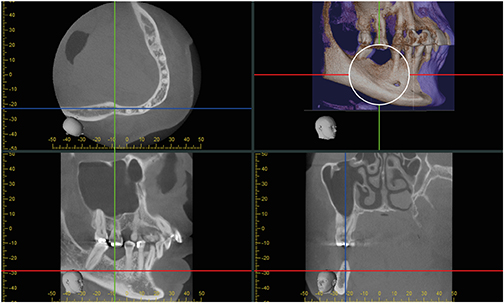
All observations were made by an observer (the dentomaxillofacial radiologist mentioned previously) using the CBCT machine software program (i-Dixel, Morita, Kyoto, Japan). The region of interest contained the mandibular occlusal plane and the lower limit of the mandible. If the second molar tooth was present, a cross-sectional view was taken from the middle of the edentulous region between the second premolar and second molar teeth. If the second molar was not present, a cross-sectional view was selected at a distance of 5 mm from the cemento-enamel junction of the second premolar (Figure 1).
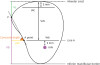
Figure 2 summarizes the various measurements taken in the edentulous region. First, in the selected cross-sectional view, the inferior alveolar nerve was identified, and the region above the 2-mm horizontal line (line A) coronal to the upper limit of the inferior alveolar nerve was evaluated. The intersection between line A and the lingual plate was called point A. The buccolingual widths at 2 mm apical to the alveolar crest (Wc) and at the level of line A (Wb) were measured. The vertical distance from the alveolar ridge to line A (Vcb) was also measured [11]. All measurements were measured in millimeters with a digital ruler using the same software program as previously mentioned (i-Dixel).
Figure 2
Schematic illustration of measurements taken from a cross-sectional slice [11].
Wc: buccolingual widths at 2 mm apical to the alveolar crest, Wb: buccolingual widths at the level of line A, Vcb: vertical distance from the alveolar ridge to line A, LCD: linear concavity depth, Vc: vertical distances between point P and the alveolar crest, Vb: vertical distances between point P and the inferior mandibular border.
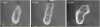
The shapes of the mandibles were classified into 3 types (types U, C, or P) using the cross-sectional images of the edentulous region (Figure 3). Type U has a narrow alveolar crest and a broad buccolingual base (marked as the P point, Figure 2). If there was no obvious lingual undercut, the ridges were classified as type C if they were convergent or as type P if they were parallel. On a type C ridge, the base of the ridge is wider than the crest. In contrast, a type P ridge generally has a ridge shape that is more or less parallel [11]. Accordingly, the prevalence of each ridge pattern was calculated.
Figure 3
Cross-sectional views of the first molar region, showing the 3 types.
C: convex, P: parallel, U: undercut.
The morphological measurements of lingual concavity on a type U ridge are shown in Figure 2. The line connecting point A to point P was named line B. The vertical distances between point P and the alveolar crest (Vc) and between point P and the inferior mandibular border (Vb) were also measured. The linear concavity depth (LCD) was calculated as the horizontal distance between Vb and point A, parallel to the inferior mandibular border. The angle of concavity was determined as the angle between line B and the line determining the depth of the concavity. The greater the concavity, the smaller the angle and the greater the depth [11].
The measurements were repeated with 50 randomly selected patients at a 1-month interval to promote intra-examiner reliability. Descriptive statistics were obtained for all parameters using a statistical package (SPSS ver. 21, SPSS Inc., Chicago, IL, USA). The Kolmogorov-Smirnov, chi-square, Mann-Whitney U, Kruskal-Wallis, and Spearman correlation tests were used. A P-value of less than 0.05 was considered to indicate statistical significance.
RESULTS
A total of 163 subjects were included, consisting of 83 men and 80 women with a mean age of 41.36 years (range, 18–68 years) and 39.38 years (range, 19–63 years), respectively. Only 15 subjects had a bilateral mandibular first molar region. Therefore, only 1 region of each subject was randomly selected. The intraclass correlation coefficient values for all variables showed high intra-examiner reliability (range, 0.91–0.99).
The mandibular size measurements are summarized in Table 1. The mean Wc measurement was 7.92±2.24 mm in women and 7.28±2.14 mm in men. The mean Wb measurement was 10.90±1.96 mm in men and 10.62±1.80 mm in women. The mean Vcb measurement was 14.87±2.72 mm in men and 13.36±2.72 mm in women.
Table 1
Measurements of mandibular dimension and lingual concavity
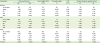
P-values indicate whether the measurements differ by sex.
Wc: buccolingual widths at 2 mm apical to the alveolar crest, Wb: buccolingual widths at the level of line A, Vcb: vertical distance from the alveolar ridge to line A, LCD: linear concavity depth, Vc: vertical distances between point P and the alveolar crest, Vb: vertical distances between point P and the inferior mandibular border, SD: standard deviation, Min: minimum, Max: maximum.
a)P<0.05.
Type P ridges were the most common, accounting for 37.4% of subjects. The second most common type was the parallel group (type U), comprising 32.5% of subjects, while type C ridges were only present in 30.1% of subjects. No significant differences were found in ridge type with regard to sex (P>0.05) (Figure 4).
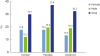
The mean concavity angle was 62.59°±7.13° in men and 64.39°±9.71° in women, and the mean LCD was 3.27±0.97 mm in men and 2.69±0.93 mm in women. The mean Vc and Vb measurements were 9.59±3.8 mm and 16.55±2.46 mm in men and 9.09±2.78 mm and 15.84±2.41 mm in women, respectively. These were the only 2 measurements that were significantly different according to sex (P<0.05). The men in the study had a longer Vcb and a wider LCD than the women (Figure 5). Negative correlations were found between age and Wc, between age and Vcb, between age and Vc, and between age and LCD (P<0.05) (Table 2).
Figure 5
Measurements according to sex.
Vcb: vertical distance from the alveolar ridge to line A, Wc: buccolingual widths at 2 mm apical to the alveolar crest, Wb: buccolingual widths at the level of line A, LCD: linear concavity depth, Vc: vertical distances between point P and the alveolar crest, Vb: vertical distances between point P and the inferior mandibular border.
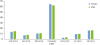
Table 2
Correlations between age and the morphometric measurements of mandibular dimension and lingual concavity

Sigma values indicate whether the measurements were correlated with age.
Wc: buccolingual widths at 2 mm apical to the alveolar crest, Wb: buccolingual widths at the level of line A, Vcb: vertical distance from the alveolar ridge to line A, LCD: linear concavity depth, Vc: vertical distances between point P and the alveolar crest, Vb: vertical distances between point P and the inferior mandibular border.
a)P<0.05; b)P<0.01.
DISCUSSION
Detailed examination of the anatomy of the bone tissue in which am implant will be placed enables the surgeon to restore the lost form, function, health, and aesthetics of the area. During implant placement, nerve damage and/or life-threatening bleeding may occur as a result of perforating the lingual cortical bone in the premolar-molar region [12131415]. The sources of hemorrhage in this region are the submental artery and the mylohyoid artery. The submental artery extends to the anterior of the myeloid muscle at the level of the submandibular gland and remains below the mandibular body. The mylohyoid artery maintains the blood supply of the mylohyoid muscle. Therefore, perforation of the lingual cortex of the mandible can cause injury to these arteries [1516].
Dental implants are becoming more common. From this point of view, correct radiographical evaluations are very important in order to prevent complications and to increase the success rate and patient satisfaction. Bone size and the location of the anatomical structures in which an implant is to be placed can be evaluated with 2-dimensional radiographs, such as panoramic or periapical radiographs. However, performing a cross-sectional examination of the anatomical location in which the implant is to be placed is also very important [17], as doing so allows the angle, width, and height of the implant to be determined more accurately. In a study conducted in 2011, during the placement of a 4-mm diameter implant, the rate of perforation of the lingual cortex was reported to be 7% in second premolars, 9% in first molars, and 31% in second molars [18]. As a result, a 3-dimensional imaging method, such as CBCT, is thought to be necessary to improve the diagnosis and to plan implant placement, especially in long-term edentulous patients [17]. Therefore, in this study, we chose to utilize CBCT.
In our study, the mean Wc, Wb, and Vcb values were 7.60±2.14 mm, 10.76±1.88 mm, and 14.13±2.96 mm, respectively. These results are similar to those found in studies conducted by Chan et al. [11] and Herranz-Aparicio et al. [19]. In the present study, the mean concavity angle was 63.34°±8.26°, the mean LCD was 3.03±0.99 mm, the mean Vc was 9.39±3.39 mm, and the mean Vb was 16.25±2.44 mm. Nickenig et al. [20] emphasized that lingual cortex perforation and complication rates were high in cases where the LCD was more than 2 mm. Kamburoglu et al. [21] stated that the mean right and left submandibular concavity depths were 2.26 mm and 2.24 mm, respectively. Their result is slightly lower than the measurements that we obtained. However, Quirynen et al. [22] reported a higher result than ours (approximately 6 mm). These differences may result from having evaluated different reference points, the ethnic origin of the subjects, and the sample size.
Various classifications of lingual ridge types have been proposed in the literature. While Chan et al. [11] classified the ridge types as P, C, and U (lingual concavity), Aranha Watanabe et al. [23] classified the types as A (lingual concavity), B, and C. In our study, type P ridges were the most common (37.4%), followed by type U ridges (32.5%) and type C ridges (30.1%), which are lower than the frequencies of those 2 types reported in other studies. In the literature, the reported prevalence of type U ridges ranges from 36% to 66% [1117202223242526]. Lingual concavity is a risk factor for lingual perforation [21]. The likelihood of a concavity increases in more posterior regions. Nickenig et al. [20] reported that the prevalence of lingual concavity was higher in the second molar area. In this study, we evaluated the prevalence of lingual concavities in edentulous first molar regions. Therefore, the differences between the measurements may result from the evaluation of different regions. Furthermore, the discrepancies in observations may be attributed to the different classifications used or to variation in the ethnic origin of the population studied [19]. A limitation of this study is that it had a retrospective design and focused on radiological images; therefore, the duration of edentulism was not assessed, even though it may be a factor affecting ridge type [17]. In future studies, in addition to performing radiological analyses, we recommend conducting prospective studies that take the duration of edentulism into account.
In this study, no significant differences were found in Wc, Wb, Vc, Vb, LCD, and ridge type between the sexes. However, men were found to have a longer Vcb and a wider LCD than women (P<0.05). Strikingly different results exist in the literature regarding these measurements. Salemi et al. [27] stated that the Vcb measurement was statistically significantly different according to sex, as seen in our results. However, in their study (contrary to our results), it was reported that LCD depth did not differ significantly according to sex. Chan et al. [11] found that there was no significant difference between the sexes in terms of Wb values, whereas men had a wider Wc. In a study conducted by Herranz-Aparicio et al. [19] in 2016, the Wc, Vcb, LC angle, and LC depth were not significantly different according to sex; however, the Wb was reported to be wider in men than in women. In a study conducted in the same ethnic population as our study [28], it was emphasized that women had deeper concavities, in contrast with the results of our study. Their sample size was 300 patients between 15 and 80 years of age. Furthermore, in their study, the deepest point between the mental foramen and the third molar was used to evaluate the lingual concavities. In our study, the presence of lingual concavities was evaluated only in the first molar region. The variation among the other results may be due to differences in the methodology, sample size, age range, and period of edentulism. Therefore, it is difficult to compare our results with the measurements obtained from other studies.
In our study, negative correlations were found between age and Wc, between age and Vcb, between age and Vc, and between age and LCD (Table 2), similar to the results obtained by Panjnous et al. [2]. These age-related findings may be due to a decrease in the P point as a result of increased resorption with age. The decrease in the values of Wc, Vcb, and Vc supports this explanation. Uchida et al. [29] suggested that edentulism may cause a decrease in the depth of the depression by changing the volume of the alveolar bone. Herranz-Aparicio et al. [19] reported that only Wc measurements had a negative correlation with age. However, these results are inconsistent with those reported by Parnia et al. [25], who found no relationships between lingual concavity parameters and age. These differences can be attributed to variations in the measurement methods used.
In conclusion, within the limitations of this study, the prevalence of lingual concavity was found to be 32.5%. Age and sex had statistically significant effects on lingual morphology. As age increases, the depth of concavities and related parameters decrease. Men were found to have wider and deeper concavities. The anatomical location and grade of the lingual concavities presented in this article provide important information for the planning of implant treatment in the edentulous mandibular first molar regions. Future research should focus on identifying factors that may predict the degree of lingual concavity and the risk of posterior lingual plate perforation. This retrospective radiographical study can be used as a model for future prospective studies that examine lingual concavities in a larger population, ideally controlling for the length of time of edentulism and the method of extraction.
 XML Download