

 PDF
PDF ePub
ePub Citation
 Print
Print


INTRODUCTION
In guided bone regeneration (GBR) procedures, application of a membrane increases the predictability of bone regeneration by preventing the unwanted ingrowth of epithelial cells in the early stage of healing and increasing the stability of graft materials to form a space for the migration of desired osteogenic cells [12]. Various resorbable and non-resorbable membranes have been developed for GBR. Collagen membranes have been widely used because of their biocompatibility, the lower risk of membrane exposure (which is usually associated with infection), and the fact that they do not require a second operation for membrane removal. However, the rapid degradation of natural collagen membranes is a limitation that hinders successful GBR procedures [34].
To prevent the premature degradation of natural collagen, crosslinked collagen matrices have been introduced [5678]. Various chemical agents, such as glutaraldehyde and carbodiimide, are widely used to promote crosslinking between collagen molecules. Chemically-crosslinked collagen membranes have shown improved mechanical properties and slower biodegradation in previous studies [910]. However, the use of glutaraldehyde for crosslinking decreased membrane biocompatibility due to its cytotoxicity as a chemical agent [1112]. When used for crosslinking, carbodiimide bonds to free functional groups in amino acids, which decreases the bioactivity and biocompatibility of the collagen membrane [13]. To overcome these limitations of chemical agents used for crosslinking, a novel type of biphasic calcium phosphate (BCP)-supplemented ultraviolet (UV)-crosslinked collagen membrane has been introduced.
UV crosslinking utilizes the aromatic rings of aromatic amino acids (tyrosine, tryptophan, and phenylalanine). Conjugated aromatic rings interact with each other when their energy level is increased by UV light absorption. These elevated energy levels result in the production of radicals that generate crosslinking between collagen molecules. In a previous in vitro study, UV crosslinking of a collagen membrane made it resistant to degradation, with favorable mechanical properties and maintained biological functionality [13].
Furthermore, the addition of calcium phosphate particles such as BCP to collagen membranes is a modification that increases the stability and osteoconductivity of collagen membranes. BCP, which is a mixture of hydroxyapatite (HA) and β-tricalcium phosphate (β-TCP), is known to exhibit osteoconductivity, thereby promoting bone regeneration [14]. In addition to osteoconductivity, the addition of calcium phosphate into a collagen matrix was found to result in improved mechanical properties and enzymatic stability of the collagen membrane [15].
In this study, UV crosslinking and the addition of BCP particles were applied to collagen membranes to increase their resistance to degradation and to enhance their osteoconductivity, which results in successful bone regeneration. The aim of the present study was to investigate the efficacy and biocompatibility of the novel type of BCP-supplemented UV-crosslinked collagen membrane for GBR in a rabbit calvarial defect model.
MATERIALS AND METHODS
Materials
Particle-type BCP (Ovis Bone, Dentis, Daegu, Korea) was used as the graft material in this study. The BCP particles were composed of a 20:80 weight ratio of HA and β-TCP and consisted of 0.5- to 1.0-mm particles, with a macroporosity of 100–200 μm and a microporosity of 10–20 μm.
A BCP-supplemented UV-crosslinked collagen membrane (Ovis Membrane, Dentis) was used in this study. The composition of BCP was the same as that of the particle-type BCP, but the size of the BCP particles in the membrane was dramatically smaller than that of normal particle-type BCP. Filtered 7- to 10-μm BCP particles were dispersed into pure type 1 atelocollagen derived from porcine skin at a 1:1 weight ratio of BCP and collagen. Then, the atelocollagen with dispersed BCP was crosslinked by UV radiation and dry-frozen to form the membrane structure.
Animals
Ten male New Zealand White rabbits (body weight, 3±0.2 kg) were used in this experiment. All rabbits were housed in different cages with standard laboratory conditions and diet. The housing protocol followed the Association for Assessment and Accreditation of Laboratory Animal Care International (AAALAC) guidelines, and the housing facilities were accredited by the AAALAC. All the procedures—from animal selection, care, and preparation to anesthesia and surgical steps—followed a protocol approved by the Institutional Animal Care and Use Committee (Yonsei Medical Center, Seoul, Korea; approval number 2017-0117).
Study design
Four circular bone defects with a diameter of 8 mm were created in the calvarium of 10 rabbits. Each calvarial defect was randomly allocated to one of the following groups: 1) the sham control group, in which the defects underwent spontaneous healing; 2) the M group, in which the defects were covered with a BCP-supplemented UV-crosslinked collagen membrane without graft material; 3) the BG group, in which the defects were filled with BCP particles without membrane coverage; and 4) the BG+M group, in which the defects were filled with BCP particles and covered with a BCP-supplemented UV-crosslinked collagen membrane in a conventional GBR procedure (Figure 1). At 2 and 8 weeks, rabbits were sacrificed, and the experimental defects were investigated histologically and by micro-computed tomography (micro-CT).
 | Figure 1Experimental design in the rabbit calvarium. (A) Four circular defects 8 mm in diameter were prepared using a trephine bur. (B) Each defect was randomly assigned to an experimental group. Clockwise from top left; M, sham control, BG, and BG+M.BCP: biphasic calcium phosphate, UV: ultraviolet, M: group of defects covered with an a BCP-supplemented UV-crosslinked collagen membrane without graft material, BG: group of defects filled with BCP particles without membrane coverage, BG+M: group of defects filled with BCP particles and covered with a UV-crosslinked collagen membrane with added BCP in a conventional guided bone regeneration procedure.
|
Surgical procedure
The surgical procedures were performed based on those described in previously published studies [1617]. General anesthesia was administered with isoflurane (2%–2.5%) inhalation and an intravenous injection of alfaxan (5 mg/kg). The surgical site was disinfected with povidone-iodine and local anesthesia was administered through an injection of 2% lidocaine with 1:100,000 epinephrine. After making an incision along the midline of the cranium, a full-thickness flap was elevated and the calvarium was exposed. Four round defects measuring 8 mm in diameter were created with a trephine bur, without damaging the underlying dura mater or cerebral tissue, under copious saline irrigation. The defects on the calvarium were randomly assigned to the control group, M group, BG group, or BG+M group. Each allocated defect was filled according to the study design. After material placement, the flaps were carefully closed and sutured with absorbable 4-0 suture material (Vicryl, Ethicon, Somerville, NJ, USA). General antibiotic therapy (enfloxacin; 10 mg/day) was given for 5 days after the operation.
Evaluation method
Clinical observations
The surgical sites were observed on a daily basis for inflammatory signs and unexpected complications until the rabbits were sacrificed at 2 and 8 weeks after surgery.
Micro-CT analysis
The calvarial defect specimens were fixed with 10% formalin for 10 days and then scanned with micro-CT (SkyScan 1173, Bruker-CT, Kontich, Belgium) at a pixel size of 13.48 μm (130 kV, 60 μA). The scanned datasets were processed in the Digital Imaging and Communications in Medicine format, and reconstructed with 3-dimensional reconstruction software (NRecon reconstruction program [Ver 1.7.0.4], Bruker-CT).
The lateral borders of the region of interest (ROI) for volume measurements were defined by the lateral defect cuts made by the trephine bur. The superior border was defined by the soft tissue covering the defect. The inferior border was defined by the dura mater. Radiopaque areas were distinguished from augmented areas using 8-bit threshold grayscale values with a pixel size of 13.48 μm. Grayscale values from 55 to 255 were considered to indicate all mineralized tissue in the defects, while values of 55 to 97 indicated newly-formed bone and values of 97 to 255 indicated BCP particles. Areas with grayscale values lower than 55 were considered to be fibrovascular connective tissue. Within the ROI, the following volumes were measured using the software.
- Total augmented volume (TAV; mm3): Total augmented volume of the ROI, including mineralized tissue, graft material, and fibrovascular connective tissue in the defect.
- New bone volume (NBV; mm3): Sum of volumetric measurements of newly-formed bone in the defect.
- Residual material volume (RMV; mm3): Sum of volumetric measurements of the remaining BCP in the defect.
Histologic and histometric analysis
After sacrifice, specimens were fixed in 10% formalin for 10 days. Before decalcification, micro-CT was performed for each calvarial specimen. The specimens were decalcified in 5% formic acid for 14 days and then embedded in paraffin. Next, 5-μm-thick sections were cut along the middle of each round defect. Hematoxylin-eosin and Masson trichrome were used sequentially to stain the sections. First, the histologic slides were examined using a light microscope (DM LB, Leica Microsystems, Wetzlar, Germany) equipped with a camera (DC300F, Leica Microsystems). After microscopic observation of the entirety of the slides, including various tissues, slide images were digitally captured. After digitalization, a computer-aided slide image analysis program (Case Viewer 2.2; 3DHISTECH ltd., Budapest, Hungary) was used to conduct a histometric analysis of the slides. The lateral margins of the ROI were defined by the lateral defect cuts made by the trephine bur. The superior border of the ROI was defined by the periosteum or the lower border of the observable collagen membrane. The inferior border of the ROI was defined by the dura mater. Within the ROI, the following parameters were measured.
Statistical analysis
SPSS version 23 (IBM Corp., Armonk, NY, USA) was used to perform the statistical analysis. Volume measurements from micro-CT and the measurements from histology were summarized as mean values and standard deviations. The Kruskal-Wallis test and Mann-Whitney U test were applied to analyze the statistical significance of differences among the experimental groups at each time period and within groups at different healing times. P values <0.05 were considered to indicate statistical significance.
RESULTS
Clinical observations
Post-surgical healing was uneventful, with no unwanted complications or inflammatory signs in any of the rabbits, and the surgical wounds all fully healed without wound exposure. After sacrifice, normal periosteum and dura mater were observed in all specimens.
Micro-CT analysis
The results of the micro-CT analysis are summarized in Table 1. All 8-week groups showed a significant increase in NBV compared to each of the corresponding 2-week groups. The control and M groups at 8 weeks showed an increase in TAV compared to the corresponding groups at 2 weeks. However, there was no significant difference in TAV in the BG and BG+M groups between 2 and 8 weeks.
Table 1
TAV, NBV, and RMV measured by micro-CT grayscale values
Values are presented as mean±standard deviation (mm3).
TAV: total augmented volume, NBV: new bone volume, RMV: residual material volume, BCP: biphasic calcium phosphate, UV: ultraviolet, M: group of defects covered with an BCP-supplemented UV-crosslinked collagen membrane without graft material, BG: group of defects filled with BCP particles without membrane coverage, BG+M: group of defects filled with BCP particles and covered with a BCP-supplemented UV-crosslinked collagen membrane in a conventional guided bone regeneration procedure.
a)Statistically significant difference compared to the control group; b)Statistically significant difference compared to the corresponding group at 2 weeks; c)Statistically significant difference compared to the BG group.
![]()
At both 2 and 8 weeks, significantly higher NBV was found in the BG group (2 weeks: 25.78±7.52 mm3, 8 weeks: 38.71±2.24 mm3) and the BG+M group (2 weeks: 30.44±7.63 mm3, 8 weeks: 48.39±5.47 mm3) than in the control group (2 weeks: 4.96±5.20 mm3, 8 weeks: 27.50±7.22 mm3). At 8 weeks, the NBV of the BG+M group (48.39±5.47 mm3) showed a significant difference compared to the BG group (38.71±2.24 mm3, P=0.032) (Figure 2). Likewise, TAV was significantly larger in the BG and BG+M groups than in the M and control groups. No significant difference in RMV was found in any group.
 | Figure 2In micro-CT images taken at 8 weeks, the new bone volume of the BG+M group (48.39±5.47 mm3) showed a significant difference compared to the BG group (38.71±2.24 mm3).CT: computed tomography, BCP: biphasic calcium phosphate, UV: ultraviolet, M: group of defects covered with an a BCP-supplemented UV-crosslinked collagen membrane without graft material, BG: group of defects filled with BCP particles without membrane coverage, BG+M: group of defects filled with BCP particles and covered with a BCP-supplemented UV-crosslinked collagen membrane in a conventional guided bone regeneration procedure.
a)P=0.032.
|
At 2 weeks, all of the BCP particles in the BG+M group were enclosed by the remaining membrane, while a specimen from the BG group showed scattering of grafted BCP outside of the wound. At 8 weeks, 3 specimens from the BG group showed scattering of grafted BCP outside of the wound, while the shape and augmentation of grafted material in the BG+M group remained intact at both 2 and 8 weeks (Figures 3 and 4).
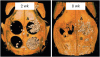
 | Figure 3Micro-CT views of the defects after 2 week, and 8 weeks of healing. At 2 weeks in the control and M groups, the defects were rarely filled, and even at 8 weeks, the defects were partially filled with a thin new bone bridge. Compared to natural bone, the newly-formed bone can be observed as a grayish area, and the BCP particles are observed as a more whitish area.CT: computed tomography, BCP: biphasic calcium phosphate, UV: ultraviolet, M: group of defects covered with an a BCP-supplemented UV-crosslinked collagen membrane without graft material, BG: group of defects filled with BCP particles without membrane coverage, BG+M: group of defects filled with BCP particles and covered with a UV-crosslinked collagen membrane with added BCP in a conventional guided bone regeneration procedure.
|
 | Figure 4Reconstructed images of micro-CT views at 2 weeks and 8 weeks. At both 2 and 8 weeks, the BG group (upper right; A) showed scattering of BCP particles outside of the defect, while the BG+M group (B) showed enclosed BCP particles in the defect area.CT: computed tomography, BCP: biphasic calcium phosphate, UV: ultraviolet, M: group of defects covered with an a BCP-supplemented UV-crosslinked collagen membrane without graft material, BG: group of defects filled with BCP particles without membrane coverage, BG+M: group of defects filled with BCP particles and covered with a BCP-supplemented UV-crosslinked collagen membrane in a conventional guided bone regeneration procedure.
|
Histomorphologic analysis
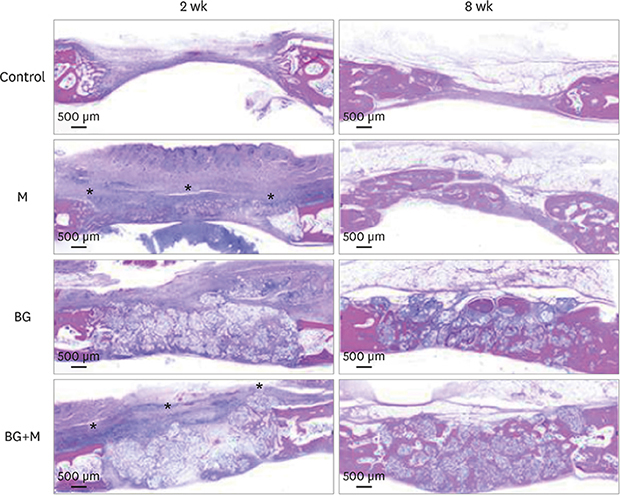
Illustrative examples of the results of the histomorphologic analysis are presented in Figure 5.
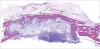
 | Figure 5Histological images obtained at 2 and 8 weeks. Low-magnification views of the sham control, BG, M, and BG+M groups, respectively (hematoxylin and eosin staining). The applied collagen membrane remained intact over the defects at 2 weeks in the M and BG+M groups. The remaining collagen membranes in the 2-week groups are marked with an asterisk (*).BCP: biphasic calcium phosphate, UV: ultraviolet, M: group of defects covered with an a BCP-supplemented UV-crosslinked collagen membrane without graft material, BG: group of defects filled with BCP particles without membrane coverage, BG+M: group of defects filled with BCP particles and covered with a BCP-supplemented UV-crosslinked collagen membrane in a conventional guided bone regeneration procedure.
|
Control
At 2 weeks, new bone formation was observed at the periphery of the defects. The center of the defects had sunk down and consisted of connective tissue. Epithelial tissue had infiltrated into the defect area. At 8 weeks, the defects were partially filled and closed with a thin, but mature, bone bridge that seemed to have grown from the periphery.
M group
At 2 weeks, most of the collagen membrane structure maintained firm and intimate contact with the underlying tissue. Endothelial cells were found under the collagen membrane, while some were found between the collagen membrane structures. A concave lower border of the defects due to the pressure of the underlying brain tissue was observed; however, epithelial tissue ingrowth from the upper border seemed to be prevented by the sound collagen membrane. At 8 weeks, the defect was filled and enclosed with a thin, mature bone bridge. Most of the membrane was degraded, although a few membrane remnants were found in the form of a thin film over the defect (Figure 6). No abnormal infiltration of inflammatory cells was observed in the healed defects and around the membrane remnants.
 | Figure 6A few membrane remnants were observed in the M group at 8 weeks. Both in hematoxylin and eosin and Masson trichrome stained slides, the remaining portion of the crosslinked collagen membrane is observed as a thin film shape. The remaining membrane is marked with an asterisk (*).BCP: biphasic calcium phosphate, UV: ultraviolet, M: group of defects covered with a BCP-supplemented UV-crosslinked collagen membrane without graft material.
|
BG group
At 2 weeks, the morphology of the defects was maintained by BCP, which degrades slowly and serves as a scaffold for new bone formation. The BCP particles were encapsulated with fibrovascular tissue. Some endothelial cells were observed between BCP particles. New bone formation was observed along the periphery of the defects and BCP particles. At 8 weeks, the BCP particles remained in place, without notable degradation. Mature new bone was observed in the interspaces of the BCP particles and the periphery of the calvarial defects. More new bone formation was found near the dura mater. The defects became fully filled with a matured bone bridge.
BG+M group
At 2 weeks, BCP particles maintained the volume of the defects, and the collagen membrane was intact with underlying BCP and surrounding native bone. There was no infiltration of inflammatory cells around the collagen membrane. Endothelial cells were found beneath the membrane and between the BCP particles. New bone formation was observed along the periphery of the defects and around the BCP particles.
At 8 weeks, as was the case for the other experimental groups, regenerated bone structure filled almost all of the defect margins, and new bone formation was found around the BCP particles and at the periphery of the defects. Unlike the BG group, more new bone formation was observed close to the upper border of the defect where the membrane was placed. In 2 of the 5 BG+M specimens, mature new bone was distinctively found above the graft materials where the membrane was located. In contrast, new bone formation was not observed in the graft material area (Figure 7).
 | Figure 7At 8 weeks in the BG+M group, matured new bone was found above the graft material area where the membrane was located, while new bone formation in the BCP-augmented area was insufficient. New bone that substituted the crosslinked collagen membrane is marked with an asterisk (*).BCP: biphasic calcium phosphate, UV: ultraviolet, BG+M: group of defects filled with BCP particles and covered with an BCP-supplemented UV-crosslinked collagen membrane in a conventional guided bone regeneration procedure.
|
Histometric analysis
The results of the histometric analysis are summarized in Table 2. The NBA in all 8-week groups was significantly higher than the NBA of the corresponding 2-week groups. The highest NBA was found in the BG+M group (2 weeks: 1.38±0.95 mm2, 8 weeks: 4.85±2.08 mm2), followed by the BG group (2 weeks: 1.17±0.79 mm2, 8 weeks: 4.74±1.10 mm2), M (2 weeks: 0.75±0.50 mm2, 8 weeks: 4.34±1.01 mm2) and the control group (2 weeks: 3.63±1.47 mm2, 8 weeks: 0.67±0.55 mm2). However, there were no statistically significant differences between the above figures.
Table 2
TAA, NBA, and RMA measured by histometric analysis

Values are presented as mean ± standard deviation (mm2).
TAA: total augmented area, NBA: new bone area, RMA: residual material area, BCP: biphasic calcium phosphate, UV: ultraviolet, M: group of defects covered with an BCP-supplemented UV-crosslinked collagen membrane without graft material, BG: group of defects filled with BCP particles without membrane coverage, BG+M: group of defects filled with BCP particles and covered with a BCP-supplemented UV-crosslinked collagen membrane in a conventional guided bone regeneration procedure.
a)Statistically significant difference compared to the control group; b)Statistically significant difference compared to the corresponding group at 2 weeks.
![]()
TAA was significantly higher in the BG and BG+M groups than in the M and control groups. The M group showed a higher TAA than the control group, but without statistical significance. When the RMA was compared between the 2- and 8-week groups, the only significant decrease was found in the BG group.
DISCUSSION
In the present study, it was confirmed that more new bone regeneration was shown when graft material was applied in combination with a BCP-supplemented UV-crosslinked collagen membrane than when graft material or the membrane was used alone. Histomorphologic observations found that the membranes degraded without inflammation or other side effects, although some of them were retained up to 8 weeks. The membranes’ resistance to degradation and biocompatibility were confirmed in this GBR procedure performed in a rabbit calvarial defect model.
Non-resorbable expanded-polytetrafluoroethylene (e-PTFE) membranes were previously regarded as the gold standard for GBR procedures due to their space-maintaining ability and cell-occlusiveness [2]. However, studies using various models showed that resorbable collagen membranes are comparable to non-resorbable membranes such as e-PTFE in terms of bone regeneration. The use of graft materials prevented the collapse of the defect and served as a scaffold for new bone formation; thus, in terms of space maintenance, graft materials could overcome the limitations of using only a resorbable membrane [318192021]. In addition to promoting the repopulation of desired bone cells by occluding the infiltration of soft tissue, the physiochemical properties of collagen membranes—including their angiogenic character, permeability to nutrition, and stabilization of graft materials—have been proposed as mechanisms of their positive results for new bone formation in GBR [422].
Previous in vivo studies compared the outcomes of GBR between bone grafting alone and the combined application of a bone graft and a collagen membrane. In a pig calvarial model, when deproteinized bovine bone mineral (DBBM) grafting alone and a combined application of DBBM with different types of collagen membranes were compared, higher new bone formation was observed in the groups to which DBBM and a collagen membrane were applied [8]. Likewise, in a rat calvarial model, enhanced osteogenesis was reported when the grafting materials were covered with collagen membrane compared to when bone grafting was performed alone [23]. The present study showed comparable results to those of previous studies.
Kitayama et al. evaluated bone regeneration using non-crosslinked porcine collagen membrane and BCP in a rabbit calvarial model [16], and reported a mean NBA percentage of 35% relative to the total tissue area. The corresponding percentage of NBA in the present study was 36%, despite a study design that utilized a larger defect size and a shorter postoperative healing period. In a previous study using chemically-crosslinked collagen membrane in the same experimental model, a mean NBA of 3.8 mm2 was found [7], whereas the mean NBA was 4.85 mm2 in the present study. Improved bone regeneration was found when a BCP-supplemented UV-crosslinked collagen membrane was used compared to a non-crosslinked collagen membrane and a chemically-crosslinked collagen membrane.
Various methods have been proposed for crosslinking collagen membranes. Glutaraldehyde had been widely used for economic reasons, but byproducts from glutaraldehyde were found to be cytotoxic [1112]. Subsequently, 1-ethyl-3-(3-dimethylamino propyl) carbodiimide (EDC) was introduced as an alternative chemical crosslinking agent due to its low cytotoxicity. EDC forms urea as a byproduct of crosslink degradation, which has lower cytotoxicity because of its water solubility [724]. Although the high water solubility of urea contributes to its diffusion, it is still a deterrent to the process of bone regeneration in GBR, which requires active angiogenesis. More specifically, elimination of urea might take place through diffusion, a relatively slow process that might contribute to high urea concentrations around the membrane, causing harmful effects to tissues encapsulated by the membrane. Additionally, EDC-mediated crosslinking uses free carboxylate groups in glutamate or aspartate residues and free primary amine groups. These groups are contained on amino acid side chains in proteins and function as cell binding sites. As a result, the use of amine groups by EDC is related to the reduced cell affinity and biocompatibility of the membrane [13]. In dehydrothermal crosslinking, the crosslinking mechanism reduces the–OH functional groups of amino acids in the collagen membrane by dehydration. The high temperature of the process may also cause denaturation of protein structures [6], reducing the hydrophilicity and tissue affinity of the collagen membrane.
In UV crosslinking, the crosslinks are formed by interactions of radicals from the conjugated aromatic rings of the aromatic amino acids in collagen molecules. Since this bonding mechanism does not consume any functional groups of amino acids, the biological characteristics of the collagen membrane related to cell binding and cell recognition are preserved. Due to the characteristics of radical reactions, there are no byproducts of crosslinking that might cause unwanted effects in the surrounding tissues. Furthermore, the UV irradiation process is itself a sterilization technique [13]. Owing to these characteristics of the UV crosslinking mechanism, the biocompatibility of the membrane can be maintained, while crosslinking increases the mechanical stability of the collagen matrix.
The addition of calcium sulfate particles to collagen membranes has been shown to increase mechanical strength and resistance to degradation in both in vitro and in vivo models [151625]. The addition of microcrystalline calcium phosphate particles to the collagen structure is beneficial for organizing the molecular-level structure, which affects the tensile strength and stiffness of a membrane. Furthermore, the added apatite particles cover the enzyme binding sites of collagen molecules, thereby inhibiting enzymatic degradation. This phenomenon becomes intensified as the number of microcrystalline particles increases [15]. For this reason, adding BCP microparticles to a collagen membrane increases its tensile strength and resistance to degradation.
In the present study, complete ossification of the membrane was observed in some specimens, while new bone formation seemed inferior in BCP-grafted areas. This result is consistent with those of a previous study with a ribose-based crosslinked membrane in a beagle model, which reported ossification of the membrane in GBR [26]. This can be explained in terms of the positive effects of type I collagen on the entrapment of osteoinductive molecules in the membrane, promoting osteoblast differentiation and the scaffold activity of type I collagen for bone matrix deposition [27]. Moreover, in this study, the dissolution of added BCP particles could provide Ca2+- saturated conditions favorable to osteoblastic cellular activity [14].
Nevertheless, this study had some limitations. First, due to the small number of defects in the rabbit calvaria, chemically-crosslinked collagen membranes and non-crosslinked collagen membranes could not be adequately assigned to experimental groups. Thus, it was not possible to make direct comparisons between crosslinked and non-crosslinked membrane groups, or between different crosslinked groups. Second, the efficacy, biocompatibility, and long-term stability of crosslinked membranes should be further researched in a canine defect model, as canine defect models more closely represent clinical atrophic edentulous bony conditions, with a higher rate of membrane exposure. Last but not least, the simultaneous application of UV crosslinking and addition of BCP particles made it challenging to interpret the results in terms of determining which factor was more strongly associated with the positive outcomes of bone regeneration (i.e., crosslinking or addition of BCP to the collagen membrane).
In conclusion, within the limitations of the present study, a BCP-supplemented UV-crosslinked collagen membrane, which increased its resistance to degradation and osteoconductivity in comparison to non-crosslinked collagen membranes, showed efficacy and biocompatibility in GBR procedures. More importantly, higher levels of new bone formation were found in the group in which the BCP-supplemented UV-crosslinked collagen membrane was used along with bone grafting. A further investigation is needed to compare the efficacy of the BCP-supplemented UV-crosslinked collagen membrane to that of other types of collagen membranes to determine which component of the membrane contributed to the positive outcomes of bone regeneration. Nonetheless, based on the results of this study, a BCP-supplemented UV-crosslinked collagen membrane could be considered as a biocompatible alternative to chemically crosslinked collagen membranes.
 XML Download