

 PDF
PDF ePub
ePub Citation
 Print
Print


INTRODUCTION
Improvement in early diagnosis and treatment has led to improved survival in breast cancer patients, such that the death rate decreased 39% during the period 1989–2015 [1]. Many studies have reported decreasing mortality in breast cancer patients due to widespread use of adjuvant systemic therapy, endocrine therapy, and targeted therapy [234]. Five-year relative survival rates for non-metastatic breast cancer have been reported as 91% in Asian women and 86% in white women [5]. There are many well-known prognostic factors in breast cancer including younger or older age at the time of initial diagnosis, larger tumor size, advanced nodal stage, absence of hormone receptors, and overexpression of human epidermal growth factor receptor-2 (HER2) [678910].
Sarcopenia is a disease characterized by reduced skeletal muscle mass and strength/function, which may decrease the quality of life while also increasing physical disability and mortality [11]. Recently, sarcopenia has gained attention as a prognostic factor of mortality in both non-metastatic and metastatic breast cancer [1213141516]. In the meta-analysis by Aleixo et al. [17], breast cancer patients with a lower skeletal muscle index had a 68% greater mortality risk compared to patients with a higher skeletal muscle index. Many studies have demonstrated a relationship of sarcopenia with overall survival (OS) in patients with various types of cancer including lung cancer, stomach cancer, pancreatic cancer, and lymphoma [18192021].
The amount of skeletal muscle can be measured by a variety of techniques such as dual-energy X-ray absorptiometry, bioelectrical impedance analysis, and cross-sectional imaging including computed tomography (CT) or magnetic resonance imaging (MRI) [11]. In cancer patients, sarcopenia is generally assessed by measurement of the skeletal muscle mass on clinically acquired CT scans. In breast cancer patients, CT or positron-emission tomography (PET)/CT scans of the chest and abdomen are commonly acquired. Before skeletal muscle mass on CT can be used as a prognostic biomarker, abundant evidence of its utility from different breast cancer populations and clinical settings is needed. Currently, there is sparse evidence with respect to the prognostic value of skeletal muscle mass measured on CT in patients with non-metastatic breast cancer. Therefore, we aimed to evaluate the prognostic value of skeletal muscle mass measured on CT in this patient population.
METHODS
Our Institutional Review Board approved this retrospective observational study (AJIRB-MED-MDB-18-292), which waived the requirement for informed consent. This study is reported in accordance with the Transparent Reporting of a multivariable prediction model for Individual Prognosis or Diagnosis (TRIPOD) guidelines [22].
Study population
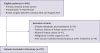
Between January 2012 and August 2014, we identified 648 consecutive women with newly diagnosed invasive breast cancer who had undergone both preoperative 18F-labeled fluoro-2-deoxyglucose (18F-FDG) PET/CT imaging and subsequent breast surgery. We excluded 14 patients who had distant metastasis at presentation, 9 patients who had a previous breast cancer history, 11 patients who had bilateral breast cancer, 18 patients who had malignancy in other organs, and 19 patients who underwent vacuum-assisted breast biopsy in private clinics before MRI. Finally, 577 women (mean age, 48.9 years; age range: 26–81 years) were included in this study (Figure 1).
Clinicopathologic data collection
Patients' clinical and pathological data were obtained from the medical records held by our hospital. Their demographic information, including age, sex, weight, height, and body mass index (BMI) was recorded. In addition, treatment-related information was obtained, such as the use of neoadjuvant/adjuvant chemotherapy; the follow-up period and OS data were also obtained. The final data collection was performed in July 2019. OS was defined as the time from the diagnosis of breast cancer to the date of death or the end of the study period.
Regarding the pathological assessment, surgical specimens were evaluated based on the following histopathologic features: tumor size, histological type of carcinoma, Black's nuclear grade (high, intermediate, low), modified Bloom–Richardson histological grade (high, intermediate, low), and estrogen receptor (ER), progesterone receptor (PR), and HER2 expression status. ER and PR expression was assessed using the Allred score, which was calculated as the sum of the proportion and intensity scores for positively-stained tumor cells. Tumors with an Allred score of 3 or more were regarded as positive. An Immunohistochemical HER2 scores of 3+ were considered positive. In cases of HER2 scores of 2+, HER2 gene amplification was confirmed using silver in situ hybridization. All specimens were reviewed by an experienced pathologist with 16 years of experience.
CT protocol
CT images used for sarcopenia analysis were derived from whole-body 18F-FDG PET/CT, which was performed in the supine position using a Discovery ST scanner (GE Healthcare, Milwaukee, USA). Non-enhanced CT scans were obtained from the base of the skull to the upper thigh (120 kV, 30–100 mA in AutomA mode; section width = 3.75 mm) and had image quality similar to that of diagnostic CT.
Measurement of skeletal muscle, visceral fat, and subcutaneous fat amounts
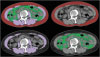
Body composition was evaluated using the acquired PET/CT images (Figure 2). An experienced radiologist (K.W.K) blinded to the clinical information performed the image analysis using the automated AsanJ-Morphometry™ software. AsanJ-Morphometry™ is a dedicated software for ImageJ (National Institutes of Health, Bethesda, USA) used to measure the abdominal muscle and fat area. The AsanJ-Morphometry software is open to the public for research purposes and downloadable at http://datasharing.aim-aicro.com/morphometry. Anyone can access the software, text manual, and video manual at this website. The inferior endplate level of the L3 vertebra was selected as a landmark because it correlates with whole-body skeletal muscle mass and adipose tissue mass [11]. The total abdominal muscle area (TAMA), including all muscles on the selected axial images (i.e., psoas, paraspinal, transversus abdominis, rectus abdominis, quadratus lumborum, and internal and external obliques), was demarcated using predetermined thresholds (−29 to +190 Hounsfield units). The visceral fat area (VFA) and subcutaneous fat area (SFA) were also demarcated using fat tissue thresholds (−190 to −30 Hounsfield units).
Statistical analysis
Regarding the clinicopathological information obtained and body morphometric analysis results, normality was assessed by inspecting frequency histograms or using the Kolmogorov-Smirnov test. Continuous data are presented as the means with standard deviations, and categorical data are presented as proportions.
All patients were divided into survival and non-survival groups, and clinicopathologic parameters were compared between the groups. Independent t-tests were used for analyzing continuous variables, and the χ2 test or Fisher's exact test was used for categorical variables.
Regarding body morphometric analysis, the means and standard deviations of the BMI, TAMA, SFA, and VFA among all patients were calculated. Patients were divided into 4 age groups: < 40 years, 40–49 years, 50–59 years, and ≥ 60 years. One-way analysis of variance and post hoc Tukey tests were used to compare the mean BMI, TAMA, SFA, and VFA among age groups.
To determine optimal cutoff values for body morphometric parameters with respect to predicting OS, receiver operating characteristic (ROC) curve analyses were performed using MedCalc software (version 10.3.0.0; MedCalc Software, Mariakerke, Belgium). The optimal cut-off values (in terms of sensitivity and specificity) for prediction of OS were those corresponding to the maximum Youden index [23]. To assess the independent contribution of each clinicopathologic variable to OS, univariate and multivariate Cox proportional-hazards regression analyses were performed and hazard ratios (HRs) with 95% confidence intervals (CIs) were calculated. Variables with a p-value < 0.1 on univariate analysis were entered into the multivariate model. Subgroup analyses were performed based on breast cancer stage and patient age. All other statistical analyses were performed using the Statistical Package for the Social Sciences (SPSS) software (version 25.0; IBM Corp., Armonk, USA). A p-value < 0.05 was considered statistically significant.
RESULTS
Patients
The clinical and pathologic characteristics of the patients are summarized in Table 1. The mean age was 48.9 ± 10.2 years. Ninety-three patients were aged < 40 years, 242 were aged 40–49 years, 158 were aged 50–59 years, and 84 were aged ≥ 60 years. In total, 114 patients underwent mastectomy, and 463 underwent breast-conserving surgery. The histological types of invasive breast cancer were as follows: invasive ductal carcinoma not otherwise specified (n = 521, 90.3%), invasive lobular carcinoma (n = 19, 3.3%), mucinous carcinoma (n = 16, 2.8%), invasive micropapillary carcinoma (n = 7, 1.2%), metaplastic carcinoma (n = 4, 0.7%), tubular carcinoma (n = 4, 0.7%), invasive cribriform carcinoma (n = 2, 0.3%), malignant phyllodes tumor (n = 2, 0.3%), medullary carcinoma (n = 1, 0.2%), and adenoid cystic carcinoma (n = 1, 0.2%). The median follow-up period was 74 months (range: 7–90 months). In total, 49 of the 577 patients (8.5%) died after a median of 45 months (range: 7–81 months).
Table 1
Clinical and pathologic characteristics of patients
ER = estrogen receptor; PR = progesterone receptor; HER2 = human epidermal growth factor receptor 2; BMI = body mass index; TAMA = total abdominal muscle area; SFA = subcutaneous fat area; VFA = visceral fat area.
*Data are means ± standard deviations, unless otherwise noted, data are numbers of patients, with percentages in parentheses.
Body morphometric analysis results
Mean values of the BMI, TAMA, SFA, and VFA by patient age are summarized in Table 2. The mean TAMA tended to decrease with increasing patient age. In contrast, the BMI, SFA, and VFA tended to increase with increasing patient age. One-way analysis of variance demonstrated that the mean values of BMI (p < 0.001), TAMA (p < 0.001), SFA (p = 0.015), and VFA (p < 0.001) differed significantly among age groups. Post hoc analyses revealed that the mean BMI was significantly lower in the < 40 years age group compared to that in the 50–59 years age group (p = 0.005) and ≥ 60 years age group (p < 0.001). The BMI was also significantly lower in the 40–49 years age group compared to that in the ≥ 60 years age group (p = 0.013).
Table 2
BMI, TAMA, SFA, and VFA according to the patients' age

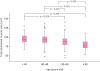
The mean TAMA was significantly decreased with increasing patient age, except between the < 40 and 40–49 years age groups (p = 0.826) (Figure 3). The mean SFA was significantly lower in the 40–49 years age group compared to that of the ≥ 60 years age group (p = 0.048). The mean VFA was significantly decreased with increasing patient age, except between the < 40 and 40–49 years age groups (p = 0.335). Based on the Youden Index, the best TAMA threshold to predict OS was 83.7 cm2.
Univariate and multivariate Cox proportional analysis
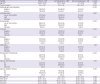
Among the clinicopathologic parameters, larger tumor size (HR, 1.563; 95% CI, 1.388–1.761; p < 0.001), axillary lymph node metastasis (HR, 2.789; 95% CI, 1.584–4.911; p < 0.001), high histological grade (HR, 2.24; 95% CI, 1.239–4.047; p = 0.008), high nuclear grade (HR, 3.318; 95% CI, 1.714–6.425; p < 0.001), receipt of neoadjuvant chemotherapy (HR, 2.918; 95% CI, 1.662–5.124; p < 0.001), and TAMA ≤ 83.7 cm2 (HR, 2.265; 95% CI, 1.293–3.967; p = 0.004) were associated with worse OS (Table 3). ER positivity (HR, 0.387; 95% CI, 0.221–0.678; p < 0.001), PR positivity (HR, 0.296; 95% CI, 0.166–0.53; p < 0.001), and receipt of adjuvant radiation therapy (HR, 0.514; 95% CI, 0.28–0.943; p = 0.032) were associated with better OS.
Table 3
Univariate and multivariate Cox proportional hazards analysis of variables associated with overall survival
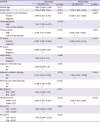
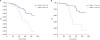
Variables with a p-value < 0.1 in the univariate analysis were entered into the multivariate Cox proportional-hazards model. The multivariate Cox analysis revealed that large tumor size (HR, 1.476; 95% CI, 1.286–1.694; p < 0.001), presence of axillary lymph node metastasis (HR, 2.608; 95% CI, 1.343–5.065; p = 0.005), high nuclear grade (HR, 2.355; 95% CI, 1.124–4.932; p = 0.023), and TAMA ≤ 83.7 cm2 (HR, 1.951; 95% CI, 1.061–3.586; p = 0.032) were associated with worse OS. ER positivity (HR, 0.381; 95% CI, 0.195–0.744; p = 0.005) and receipt of adjuvant radiation therapy (HR, 0.48; 95% CI, 0.253–0.908; p = 0.024) were associated with better OS. The Kaplan-Meier survival analysis showed that the OS times were significantly shorter in women with a lower TAMA value (≤ 83.7 cm2) than in those with a higher TAMA value (> 83.7 cm2) (p = 0.003, log-rank test) (Figure 4A).
Subgroup analysis in patients older than 50 years of age
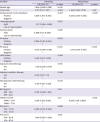
The univariate analysis revealed that tumor size (HR, 1.377; 95% CI, 1.111–1.707; p = 0.004), presence of axillary lymph node metastasis (HR, 3.039; 95% CI, 1.365–6.766; p = 0.007), nuclear grade (HR, 2.689; 95% CI, 1.151–6.284; p = 0.022), ER expression (HR, 0.294; 95% CI, 0.132–0.654; p = 0.003), PR expression (HR, 0.134; 95% CI, 0.046–0.391; p < 0.001), neoadjuvant chemotherapy (HR, 2.312; 95% CI, 1.022–5.233; p = 0.044), TAMA ≤ 77.14 cm2 (HR, 2.818; 95% CI, 1.285–6.182; p = 0.01), and SFA (HR, 0.399; 95% CI, 0.176–0.903; p = 0.028) were associated with OS in patients > 50 years of age.
The multivariate analysis results showed that tumor size (HR, 1.365; 95% CI, 1.049–1.776; p = 0.02), presence of axillary lymph node metastasis (HR, 2.559; 95% CI, 1.009–6.492; p = 0.048), PR expression (HR, 0.14; 95% CI, 0.047–0.416; p < 0.001), and TAMA ≤ 77.14 cm2 (HR, 2.856; 95% CI, 1.218–6.695; p = 0.016) remained as significant independent factors associated with OS in patients > 50 years of age (Table 4). The Kaplan-Meier survival analysis showed that the OS times were significantly shorter in women with a lower TAMA value (≤ 77.14 cm2) than in those with a higher TAMA value (> 77.14 cm2) (p = 0.007, log-rank test) (Figure 4B).
Table 4
Univariate and multivariate Cox proportional hazards analysis of variables associated with overall survival in patients older than 50 years
DISCUSSION
Our study demonstrated that skeletal muscle depletion measured on CT was a strong prognostic biomarker (HR, 1.95), along with other well-known prognostic variables including a large tumor size, presence of axillary lymph node metastasis, high nuclear grade, absence of ER, and absence of adjuvant radiation therapy. In addition, the optimal TAMA threshold for predicting OS was 83.7 cm2 in all patients with non-metastatic breast cancer. Especially in postmenopausal patients older than 50 years of age, the best threshold was 77.14 cm2, and the hazard ratio was 2.86, which showed a greater effect of skeletal muscle depletion on the patients' OS. Most previous studies reporting the importance of skeletal muscle volume have been performed in breast cancer patients from western countries, and our results could be useful for women in our country or other eastern countries.
Our study results are consistent with those of prior studies. Caan et al. [13] used data from 3,241 patients with non-metastatic breast cancer collected in the United States and demonstrated that patients with sarcopenia assessed by CT exhibited higher overall mortality (HR, 1.41; 95% CI, 1.18–1.69) than patients without sarcopenia. In addition, Villaseñor et al. [12] showed that sarcopenia assessed on dual X-ray absorptiometry (DXA) was associated with an increased risk of overall mortality (HR, 2.86; 95% CI, 1.67–4.89) in 471 survivors of non-metastatic (stage I–IIIA) breast cancer in the United States. Importantly, our study demonstrated that sarcopenia is also a prognostic factor in Asian patients.
In breast cancer patients, several prognostic factors have already been identified, which can be categorized into patient-, tumor-, and treatment-related factors. Commonly identified patient factors include age, obesity, ethnicity, and socioeconomic status [10]. Our study and other recent investigations provide evidence favoring the use of sarcopenia as a powerful prognostic factor. We used CT image for the quantification of skeletal muscle area, and the most important advantage of CT was that we could simultaneously obtain the skeletal muscle volume and subcutaneous and visceral fat masses. We analyzed the effect of BMI, subcutaneous fat volume, and visceral fat volume on patients' survival and interestingly, our results revealed that abdominal muscle mass was closely related to OS, while BMI and abdominal fat mass (i.e., VFA and SFA) were not; this challenges the general concept that obesity is a prognostic factor in breast cancer. In some studies, leaner people showed a higher risk of death than obese people, raising the issue of an “obesity paradox” [2425]. Debate is currently ongoing regarding whether muscle or fat is more important in breast cancer; the findings of our study suggest that the former is more important.
Regarding the mechanism underlying the impact of sarcopenia on general health, the concept of muscle function has been revolutionary. In the past, skeletal muscle function was regarded as strictly limited to mobility and mechanical function. However, it is now known that muscle has various other functions, including metabolic, endocrine, neurological, and psychological functions [26]. Notably, myokines (muscle-related cytokines) communicate with other organs to promote glucose production in the liver, lipolysis in adipose tissue, increased viability of pancreatic beta cells, and secretion of insulin [1726]. In addition to these metabolic effects, a lack of muscle in sarcopenia can lead to physical disability, hospitalization, and poor quality of life [2728]. These effects of muscle are closely related to disease resistance, treatment endurance (e.g., following major surgery and chemotherapy), and OS [17]. For example, women with breast cancer who had sarcopenia were much more likely to have severe chemotherapy-related side effects, hospitalizations, and treatment interruptions, all of which can influence OS [29].
In this context, the evaluation of sarcopenia is increasingly emphasized. Common methods for evaluating sarcopenia now include CT, DXA, and bioimpedance analysis. In breast cancer patients, CT scans are commonly acquired for staging and treatment planning. These clinically acquired CT scans are readily available for the majority of breast cancer patients; thus, they can be easily integrated into clinical practice without additional tests. Another advantage of CT is the simultaneous measurement of skeletal muscle volume and abdominal fat mass, including subcutaneous fat and visceral fat. Conversely, DXA and bioimpedance analysis are auxiliary procedures that involve additional time and cost. In our hospital, PET/CT scans are performed in accordance with the institutional policy for all breast cancer patients who are scheduled to undergo surgery, and the quality of these scans is sufficient for assessment of disease severity, as well as for measurement of abdominal muscle and fat.
There were several limitations to this study. First, the study involved patients from a single center, which limits the generalizability of the findings. However, our hospital is a tertiary referral center and actively receives patients from many community centers in both rural and urban areas. Second, we included patients who underwent neoadjuvant chemotherapy, and we used the clinical stage and tumor size measured on initial MRI for these patients.
In conclusion, skeletal muscle depletion measured on CT scans is a strong prognostic biomarker for OS in patients with non-metastatic breast cancer. In patients older than 50 years of age, skeletal muscle depletion had a greater effect on patients' survival. The measurement of muscle mass on clinically acquired CT scans will help to guide management plans for the optimization of survival outcomes in patients with non-metastatic invasive breast cancer.
 XML Download