

 PDF
PDF ePub
ePub Citation
 Print
Print


INTRODUCTION
C-terminal binding protein 1 (CtBP1) was originally identified as an adenovirus E1A binding protein. CtBP1 binds to the C-terminal region of E1A and represses E1A mediated cell transformation and tumorigenesis [1]. As a well-characterized transcriptional co-repressor, CtBP1 represses numerous target genes that are involved in initiation, metabolism, cell survival, proliferation, migration, and invasion of cancer cells, through interaction with Pro-X-Asp-Leu-Ser (PxDLS) motif containing protein partners including histone deacetylases, histone demethylase, and other transcriptional factors [23]. Owing to its lack of DNA binding ability, CtBP1 requires interaction with transcription factors to form a complex to regulate the transcription of target genes. E-cadherin and p21 are well-studied targets regulated by CtBP1. It is reported that CtBP1 interacts with the transcription factor zinc‐finger E‐box binding homeobox (ZEB) 1, ZEB 2, and snail contributing to the transcriptional repression of E-cadherin [45]. The interaction between CtBP1 and ZEB was significantly enhanced under hypoxia, and represses E-cadherin in cancer cells [6]. In response to DNA damage, p21 induces cell cycle arrest in a p53-dependent manner. Recent studies demonstrated that CtBP1 and poly (ADP-ribose) polymerase (PARP) formed a complex that bound to the p21 promoter to repress p21 expression in p53-dependent and independent ways [7]. In addition to PARP, the transcription factor Kruppel-like factor 4 was reported as another protein partner involved in CtBP1-mediated p21 transcriptional repression [8].
The co-repressor activity of CtBP1 is regulated by cellular nicotinamide adenine dinucleotide, reduced (NADH)/oxidized, NAD+ (NAD+) ratio [9] because CtBP1 can bind to NADH or NAD+ through its dehydrogenase domain [10]. Increasing cellular NADH/NAD+ ratio, like under hypoxia condition, promotes CtBP1 repression activity leading to transcriptional repression of the target genes [611]. Overexpression of CtBP1 was found in many cancers including melanoma [12], head and neck cancer [11], breast cancer [13], and colon cancer [14], and is associated with poor survival [15] suggesting that CtBP1 is a potential therapeutic target in cancer.
Protocatechuic aldehyde (PA) is a natural compound in the root of a traditional Chinese herb, Salvia miltiorrhiza. Recent studies showed that PA had anticancer activity in breast cancer cells [16]. However, the underlying mechanisms and the targets of PA remain unclear.
Microscale thermophoresis (MST) assay, a new and sensitive technique based on thermophoresis which is the directed movement of molecule along a temperature gradient, is used for studying biomolecular interactions. The assay is performed in aqueous environment with temperature gradient induced by an infrared laser. Two different molecules, 1 labeled with a fluorescent dye and the other without a label, are mixed in a buffer. The interaction of the 2 molecules changes the molecular properties including charge, size, hydration shell, and conformation, which sequentially affects molecular thermophoretic movement and is reflected by changes in the fluorescent signal. The changes in the movement are used to calculate the binding affinity of the 2 molecules that can range from pM to mM [17].
In this study, we combined structure-based virtual screening with MST assay to identify PA that directly bound to the dehydrogenase domain in CtBP1 and specifically attenuated the repression activity of CtBP1 on p21 and E-cadherin suggesting that PA inhibited the proliferation and migration of breast cancer cells through directly targeting CtBP1. PA could therefore be a potential CtBP1 inhibitor.
METHODS
Cell culture reagents
All cell lines, including 293T, MDA-MB-231, and MCF-7 with or without CtBP1 expression were maintained in suitable culture medium supplemented with 10% fetal bovine serum (FBS; Cat. No. 085-150; Wisent, St-Bruno, Canada) as described previously at 37°C with 5% CO2 [18]. PA (Sigma-Aldrich, St. Louis, USA) was dissolved in dimethyl sulfoxide (DMSO; Cat. No. D8371; Solarbio Science & Technology, Beijing, China).
Structure-based computational screening
Four CtBP1 structures (Protein Data Bank [PDB] codes: 1MX3, 4LCE, 4U6Q, and 4U6S) with resolutions higher than 2.50 Å were retrieved from the PDB. A total of 8,000 in-house compounds were preprocessed using Ligprep 3.6 (Schrödinger, New York, USA) applying OPLS_2005 force field [19], which is adequate for pharmaceutically relevant organic molecules, with Epik 3.4 (Schrödinger) to generate proper protonation states at pH 7.0 ± 2.0.
With the default docking parameters by Glide 6.9 (Schrödinger) in standard precision, the phenylpyruvate yields a root mean square deviation value of 1.72 Å compared to its crystal pose (PDB ID: 4U6S), which is suitable for further study. Therefore, in silico docking of the 8,000 in-house compounds against the 4 CtBP1 structures were performed with the above parameters.
Protein expression and purification
Complementary DNAs (cDNAs) encoding the wild-type and mutant CtBP1 protein were cloned into the pET28a plasmid. The sequence confirmed pET28a-CtBP1-wt and pET28a-CtBP1-mt were transformed into BL21 (DE3) Escherichia coli strain. The expression of 6xHistag-CtBP1 was induced using 0.2 mM Isopropyl-b-D-thiogalactopyranoside at 20°C for 8 hours. Cells from 1 L cultures were then harvested by centrifugation at 5,000 rpm for 15 minutes at 4°C, resuspended in 5 mL of TG100 buffer (50 mM Tris-HCl, pH 7.5, 10% glycerol, 100 mM NaCl), and lysed by sonication. The lysate was cleared by centrifugation at 12,000 rpm for 30 minutes. The supernatant was subjected to Ni-sepharose affinity purification. The bound 6xHistag-CtBP1 was eluted with 5 mL of TG100 buffer supplemented with 200 mM imidazole and subjected to 10% sodium dodecyl sulphate polyacrylamide gel electrophoresis (SDS-PAGE) for analysis.
MST assay
MST was used to determine the binding affinity of CtBP1 for PA. Wild-type and mutated CtBP1 proteins were labeled with fluorescence dye using the Monolith Protein Labeling Kit (Cat. No. L001; NanoTemper Technologies, München, Germany). The assays were performed in a buffer with 20 mM Tris, 0.3 M NaCl, 5% glycerol, 3% DMSO, and 0.05% Tween-20 at pH 7.4. After a 30-minutes incubation, the samples were loaded into Monolith NT.115 (NanoTemper Technologies) standard glass capillaries. During the MST experiments, the concentration of the labeled CtBP1 was kept constant at 3.15 μM, while that of PA was serially diluted in the ratio of 1:2. In total, 16 titration series of PA from the maximal final concentration of 0.66 mM to the minimal concentration of 0.05 nM were prepared and mixed with the labeled CtBP1. Fluorescence was analyzed in the Monolith NT.115 device. The MST power and excitation power used were 20% and 75%, respectively.
Site directed mutagenesis
Site directed mutagenesis was performed using a polymerase chain reaction (PCR)-based strategy.
For mutating Arg97 to Ala97, codon CGG was replaced with GCC using the following primers: forward, CATCGTCGCCATTGGCAGTGGTTTTGACAACATCGAC; reverse, CCAATGGCGACGATGATGCGGAGGGCTTTGAACTTC.
For mutating Arg266 to Ala266, codon CGG was replaced with GCC using the following primers: forward, CAGCCGCCGGTGGCCTGGTGGATGAGAAGGCG; reverse, CCACCGGCGGCTGTGTTCACCAGGAAGGCCCC.
For mutagenesis PCR, PCDNA3.1-CtBP1-wt plasmid stocked in our lab was used as the template and amplified using PhusionHigh-Fidelity DNA Polymerase (Cat No. M0530S; New England Biolabs, Ipswich, USA). The PCR reaction was performed using the following cycling conditions; denaturation at 98°C for 5 minutes, followed by 30 cycles of denaturation at 98°C for 30 seconds, primer annealing at 60°C for 30 seconds, and primer extension at 72°C for 4 minutes. Upon completion of the cycling steps, a final extension was done at 72°C for 10 minutes. Then the PCR products were digested with DpnI (Cat No. R0176V; New England Biolabs) overnight and transformed into DH5α competent cells for mutant growth and selection.
Western blot analysis
Cells were lysed using RIPA 150 lysis buffer supplemented with 1× protease inhibitor (Cat. No. 04693116001; Sigma-Aldrich). Then, total cell lysates were separated using SDS-PAGE and transferred to polyvinylidene fluoride membranes (Cat. No. 162-0177; Bio-Rad, Hercules, USA). The membranes were incubated with primary and secondary antibodies, and the signal was detected using an enhanced chemiluminescence reagent (Cat. No. 34577; Thermo Scientific, Rockford, USA). The primary antibodies used for western blot analysis were Rabbit anti-p21 (Cat. No. 2947; Cell Signaling Technology, Danvers, USA), Rabbit anti-CtBP1 (Cat. No. ab129181; Abcam, Cambridge, USA), Mouse anti-glyceraldehyde 3-phosphate dehydrogenase (Cat. No. 60004-1-Ig; Proteintech, Wuhan, China), and Rabbit anti E-cadherin (Cat. No. 20874-1-AP; Proteintech)
Quantitative real-time reverse transcription PCR
The TRIzol reagent (Cat. No. 15596026; Invitrogen, Carlsbad, USA) was used to extract the total RNA. A total of 100 ng of total RNA was used for reverse transcription to cDNA using the cDNA Synthesis kit (Cat. No. K1622; Thermo Scientific). E-cadherin and p21 expression was evaluated using the following primers: E-cadherin forward, 5′-GCAGCCAAAGACAGAGCGGAAC-3′; E-cadherin reverse, 5′ ACCCACCTCAATCATCCTCAGCA -3′; p21 forward, 5′- GCTATTTTGTCCTTGGGCTG-3′; p21 reverse, 5′ ATTAGCGCATCACAGTCG -3′.
The 18S expression was used as an internal control and the sequences used were: 18S forward, 5′- TGACGGAAGGGCACCACCAG-3′; 18S reverse, 5′ GCACCACCACCCACGGAATC-3′.
The relative expression levels were calculated by normalizing with internal controls.
Chromatin immunoprecipitation (ChIP)
MDA-MB-231 and MCF-7 cells, with or without 100 μM PA treatment, were used for the ChIP assay as described previously [620]. Eighty percent confluent cells were cross-linked with 1% formaldehyde for 15 minutes, then the reaction was stopped by the addition of 0.125 M glycine. Cell pellet was sonicated in lysis buffer. Fragmented DNA was precipitated with CtBP1 antibody (Cat. No. ab129181; Abcam) and protein A beads (Cat. No. 26159; Thermo Scientific). Precipitated protein/DNA complexes were reverse cross-linked with additional 350 mM NaCl at 65°C for 6 hours. The DNA fragments were then purified and used for PCR analysis. Primers used for detecting E-cadherin and p21 promoters are as follows: E-cadherin forward, 5′- GGCGTCGGAACTGCAAAGCA -3′; E-cadherin reverse, 5′-GGAGCGGGCTGGAGTCTGAA -3′; p21 forward, 5′-TCTTTTCAGCTGCATTGGG -3′; p21 reverse, 5′- TTGGAGAATGAGTTGGCAC -3′.
Line1 was used as an internal control and the primer sequences are: Line1 forward, 5′-GCGCAAGGGGTCAGGGAGTT-3′; Line1 reverse, 5′- CTCGTGGTGCGCCGTTTCTT -3′.
Three-(4,5-Dimethylthiazol-2-yl)-2,5-diphenyltetrazolium bromide (MTT) assay
MTT assay were used for determining cell growth and IC50. MTT assay kit was purchased from Sigma (Cat. No. 11465007001; Sigma-Aldrich) and used according to the manufacturer's instructions. Each assay was repeated 3 times.
Clustered regularly interspaced short palindromic repeats associated Cas9 nuclease (CRISPR/Cas9) mediated CtBP1 knockout
We generated CtBP1 knockout cells using a lentivirus-mediated knockout protocol. The single-guide RNA (sgRNA) sequences used in the experiment are: forward 5′- CACCGGTCCGACCTCCGATCATGAA -3′ and reverse 5′-AAACTTCATGATCGGAGGTCGGACC-3′. Annealed sgRNA oligo was ligated into the lentiCRISPR vector obtained from Addgene (Plasmid #52961; Addgene, Cambridge, USA). The constructed lentiCRISPR vector containing CtBP1 sgRNA was transduced into 293T cells with the packing plasmids psPAX2 and pMD2 to produce lentivirus.
MDA-MB-231 and MCF-7 cells were infected with the lentivirus for 24 hours and then selected with 1 μg/mL puromycin for 14 days. The selected cells were plated into 96-well plates at 1 cell/well. After the single cell expanded to a clone formation, an aliquot of the cells was used to verify CtBP1 expression by western blotting. The clone without CtBP1 protein expression was sent to Sanger sequencing for further confirmation.
Scratch assay
Confluent cells in 6-well plates were maintained in culture medium with or without PA. Uniform wounds in the confluent monolayer of cells were generated using a 200 μL pipette. After 24 hours of culture for MAD-MB-231 or 48 hours of culture for MCF-7 cells, the percentage of closure area was measured using Image-J software. The assay was repeated 3 times.
Transwell assay
The 3 × 10⁴ MAD-MB-231 or 2.5 × 10⁵ MCF-7 cells were seeded in the upper chamber of the polycarbonic transwell chamber (Cat. No. 353097; Corning, Tewksbury, USA) with serum free Dulbecco's Modified Eagle's Medium (DMEM) (Cat. No. 319-015-CL; Wisent) and the lower chamber of the transwell chamber was filled with DMEM with 10% FBS. For MDA-MB-231 cells, 50 μM or 100 μM PA was added to the upper chamber for 48 hours incubation. For MCF-7 cells, 50 μM or 100 μM PA was added to the upper side for 96 hours incubation. After incubation, the cells stayed on the upper surface of the chamber were removed with cotton swabs. Washed the chamber with 1× phosphate-buffered saline (PBS) 2 times and fixed the penetrated cells on the lower surface of the chamber with 95% ethanol for 20 minutes. Fixed cells were stained by 0.1% crystal violet. Images were taken by the Olympus LX73 microscope (Olympus Corporation, Tokyo, Japan).
Immunofluorescence
Cells were washed with PBS for 3 times then fixed with 4% paraformaldehyde for 15 minutes, followed permeabilization by 0.1% Triton for 10 minutes and blocking with 1% bovine serum albumin (BSA) for 1 hour. Fixed cells were washed 3 times with PBS then incubated with E-cadherin antibody (Cat. No. 20874-1-AP; Proteintech) in 1% BSA overnight at 4°C, and sequentially incubated with Alexa Fluor 488 (Invitrogen) for 1 hour. Fluorescence labeled cells were mounted with mounting medium (Vector Laboratories, Burlingame, USA). Images were taken by Olympus LX73 microscope (Olympus Corporation).
Statistical analysis
All the statistical analyses were performed using SPSS software version 21.0 (IBM Corp., Armonk, USA). The results are presented as mean ± standard deviation for 3 independent experiments and analyzed by Student t-test or 1-way ANOVA analysis. A post hoc test was performed for multiple comparisons. The p < 0.05 was considered statistically significant.
RESULTS
Computational screening for compounds against CtBP1 and binding validation
The computational screening details and parameters are described in the methods section. The substrate phenylpyruvate in 4U6S was selected to define the docking grid. In silico docking of the 8,000 in-house compounds against the 4 CtBP1 structures were used as potential candidates. After careful visual inspection of the docked conformations, 24 compounds were selected for further in vitro analyses. In vitro experiments confirmed that PA (Figure 1A) shows a pronounced inhibitory effect on CtBP1. We performed MST assays to examine if PA could bind to CtBP1 and to test whether there was a direct interaction between PA and CtBP1. Results of the MST assays showed that the binding affinity of PA to CtBP1 was 245 ± 23.5 nM, suggesting that there was a direct binding between the 2 molecules. Two sites in CtBP1, Arg97 and Arg266, were predicted to interact with PA. Simultaneous mutation of the 2 sites from arginine to alanine disrupted the interaction between the 2 molecules (Figure 1B and C, Supplementary Figure 1).
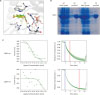 | Figure 1PA directly binds to CtBP1. (A) Docking mode of PA against CtBP1. CtBP1 is shown in cartoon, phenylpyruvate in green sticks, and PA in yellow sticks. Arg97, Arg266, Trp318, and NAD401 are in gray sticks. The distances are shown with yellow dashes. (B) Wild-type and CtBP1 mutant proteins with Arg97Ala and Arg266Ala substitutions were expressed in BL21(DE3) Escherichia coli strain and purified. The sodium dodecyl sulphate polyacrylamide gel electrophoresis gel shows the proteins before and after purification. (C) Quantification of the binding affinity of PA to CtBP1 using Microscale thermophoresis assay. The binding affinity of PA for wild-type CtBP1 was 245 ± 23.5 nM (shown in the upper panel). The lower panel shows the thermophoresis signal from PA to CtBP1 mutant, which was too chaotic to obtain a typical dose-response curve indicating there is no significant binding between PA and CtBP1 mutant.PA = protocatechuic aldehyde; CtBP1 = C-terminal binding protein 1.
|
PA inhibits proliferation and migration of breast cancer cells
Previous studies reported that PA had anticancer effects and inhibited the proliferation of breast cancer cells. To examine the anticancer effects, we treated MDA-MB-231 and MCF-7 cells with 100 μM PA (the concentration used in the reported study). Consistent with previous literature, our data also showed that PA significantly inhibited the growth of both MDA-MB-231 and MCF-7 cells at the concentration of 100 μM (Figure 2A). Next, we assayed the effect of PA treatment on breast cancer cell migration. The scratch and transwell assays showed that the migration abilities of MDA-MB-231 and MCF-7 cells were inhibited by PA in a dose-dependent manner (Figure 2B and C).
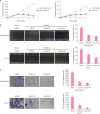 | Figure 2PA inhibits the growth and migration of breast cancer cells. (A) Growth curves of MDA-MB-231 and MCF-7 cells treated with 0.1% DMSO or 100 μM PA, respectively. (B) Migratory ability of breast cancer cells was tested using the scratch assay. PA exhibited inhibitory effect at the concentration of 50 μM in both MDA-MB-231 and MCF-7 cells. Representative images show the wound with or without PA treatment. (C) Migratory ability of breast cancer cells was tested using the transwell assay. The number of cells that migrated were calculated from 3 randomly chosen microscopic fields. Results shown in the bar diagram are mean ± SD from triplicate experiments.PA = protocatechuic aldehyde; DMSO = dimethyl sulfoxide; SD = standard deviation.
*p < 0.05.
|
PA attenuates CtBP1 repression activity on p21 and E-cadherin
The well-studied targets of CtBP1, p21 [721], and E-cadherin [613], which promote cancer cell survival and migration are transcriptionally repressed by CtBP1. Therefore, we examined the expression of p21 and E-cadherin in MDA-MB-231 and MCF-7 cells following treatment with 50 or 100 μM PA for 48 hours. As expected, the expression of p21 and E-cadherin was increased at both messenger RNA (mRNA) and protein levels implying that p21 and E-cadherin may be transcriptionally upregulated (Figure 3A and B). Further, we performed the CtBP1 ChIP-qPCR to determine the binding intensity of CtBP1 at the promoter regions of p21 and E-cadherin. The results showed that PA evicted CtBP1 from the promoter regions of p21 and E-cadherin (Figure 3C). These data imply that PA may rescue p21 and E-cadherin expression from CtBP1-mediated inhibition in breast cancer cells.
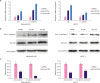 | Figure 3PA upregulates p21 and E-cadherin expression in MDA-MB-231 and MCF-7 cells. (A) PA upregulated p21 and E-cadherin mRNA expression in a dose-dependent manner following treatment for 48 hours. (B) PA upregulated p21 and E-cadherin protein levels following treatment for 48 hours. (C) The CtBP1 Chromatin Immunoprecipitation assay showed PA treatment decreased CtBP1 binding intensities at the promoter regions of p21 and E-cadherin.PA = protocatechuic aldehyde; CtBP1 = C-terminal binding protein 1; DMSO = dimethyl sulfoxide; GAPDH = glyceraldehyde 3-phosphate dehydrogenase; mRNA = messenger RNA.
*p < 0.05.
|
CtBP1 knockout breast cancer cells exhibit resistance to PA-mediated repression of growth and migration
To validate that the inhibitory effects of PA on the malignant properties of breast cancer cells are mediated through targeting CtBP1, we generated CtBP1 knockout MDA-MB-231 and MCF-7 cells using the CRISPR/Cas9 genome editing system. Western blotting and Sanger sequencing confirmed that CtBP1 was successfully knocked out from the MDA-MB-231 and MCF-7 cells (Figure 4A and B). Like the results obtained for CtBP1 knockdown in previous studies, CtBP1 knockout cells showed increased p21 and E-cadherin mRNA and protein expression (Figure 4B).
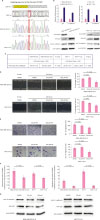 | Figure 4Knockout of CtBP1 increases the resistance to PA. (A) Clustered regularly interspaced short palindromic repeats associated Cas9 nuclease-mediated CtBP1 knockout in MDA-MB-231 and MCF-7 cells. The sgRNA used in this study is highlighted in yellow. The targeting sequence of the sgRNA is in the minus strand of the 2nd exon of CtBP1. Sanger sequencing confirmed that both the knockout cell lines had an adenine insertion between the 57th and the 58th nucleotides in the 2nd CDS exon of human CtBP1. The red rectangles indicate the position of the inserted adenine from Sanger sequencing and alignment results. (B) Knockout of CtBP1 in breast cancer cells increased p21 and E-cadherin mRNA and protein expression. (C) Complete deletion of CtBP1 in MDA-MB-231 and MCF-7 cells increased the IC50 values of PA in the breast cancer cells after 48 hours of treatment. (D and E) The CtBP1 knockout MDA-MB-231 and MCF-7 cells showed resistance to PA-mediated inhibition of migration. 50 μM PA did not show any inhibition in the knockout cells while 100 μM PA showed slight inhibition. (F) The inhibition of migration mediated by 100 μM PA was reduced in the CtBP1 knockout cells compared to CtBP1 expressing cells. The relative inhibitory effect is presented by the covered area or migrated cells ratios of the DMSO group/100 μM PA treated group which were calculated using the mean values of the groups. (G) p21 and E-cadherin expression did not respond to PA treatment in the CtBP1 knockout cells.CtBP1 = C-terminal binding protein 1; PA = protocatechuic aldehyde; GAPDH = glyceraldehyde 3-phosphate dehydrogenase; DMSO = dimethyl sulfoxide; sgRNA = single-guide RNA; mRNA = messenger RNA.
*p < 0.05.
|
E-cadherin immunofluorescence staining confirmed that CtBP1 knockout or PA treatment increased E-cadherin level in both MDA-MB-231 and MCF-7 cells, however, treatment with 100 μM PA did not change E-cadherin level in CtBP1 knockout cells. Changes in E-cadherin localization patterns, which was mainly distributed in the cytoplasm in MDA-MB-231 cells but localized mainly on the membrane in MCF-7 cells, were also observed. In addition, E-cadherin translocated from the cytoplasm into the nucleus in PA treated and in CtBP1 knockout MDA-MB-231 cells. However, translocation of E-cadherin was not observed in MCF-7 cells (Supplementary Figure 2).
Next, we treated the CtBP1 knockout breast cancer cells with PA for cell growth inhibition and migration assays. As expected, CtBP1 knockout breast cancer cells had significantly higher IC50 values compared to CtBP1 expressing breast cancer cells after 48 hours of PA treatment, suggesting that the growth inhibition was attenuated in the knockout cells (Figure 4C). Scratch and transwell assays showed that PA did not inhibit migration of CtBP1 knockout breast cancer cells at a concentration of 50 μM. Although there was a statistically significant difference between the DMSO treatment group and 100 μM PA treatment group (Figure 4D and E), the PA-induced repression of migration was more reduced in the CtBP1 knockout cells than in the CtBP1 expressing cells (Figure 4F). These data imply that knockout of CtBP1 attenuated the repression effect of PA on the growth and migration of breast cancer cells. Lastly, we examined the expression of p21 and E-cadherin in the CtBP1 knockout breast cancer cells following PA treatment. No significant difference was detected in mRNA (data not shown) and protein expression between the PA and DMSO treated groups (Figure 4G).
Taken together these data suggest that PA regulates the expression of CtBP1 targets by directly interacting with CtBP1, and inhibited the growth and migration of breast cancer cells through CtBP1 inhibition.
DISCUSSION
Given the oncogenic roles of CtBP1 in the initiation and progression of multiple cancers, it could be a promising target for cancer therapy [22]. In recently studies a series of CtBP1 inhibitors were screened out, including chemical compounds 4-methylthio 2-oxobutyric acid (MTOB) [23] and 2-hydroxyimino-3-phenyl-propionic acid to block the dehydrogenase activity of CtBP1 [24], short peptide CP61 to prevent the dimerization of CtBP1 [25] and NSC95397 to interfere with its interaction with its protein partner through the PxDLS motif [26].
The dehydrogenase domain of CtBP1 is required for CtBP1-mediated transcriptional repression and binding to the PxDLS motifs in protein partners [10]. The enzymic properties allow CtBP1 to be druggable and targetable. The CtBP dehydrogenase inhibitor, MTOB, induced apoptosis in colon cancer cells through the eviction of CtBP from the promoter region of the pro-apoptotic gene Bik and recruited Bik expression, but did not induce apoptosis in mouse embryonic fibroblasts suggesting targeting CtBP dehydrogenase may be potentially applied to cancer therapy [27].
In this study, we found that PA directly bound to the dehydrogenase domain of CtBP1 and inhibited the growth and migration of breast cancer cells, like a CtBP1 inhibitor, by evicting CtBP1 from the promoters of p21 and E-cadherin and rescued p21 and E-cadherin expression. The mRNA and protein expression of p21 and E-cadherin did not respond to PA treatment in the CtBP1 knockout breast cancer cells suggesting that PA regulated the tumor suppressors p21 and E-cadherin through CtBP1 inhibition and highlighted the specificity of CtBP1 targeting. Moreover, we observed changes in E-cadherin localization patterns in metastatic MDA-MB-231 and non-metastatic MCF-7 cells reflecting the important role of E-cadherin localization in cell metastasis. Depletion of CtBP1 or PA treatment re-localized E-cadherin from cytoplasm into nucleus in MDA-MB-231 but not found in MCF-7 cells implying that CtBP1 not only regulated E-cadherin expression but also affected E-cadherin localization in distinct cellular contexts. However, the exact mechanisms remain to be explored further.
Finally, the notable reduction in the repression effect of PA on cell growth and migration in the CtBP1 knockout cells demonstrated that the anticancer activity of PA was through targeting of CtBP1.
On the other hand, we observed toxicity of PA in the CtBP1 knockout breast cancer cells, which still inhibited the growth of CtBP1 knockout cells indicating some off-target effects. The CtBP family is comprised of 2 members, CtBP1 and CtBP2. CtBP2 harbors a highly similar structure in the dehydrogenase domain with that of CtBP1 [28] and CtBP2 also plays important roles in cancer development and progression as a transcriptional co-repressor [2]. We inferred that PA could target CtBP2 also, and that some of the off-target effects may be due to CtBP2 targeting. In addition, other groups reported that PA inhibited breast cancer cell growth through downregulation of β-catenin and cyclin D1 without changing mRNA expression [29]. PA downregulated phosphoinositide-3-kinase/Akt and the mitogen-activated protein kinase pathways in vascular smooth muscle cells to inhibit cell proliferation and migration [30] indicating that there were multiple targets regulated by PA to control cell growth and migration.
Collectively, our research demonstrated that PA regulated proliferation and migration of breast cancer cells through directly binding to CtBP1 and can therefore be potentially modified and developed as a specific CtBP1 inhibitor for cancer therapy. Further studies are required to elucidate structural modifications of PA that will enhance its binding affinity and selectivity for CtBP1.
 XML Download