

 PDF
PDF ePub
ePub Citation
 Print
Print


INTRODUCTION
Crohn's disease (CD) is a chronic relapsing inflammatory bowel disease characterized by transmural inflammation and may manifest with varying degrees of fibrosis resulting in intestinal narrowing or even obstruction. Irreversible bowel obstruction resulting from severely fibrotic bowel stricture commonly requires surgical excision (1). Therefore, an exact differentiation among various degrees of intestinal fibrosis and an accurate distinction of severely fibrotic bowel walls from mild-to-moderately fibrotic bowel walls is crucial and urgently needed for ensuring appropriate clinical treatment.
Recently, magnetization transfer (MT) magnetic resonance imaging (MRI), referred to as MT imaging (MTI), is a noninvasive method for accurately detecting and distinguishing varying degrees of intestinal fibrosis in CD (234). Bowel fibrosis in CD is characterized by excessive collagen accumulation in the extracellular matrix (5). As such, the concentration of macromolecules in the fibrotic intestinal walls, such as collagen, determines the image contrast of MTI (6). The concentration of macromolecules in the bowel walls can be quantitatively reflected indirectly by the MT ratio (MTR) (78). The MTR increases with increasing bowel fibrosis in CD. A high MTR of the affected bowel wall, close to the muscle with the highest MTR in human tissue, indicates severe fibrosis (2). However, a low MTR may be detected in severely fibrotic bowel walls with a similarly low MTR of muscle in some cases due to individual differences. To facilitate the comparison between individual cases, the MTR of the affected bowel wall was divided by the MTR of the muscles on the same image to obtain a normalized MTR to minimize individual variation (39). This normalized MTR also showed a high accuracy in detecting and further stratifying bowel fibrosis in CD (9). However, the approach using MTR or normalized MTR on the pathologic bowel wall to directly assess fibrosis does not take into account the already existing MTR of the normal intestine. It is noteworthy that the MTR of the normal bowel wall increases slightly due to the presence of intestinal smooth muscle (27). However, it remains unclear whether or not including the MTR of the normal intestine could yield a new MTR parameter that may show greater accuracy in evaluating bowel fibrosis. A more accurate parameter for monitoring fibrosis progression will promote research on specific therapeutic strategies for bowel fibrosis. Therefore, the purpose of this study was to establish a new MTR parameter (standardized MTR) that includes the MTR of the normal intestine and to compare its efficacy with those of MTR and normalized MTR in assessing bowel fibrosis in patients with CD.
MATERIALS AND METHODS
Patients
The Institutional Ethics Review Board approved this prospective observational study, and patients with CD who underwent magnetic resonance enterography (MRE) provided written informed consent prior to study participation.
From July 2015 to April 2017, 22 consecutive CD patients who underwent MRE and surgical resection were recruited by the Inflammatory Bowel Disease Center. The inclusion criteria were as follows: 1) patients over 18 years of age with a preoperative diagnosis of strictured CD according to well-recognized clinical, endoscopic, imaging, and histological criteria; 2) underwent conventional MRE examination within 15 days before elective operation; and 3) had matching locations between histological examinations and MRE. The exclusion criteria were as follows: 1) insufficient MTI quality or 2) another concurrent intestinal disease.
MRI Protocol
As described in previous studies (101112), patients took orally administered polyethylene glycol electrolyte dispersion after 6–8 hours of fasting to clean the intestinal tract. Then, 1600–2000 mL of 2.5% mannitol solution was given 1 hour before MRI to fill the small bowel. Next, 10 mg of raceanisodamine hydrochloride (Minsheng Pharmaceutical Group, Hangzhou, China) was injected intramuscularly into the buttock 10 minutes before scanning to inhibit gastrointestinal peristalsis.
All MRE scans were performed using a 3T superconductive MR device (Magnetom Trio; Siemens Healthineers, Erlangen, Germany) equipped with multi-channel phased-array body coils and spinal surface coils. Axial breath-hold MTI was performed using two gradient-echo data sets with and without pre-saturation pulse (frequency offset: 1.2 kHz, duration: 9984 µs, effective flip angle: 500°, bandwidth: 192 Hz, slice thickness: 4 mm). The conventional MRE sequences included axial and coronal breath-hold half-Fourier acquisition single-shot turbo spin-echo T2-weighted (repetition time [TR]: 1200 ms; echo time [TE]: 87 ms; flip angle: 160°; matrix: 320 × 194; slice thickness: 4 mm) and coronal breath-hold fat-suppressed fast low angle shot T1-weighted (TR: 210 ms; TE: 2.18 ms; flip angle: 70°; matrix: 320 × 200; slice thickness: 4 mm) images. After intravenous injection of 0.2 mL/kg gadopentetate dimeglumine (Beilu Pharmaceuticals, Beijing, China) at a rate of 2 mL/s, multiple coronal dynamic contrast-enhanced, fat-suppressed, three-dimensional volumetric interpolated breath-hold examinations (TR: 4.37 ms; TE: 1.37 ms; flip angle: 1°; matrix: 320 × 217; slice thickness: 2 mm) were performed at 15, 40, 65, and 90 seconds from the beginning of the injection.
MRI Analysis
MTRs were calculated using the following equation: MTR = (1 − Msat / M0) × 100%, where Msat and M0 indicate signal intensities acquired with and without off-resonance pre-pulse saturation, respectively (267). MTR maps were produced using an in-house MATLAB script (MathWorks, Natick, MA, USA). The involved bowel segments were marked for region-by-region evaluation by a senior radiologist with 16 years of experience performing intestinal MRI and who was not blinded to the clinical, biochemical, and pathological data. Then, 3 MTR parameters were measured and calculated by a radiologist with 6 years of experience performing bowel MRI and who was blinded to the clinical, biochemical test, and pathological data. Three irregular regions of interest (ROIs) with different sizes were separately drawn on the pathologic bowel walls, normal bowel walls, and the psoas or gluteal muscle with a total of nine ROIs at the same slice. The normal bowel segment was defined as the bowel wall with a thickness of < 3 mm, with an isointensity on T2-weighted and contrast-enhanced images, and without the presence of a lesion in a series of clinical data. Then, the average MTR of every tissue was calculated. The normalized MTR was calculated according to the following equation (39): normalized MTR = MTRpathologic bowel wall / MTRmuscle. Considering the impact of a slight increase in the MTR of the normal bowel wall, we established a new MTR parameter according to the following equation and called this the standardized MTR: standardized MTR = (MTRpathologic bowel wall - MTRnormal bowel wall) / (MTRmuscle - MTRnormal bowel wall). This parameter was expected to eliminate the influence of background MTR of the normal bowel wall and to avoid overestimating the severity of bowel fibrosis. The mean areas of the ROIs in the affected bowel walls, normal bowel walls, and the psoas or gluteal muscle were 97.52 ± 79.42 mm2, 38.51 ± 15.57 mm2, and 405.92 ± 116.61 mm2, respectively.
Intestinal Segment Selection for Corresponding Histological Evaluation and MRI Assessment
Matched assessments between specimens and MRI were performed by a radiologist with 16 years of experience performing intestinal MRI and who was not blinded to the clinical, laboratory, imaging, and histopathological data. Matching locations between the resected bowel segments and MRI were identified using anatomic landmarks (surgically resected margins, ileocecal valve, or appendix) or gross lesions (bowel fistula or adhesion) (9131415). A total of 2–4 specimens were obtained from each patient according to the number of lesions and the extent of the disease.
Histopathological Assessment
The whole specimen was embedded in paraffin after fixing in formalin and cut into slices 4-µm thick. All specimens were stained with Masson's trichrome staining for histologic fibrosis scoring. The histologic slices from areas with the most severe fibrosis were graded from 0–3 using a semi-quantitative scoring system by an experienced gastrointestinal pathologist with 10 years of experience in intestinal pathology and who was blinded to the clinical and imaging information (9161718) (Table 1).
Statistical Analysis
Statistical analysis of the comparisons was performed using SPSS (version 20; IBM Corp., Armonk, NY, USA). A p value < 0.05 was considered statistically significant. Continuous variables were described as means ± standard deviation (normal distribution data) or medians and interquartile ranges (abnormal distribution data), and categorical variables were described as percentages and absolute values. The correlations between the three MTR parameters and fibrosis scores were tested by Spearman's rank correlation. Differences in MTR, normalized MTR, and standardized MTR among diverse histologic fibrosis scores were tested using the independent sample t test or the Mann–Whitney U test according to the data type. The area under the receiver operating characteristic (ROC) curve (AUC) was utilized to test the efficiency of the three MTR parameters in differentiating severe intestinal fibrosis from mild-to-moderate intestinal fibrosis.
RESULTS
Demographic and Clinical Data
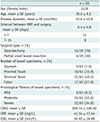
Twenty-two CD patients underwent MRE examination. Two patients, one with unsatisfactory MTI quality and one with a combined carcinoma of the intestine, were excluded. Ultimately, 20 patients (8 males, 12 females; average age: 30.5 ± 9.2 years) with 63 samples met the inclusion criteria and were recruited in this study. Statistically, the mean disease duration was 55.6 ± 45.8 months, and the mean interval between MRI and surgery was 6.4 ± 4.8 days, with 12 patients with an interval shorter than 7 days and 8 patients with an interval between 7 and 15 days. Fourteen (70%) patients underwent ileocolectomy and six (30%) patients underwent partial small bowel resection. In addition, the CD activity parameter was 269.14 ± 100.40, the C-reactive protein level was 41.34 ± 17.44 mg/L, and the erythrocyte sedimentation rate was 36.60 ± 18.98 mm/h.
Histological Assessment
Of the 63 bowel specimens, 46 were from the most strictured segments in the jejunum (n = 5), proximal ileum (n = 10), and terminal ileum (n = 31), and 17 were from colonic lesions. Regarding the histological fibrosis of the 63 specimens, 6 had mild, 35 had moderate, and 22 had severe fibrosis (Table 2).
Comparison of the Efficacies among the Three MTR Parameters for Assessing Bowel Fibrosis
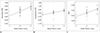
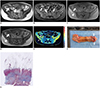
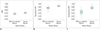
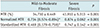
The normalized MTR (r = 0.700; p < 0.001) and standardized MTR (r = 0.695; p < 0.001) showed a strong correlation with bowel fibrosis scores, followed by MTR (r = 0.590; p < 0.001) (Fig. 1). Significant differences in MTR (t = −4.470; p < 0.001), normalized MTR (Z = −5.003; p < 0.001), and standardized MTR (Z = −5.133; p < 0.001) were found between mildly-to-moderately and severely (Fig. 2) fibrotic intestinal walls (Fig. 3, Table 3). Moreover, there was no overlap in the ranges of standardized MTR between mild-to-moderate and severe bowel fibrosis (Fig. 3), demonstrating that standardized MTR was superior to MTR and normalized MTR.
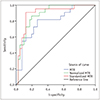
The standardized MTR (AUC = 0.895; 95% confidence interval [CI], 0.807–0.982; p < 0.001) had the highest accuracy in differentiating severe bowel wall fibrosis from mild-to-moderate bowel wall fibrosis, followed by normalized MTR (AUC = 0.885; 95% CI, 0.803–0.966; p < 0.001) and MTR (AUC = 0.798; 95% CI, 0.682–0.914; p < 0.001) (Fig. 4).
DISCUSSION
In this study, we found that the standardized MTR, which was strongly correlated with histologic bowel fibrosis scores and had the highest accuracy in differentiating severe intestinal fibrosis from mild-to-moderate intestinal fibrosis, was an optimal parameter for evaluating the severity of intestinal fibrosis compared with MTR and normalized MTR.
MTI has been reported as a non-invasive method that can be effectively used for assessing intestinal fibrosis in CD patients (7). The quantitative parameters of MTI (MTR and normalized MTR) were both reported to be capable of characterizing the severity of bowel fibrosis in animal or human CD (2379). Our preliminary results and those of other studies showed that a higher MTR or normalized MTR of the thickened intestinal wall, similar to that of the muscle presenting the highest MTR in human tissue, indicated a higher fibrotic composition of the lesion (239). However, in clinical practice, sometimes a relatively higher MTR or normalized MTR might be observed in the normal intestinal wall, which may hinder interpretations of the result. Other physiological macromolecules within the normal bowel wall, such as smooth muscle, would slightly increase the MTR or normalized MTR and would influence the accurate assessment of the severity of bowel fibrosis. This manifestation attracted our attention and provided the idea to include the already existing MTR of the normal intestine during the evaluation process when using MTI to quantitatively assess bowel fibrosis. Given that severe fibrotic bowel stricture leading to intestinal obstruction in CD patients invariably requires surgical excision and that non-severely fibrotic intestinal stricture may be relieved by medical treatment (1), it is of great importance for both radiologists and clinicians to select the most appropriate MTR parameter to evaluate the degree of intestinal fibrosis for guiding an individualized therapy. To minimize differences between individuals and to more accurately diagnose bowel fibrosis, we developed a new parameter (standardized MTR) to quantify the severity of bowel fibrosis and to determine whether standardized MTR was superior to MTR or normalized MTR.
Our study indicated that standardized MTR, MTR, and normalized MTR were able to assess intestinal fibrosis in CD patients. The correlation strength of MTR and normalized MTR with bowel fibrosis in our study was similar to those reported previously (r = 0.74–0.77) (29). As we expected, standardized MTR was one of the two parameters showing a strong correlation with histologic bowel fibrosis score in our study, and it showed the highest accuracy in differentiating severe intestinal fibrosis from mild-to-moderate intestinal fibrosis, when compared with normalized MTR and MTR. It was also noteworthy that there was no overlap in the interquartile ranges of standardized MTRs between mild-to-moderate and severe bowel fibrosis, whereas the other two parameters had overlaps that should be considered when applying them in clinical practice. This result confirmed the ability of standardized MTR to accurately stratify the severity of bowel fibrosis. Moreover, standardized MTR helped to better minimize differences between individuals and was beneficial in comparing between patients with different severities or in the same patient before and after treatment.
There are several limitations in our study. First, a relatively smaller sample of bowel segments with varying degrees of fibrosis were included in this study, and we did not include normal bowel segments, as only bowel segments with severe stricture were likely to be surgically resected. Second, it was difficult to accurately perform a point-by-point comparison of peristaltic bowels on MRI with the histopathologic specimens. Fortunately, by eliminating peristalsis of the bowel and shortening the time interval between the MRI examination and surgery, we believe that this problem was partially solved. Third, bias may have resulted from the absence of intra- or inter-observer variation in ROI selection as the distribution of varying degrees of intestinal fibrosis often shows inhomogeneity. However, we delineated three ROIs on the target bowel wall to reduce this bias.
In conclusion, standardized MTR was superior to MTR and normalized MTR and could be an optimal parameter for the quantitative assessment of the severity of bowel fibrosis in CD patients.

 XML Download