

 PDF
PDF ePub
ePub Citation
 Print
Print


INTRODUCTION
A clinically important facet of dental implantology is the evaluation of implant stability. Of the various methods utilized for measuring implant stability, modal analysis is the most common. One noninvasive method used in the measurement of implant stability involves the use of a damping capacity analysis (DCA) device (Periotest; Medizintechnik Gulden, Modautal, Germany). This device does not require unscrewing of the healing abutment to determine implant stability [1]. However, it does require tapping (16 times) for 4 seconds on the implant suprastructure [2], which may be unpleasant for the patient and inconvenient for the clinician.
Another widely used noninvasive analyzer, a resonance frequency analysis (RFA) device (Osstell ISQ, Integration Diagnostics AB, Gothenburg, Sweden), shows implant stability quotient (ISQ) values on the device's display. ISQ values constitute a near-linear mapping from the resonance frequency to a more clinically useful scale that ranges from 1 to 100 [34]. In clinical situations, an ISQ value greater than 70 is considered to indicate high implant stability for implant loading [5]. Despite its high reliability, RFA has some disadvantages, such as increased chair time, the chance for failed osseointegration caused by unscrewing the healing abutment, and the requirement of a disposable, distinctive transducer [26].
Recently, a modified DCA device (Anycheck; Neobiotech, Seoul, Korea) was developed to measure implant stability. Similar to ISQ, the implant stability test (IST) value, which is the measure of implant stability used by the DCA device, ranges from 1 to 99, with higher values indicating greater implant stability. The tapping motion was improved by reducing the number of tapping sequences to 6 and by discontinuing tapping in cases of weak implant stability. IST values of 1–59 indicate low stability, values of 60–64 indicate moderate stability, and values above 65 indicate high stability. The DCA device also has a safety control system that immediately stops the percussion test if it detects a stability of 59 or lower. During the measurement of implant stability, the patient should be in the upright position, so that the long axis of the implant is perpendicular to the ground. When the device is positioned perpendicular to the long axis of the implant and parallel to the ground, IST can be measured. The device has a control function that stops the percussion test when the angle between the ground and the device is more than 30° in order to reduce the measurement error resulting from an angle that exceeds the allowable measurement.
A previous study showed a significant relationship between insertion torque and ISQ values, but not between insertion torque and measurements made using conventional DCA [7]. It is unknown whether the IST value measured by the modified DCA device and the ISQ value measured by the RFA device are similar, nor is it known whether these measurement techniques can be used to detect similar patterns given various levels of implant stability. Therefore, the reliability of this device should be investigated further to confirm that the modified DCA device produces valid results. The aim of this study was to evaluate the sensitivity and reliability of implant stability measurements made of ex vivo samples using the modified DCA device under various implant stability conditions in comparison with those obtained using the RFA device.
MATERIALS AND METHODS
Implant design
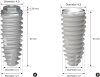
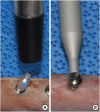
To create samples for which the ISQ and IST results would range between 1 and 100, 108 external-connection dental implants (EB II active, Neobiotech, Seoul, Korea) and 108 internal-connection dental implants (IS II active, Neobiotech) were used in this experiment. The length of each of the 2 types of implants was 10 mm. The diameter of the coronal portion of the dental implants was 4.0 mm for the external implants and 4.3 mm for the internal implants (Figure 1).
In vitro specimen preparation
We selected 36 pork ribs obtained from a butcher's shop; the ribs were taken from pigs that were approximately 6 months old. The inclusion criteria for the ribs were as follows: 1) more than 15 mm in length and 6 mm in width; 2) presence of approximately 1.5–2 mm of cortical bone, which is similar to D2 bone according to the Lekholm and Zarb classification [8].
The most proximal region of the rib was excluded to avoid including D3 or D4 bone (Figure 2). The rib was fixed using a fixing vise parallel to the ground for improved stabilization when measuring the IST and ISQ values.
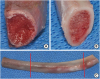 | Figure 2Bone type standardization. (A) Most of the proximal area showed D3- or D4-type bone morphology. (B) To obtain D2-type bone with approximately 1.5–2 mm of cortical bone, (C) the proximal bone area was cut along the red solid line.
|
Three drilling techniques were used to achieve a variety of implant stability conditions. Six implant beds were prepared in each rib using the following drilling protocols: 1) 10-mm final drilling depth with a 3.5-mm-diameter twist drill; 2) 5-mm final drilling depth with a 4.0-mm-diameter twist drill; 3) 10-mm final drilling depth with a 4.0-mm-diameter twist drill.
The final drilling sequence was assigned according to a computer-generated randomized list and performed by an independent researcher (J-S.A) not otherwise involved in this experiment. Implants were placed in the preparation bed following the final drilling sequences using a motor unit (EXPERTsurg, KaVo, Biberach, Germany) at 20 rpm and a maximal insertion torque of 50 N·cm. The peak insertion torque (PIT) was recorded from the display of the surgical unit.
The principles of implant stability calculation
RFA
To measure implant stability using RFA, a transducer must be connected to the dental implant. The RFA device requires a magnetic peg (Integration Diagnostics AB), which is fixed to the implant fixture or abutment by a screw beneath it. When the magnetic resonance frequency is emitted from the probe, the magnetic peg is activated. The activated peg begins to vibrate, the magnet exposes the probe coil to an electric voltage, and the voltage is sampled by the magnetic RFA. After vibration of the transducer, a piezo-element is excited with a sinusoidal signal, which is detected by the analyzer [9].
DCA
When the metal rod of the DCA device strikes the surface of the implant, it is immediately decelerated, and kinetic energy is delivered to the implant. The harder the implant and surrounding tissues, the faster the deceleration. This is detected by an accelerometer located on the metal rod, and the stability of the implant is evaluated by analyzing the contact time of the rod.
The contact time is measured depending on the degree of osseointegration of the dental implant and the bone located below the target, which is typically a healing abutment. The modified DCA device works the same way as conventional DCA, but differs in the method by which it indicates implant stability. The software in the device presents the values in relation to the contact time. The conventional DCA device displays values ranging from −8 to +50, while the modified DCA device presents values ranging from 0 to 100. If the contact time were long due to low implant stability, the Periotest value would be high as measured by the conventional DCA device, while the IST value would be low as measured by the modified DCA device.
Implant stability measurements
Before implant stability measurements were made, the rib bone was firmly fixed to a vise. The RFA measurement was performed by another prosthodontist (J-H.L), who was blinded to the drilling protocol. Two types of magnetic pegs, termed Smart pegs, were used for measuring RFA: type 1 for external implants and type 5 for internal implants. The magnetic pegs were tightened manually with a plastic mount. The measurement was performed using an electronic resonance frequency analyzer (Osstell ISQ) (Figure 3A) at a distance of 1 mm from the transducer perpendicular to the long axis in 4 directions (medial, distal, ventral, and dorsal) (Figure 4A). Measurements were performed twice at 1-hour intervals to verify intraexaminer reliability.
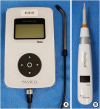 | Figure 3Implant stability analysis devices. (A) Resonance frequency analysis device. (B) Damping capacity analysis device.
|
 | Figure 4Implant stability testing. (A) With a resonance frequency analysis device. (B) With a damping capacity analysis device.
|
After RFA measurements were made, healing abutments (4.5×4 mm for the external implants and 4.5×4 mm for the internal implants) were connected to the implant fixture. Next, a modified DCA device (Anycheck; Neobiotech) (Figure 3B) was used to measure implant stability. The measurement was performed perpendicular to the long axis in 4 directions (medial, distal, ventral, and dorsal), as for the previous device (Figure 4B). Measurements were conducted twice at a 1-hour interval to verify intraexaminer reliability.
A Periotest® handpiece (Periotest®; Siemens AG, Bensheim, Germany) was mounted on a 3-arm clamp and firmly screwed on a vertical stand. For maximum control, the stand position was secured to the bench. The handpiece sleeve was set at a fixed distance from a flat surface of the hexagon and centered perpendicularly to the long axis of the implant.
Implant removal torque
After implant stability was measured, the implants were removed with a motor unit set at 20 rpm and a maximum insertion torque of 50 N·cm in the counterclockwise direction. The peak removal torque (PRT) shown on the display of the surgical unit was recorded.
Statistical analyses
The sample size was calculated using G*Power version 3.1 (Heinrich Heine Universität Düsseldorf, Düsseldorf, Germany; http://www.gpower.hhu.de). The α value was set at 0.05, and the statistical power was set at 0.90. The effect size was calculated based on a previous study that demonstrated that the Pearson correlation coefficient between PIT and ISQ was 0.86 [10]. Although the sample size was calculated to be 32 for each group, 36 implants were placed in each group because 6 implants were placed in each rib.
SPSS version 19.0 (IBM Corp., Armonk, NY, USA) was used for statistical analysis of the results. Intraexaminer reliability was evaluated using the intraclass correlation coefficient (ICC). The differences between the first and second measurements in each direction (medial, distal, ventral, and dorsal) were analyzed using the Cronbach alpha coefficient. The ICC values were considered to indicate poor, moderate, good, or excellent reliability when the values were less than 0.5, between 0.5 and 0.75, between 0.75 and 0.9, or more than 0.9, respectively [1112]. To identify an optimization model to describe the correlations between PIT and ISQ, PIT and IST, PRT and ISQ, and PRT and IST, a curve-fitting tool was used in SPSS and Excel 2016 (Microsoft, Redmond, WA, USA). The agreement between the 2 implant stability measurements was evaluated with a Bland-Altman analysis using Excel 2016. The level of significance was set at 95% (P<0.05).
RESULTS
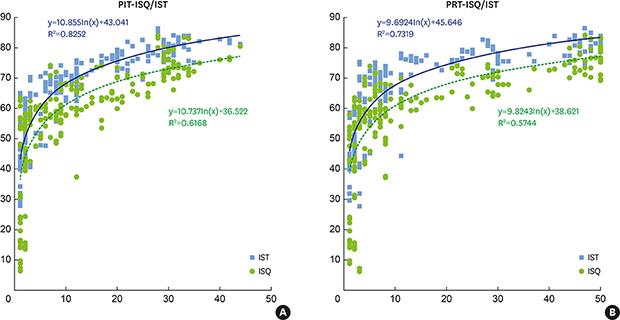
The PIT, PRT, and implant stability measurements from the 2 devices are summarized in Table 1. The mean PIT values in the groups with a 10-mm final drilling depth with a 3.5-mm-diameter twist drill, a 5-mm final drilling depth with a 4.0-mm-diameter twist drill, and a 10-mm final drilling depth with a 4.0-mm-diameter twist drill were 25.53 N·cm, 3.33 N·cm, and 1.50 N·cm, respectively, for the external implants and 31.28 N·cm, 11.56 N·cm, and 7.75 N·cm, respectively, for the internal implants. The corresponding PRT values were 32.44 N·cm, 3.28 N·cm, and 1.50 N·cm, respectively, for the external implants and 41.44 N·cm, 8.00 N·cm, and 5.81 N·cm, respectively, for the internal implants. The corresponding ISQ values were 65.59, 53.52, and 34.97, respectively, for the external implants and 75.10, 62.66, and 54.75, respectively, for the internal implants, while the corresponding IST values were 78.23, 57.45, and 44.06, respectively, for the external implants and 79.66, 71.21, and 60.54, respectively, for the internal implants.
Table 1
Summary of PIT, PRT, ISQ, and IST values

The implant beds were prepared using 1 of the following 3 drilling protocols: 3.5 drilling group, a 10-mm final drilling depth with a 3.5-mm-diameter twist drill; 4.0 half drilling group, a 5-mm final drilling depth with a 4.0-mm-diameter twist drill; and 4.0 full drilling group, a 10-mm final drilling depth with a 4.0-mm-diameter twist drill, respectively.
PIT: peak insertion torque, PRT: peak removal torque, ISQ: implant stability quotient, IST: implant stability test, SD: standard deviation.
![]()
The ICCs of the ISQ values at the medial, distal, ventral, and dorsal points of the implants were 0.997, 0.994, 0.994, and 0.998, respectively. The ICC values of the IST at the medial, distal, ventral, and dorsal points were 0.972, 0.975, 0.974, and 0.976, respectively.
Regression analyses between PIT and ISQ, PIT and IST, PRT and ISQ, and PRT and IST using the curve fitting tool are presented in Table 2. Among the linear, logarithmic, power, S, growth, and exponential models, the logarithmic model showed the best fit. The correlations between PIT and the 2 implant stability values (ISQ and IST) are presented in Figure 5A. The relationships between PRT and the two implant stability values are presented in Figure 5B.
Table 2
Results of curve-fitting estimation for PIT-ISQ, PIT-IST, PRT-ISQ, and PRT-IST

PIT: peak insertion torque, ISQ: implant stability quotient, IST: implant stability test, PRT: peak removal torque.
![]()
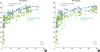 | Figure 5Nonlinear regression model. The ISQ and IST values showed a logarithmic relationship with (A) PIT and (B) PRT.ISQ: implant stability quotient, IST: implant stability test, PIT: peak insertion torque, PRT: peak removal torque.
|
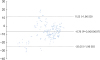
To analyze the agreement between the RFA and modified DCA methods, a Bland-Altman plot was constructed and is shown in Figure 6. The mean absolute difference between the ISQ and IST values was −6.76 (−25.05 to 11.53, P<0.05).
DISCUSSION
The purpose of this study was to evaluate the sensitivity and reliability of the modified DCA device and to compare these values with those obtained using the RFA device. Implant stability was repeatedly recorded with 2 devices to evaluate intraexaminer reliability. A previous study analyzing ISQ values obtained using the Osstell device showed excellent intraexaminer reliability, ranging from 0.91 to 0.98 [13], and similar results were obtained in the present study. Likewise, the ISQ values obtained using the RFA device and the IST values obtained using the modified DCA device showed excellent intraexaminer reliability. With clinical validation, both methods may be useful for the evaluation and monitoring of implant stability.
In the present study, higher PIT and PRT values were observed for the internal implants than for the external implants. This can be explained by the different diameters of the 2 implant systems, as shown in Figure 1. The internal implants with larger diameters for the coronal and apical portions showed higher PIT, PRT, ISQ, and IST values (Table 1).
Studies have demonstrated that the conventional DCA device could be influenced by the position and direction of tapping [714]. However, in the present study, the modified DCA device was not influenced by such excitation conditions. This can be explained by the overfitting effect, which essentially means that too much tapping on the implant leads to errors in measuring implant stability when using a conventional DCA device. By reducing the number of tapping sequences and stopping the tapping motion entirely if the implant shows poor stability, errors appear to be reduced.
With the curve fitting tool, logarithmic relationships between PIT and IST, PIT and ISQ, PRT and IST, and PRT and ISQ were observed in this study. Previous studies did not compare those parameters for the evaluation of ranges of implant mobility [15161718]. Most of those studies were conducted in a stable setting with more than 20 N·cm of insertion torque, which may explain the contradictory results regarding the relationships between those parameters. To identify the relationships between these variables, we constructed 3 different drilling sequence models to produce different levels of implant stability. By doing so, we could scrutinize nonlinear relationships that were not observed in the previous studies. The IST and ISQ values steeply increased as the PIT and PRT increased below 10 N·cm. However, the IST and ISQ values increased only gradually beyond that threshold.
In the present study, we performed a Bland-Altman analysis to compare the reliability of the 2 measurements. No significant difference was found between the IST and ISQ values. Previous studies have demonstrated a significant correlation between DCA and RFA in measurements of implant stability [19]. Based on our results, IST values obtained using the modified DCA device may be usable for evaluating implant stability.
The key limitation of this study is the lack of consideration of confounding factors. Bone quality, implant geometry, and thread exposure could affect implant stability measurements [202122]. Further research regarding confounding factors in measurements of implant stability using a modified DCA device is warranted. Furthermore, differences in implant stability should be determined in preclinical and clinical studies to evaluate the clinical validity and accuracy of these measurement techniques.
 XML Download