

 PDF
PDF ePub
ePub Citation
 Print
Print


INTRODUCTION
The maxillary sinus is a bilateral structure located in the midface of the skull. The inferior borders of the maxillary sinus, which are composed of thin cortical bone, may sometimes undergo dehiscence of bone [1]. The close proximity of the maxillary root with the antrum often leads to complications such as the spread of infection from the maxillary tooth root apex, the pushing of canal filling material through the apical foramen, or the formation of an opening into the maxillary sinus after tooth extraction or implant surgery [2]. Thus, information about the relationship between the roots of maxillary molars and the maxillary sinus floor is an important issue to consider for the treatment of the maxilla in dentistry [234].
Numerous and diverse previous studies have been conducted to assess the relationship between the maxillary teeth and sinuses in different populations, using panoramic radiographs, computed tomography (CT), or human cadavers [56789]. Because of methodological differences among studies, there has been variation in classification systems and standard references. According to the previous studies, cone-beam computed tomography (CBCT) is considered to be a suitable modality for the sophisticated assessment of the degree of furcation involvement and root proximity, root fusion, and measurements of bone height [1011].
Currently, implant treatment is widely performed in dentistry. In particular, immediate implantation is becoming more common after tooth extraction since some studies have reported that there was no significant difference in the survival rate between immediate implantation and conventional delayed implantation [812]. Thus, several studies focused on assessing the residual alveolar bone height after tooth extraction, because that information was considered to be an essential factor for successful implant placement [131415].
Since the root divergence of the maxillary molar determines the clinically available interradicular bone [16], it may be worthwhile to present data on the relationship between the morphological variation of the root and the residual alveolar bone. However, the accuracy of linear measurements in CBCT is affected by various factors, such as patient's head position, the clinician's skill, and image angulation [1718]. Therefore, we performed bone height measurements on reconstructed cross-sectional images made by the reorientation of the original images along the occlusal plane to obtain accurate and reproducible results.
In this paper, the relationship between the maxillary sinus and molars was categorized based on notable anatomical features, and the available alveolar bone height from the root furcation to the sinus floor was measured and analyzed according to each classification on CBCT images from a clinical point of view.
MATERIALS AND METHODS
Ethical approval of the study and informed consent
This study was approved by Institutional Review Board of Yonsei Dental College Hospital (No. 2-2018-0049), and the requirement for patient consent was waived because of the retrospective nature of the study.
Subjects
CBCT scans of the maxilla taken from June 2016 to March 2018 at the Department of Oral and Maxillofacial Radiology were reviewed. In total, CBCT scans from 188 patients were selected according to the inclusion criteria described below. The age of the patients ranged between 17 and 79 years (mean age: 30.68 years), and there were 70 males and 118 females.
The inclusion criteria consisted of 1) patients older than 17 years with fully erupted maxillary first and second molars; 2) 4 maxillary molars that were completely erupted and had no specific radiologic findings, with ectopic eruption in the field of view; 3) maxillary molars without any pathologic findings, such as periapical lesion, chronic periodontitis with furcation involvement or apical involvement, or root resorption; 4) a sound maxilla and alveolar crest without any history of previous disease of the sinus or jaw bone or implant surgery; 5) no malocclusion impeding the detection of the furcation midpoint; 6) images of sufficient quality to be evaluated without problems caused by metal artifacts, blurring, and motion artifacts.
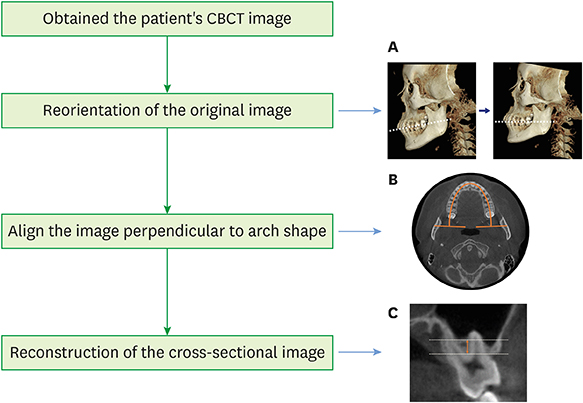
Figure 1 presents the overall workflow of this study. All CBCT images were obtained with an Alphard 3030 device (Asahi Roentgen Ind. Co., Ltd, Tokyo, Japan) with the following exposure conditions: tube voltage, 80 kVp; tube current, 8 mA; exposure time, 17 seconds; field of view, 15.4×15.4 cm; and voxel resolution, 0.3 mm. The original data were reoriented along the occlusal plane, which was set parallel to the floor plane, and cross-sectional images were reconstructed perpendicular to the arch shape that was aligned at the cervical level of the maxillary molars using OnDemand3D software (Cybermed Inc., Seoul, Korea).
Figure 1
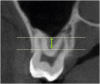
Overall flowchart of image reconstruction for reproducible measurements of the available alveolar bone height. (A) The occlusal plane of the original data was reoriented to be parallel to the base plane. (B) The CBCT image was aligned to be perpendicular to the arch shape at the cervical level of the maxillary molars. (C) Reconstruction of the cross-sectional image.
CBCT: cone-beam computed tomography.
Classification and measurements
One oral and maxillofacial radiologist and one general dentist with over 5 years of experience examined CBCT images on a monitor (21.3 inches, resolution: 1,260×2,048 pixels; Totoku® Electric, Nagano, Japan). They examined a total of 752 maxillary first (M1) and second molars (M2) on CBCT scans of 188 patients according to the root protrusion into the maxillary sinus, which was categorized into four types. Furthermore, type 3 of root protrusion was divided into 4 subtypes. Both observers could use the OnDemand3D software to control the brightness and contrast. The classification was determined using the following criteria (Figure 2), with the consensus of both observers.
Figure 2
Illustrations of the classification of the relationship between the maxillary molars and the sinus floor.

Type 1: The apex of all roots is located in contact with or inferior to the lowest border of the maxillary sinus floor.
Type 2: The diverged buccal and palatal roots envelop the sinus.
Type 3: One or more root is protruding into the maxillary sinus.
A – Only the buccal root is protruding into the sinus.
B – Only the palatal root is protruding into the sinus.
C – All roots are protruding into the sinus.
D – A fused root is protruding into the sinus.
Type 4: All roots are leaning to the buccal or palatal side of the maxillary sinus.
Two observers independently measured the shortest vertical distance (VD) on CBCT cross-sectional images. Before the measurement, the furcation midpoint was defined as the center of the radiolucent line to distinguish mesiobuccal roots from distobuccal roots on the location of the furcation on 3-dimensional, cross-sectional, and axial images based on the consensus of the observers. The VD measurements were made from the furcation midpoints of M1 and M2 to the lowest point of the sinus floor using the software. A line connecting the center of the tooth cervical level in the axial plane parallel to the occlusal plane was reconstructed, and the VD was measured by drawing a line from the furcation midpoint perpendicular to the baseline (Figure 3). All teeth with fused roots were excluded from the VD measurements. All linear measurements were performed twice with an interval of 2 weeks to assess intra- and inter-observer differences.
Statistical analysis
The frequency distribution of each classification of the relationship between the sinus and the molars was analyzed. The intra-class correlation coefficient (ICC) was calculated to assess inter- and intra-observer reliability with a 95% confidence interval (CI) for VD measurements, and the independent and paired t-tests were performed to analyze differences according to sex and side, respectively. Statistical analyses of the data were performed using SPSS version 23.0 for Windows (IBM Corp., Armonk, NY, USA).
RESULTS
Analysis of classification
For M1, type 3 (with one or more root tip encroaching into the sinus floor) showed the highest frequency (44.4%), type 2 (with the root tip contacting the sinus floor) showed the second highest frequency (35.9%), and type 1 (with root tips below the sinus floor) showed the third highest frequency (19.7%). For M2, type 3 was also the most common (41.5%), but unlike M1, type 1 was the next most frequent category (31.1%). Type 4 was the least frequent category in both M1 and M2 (Table 1).
Table 1
The frequency of types of relationships between the maxillary molars and the maxillary sinus

| Tooth | Type 1 | Type 2 | Type 3 | Type 4 |
|---|---|---|---|---|
| M1 | 74 (19.7) | 135 (35.9) | 167 (44.4) | 0 |
| M2 | 117 (31.1) | 88 (23.4) | 156 (41.5) | 15 (4.0) |
| Total | 191 (25.4) | 223 (29.7) | 323 (43.0) | 15 (2.0) |
Figure 4 shows the frequency distribution of types of relationship by sex in M1 and M2. For M1, type 3 was the most frequent in males and females (51.43% and 40.25%, respectively). Although type 3 was the most common type in M1 in females, the frequency difference was slight compared with type 2 (38.56%), which showed the next highest frequency. For M2 in males, type 3 was observed the most frequently (52.14%), followed by type 1 (22.86%). However, in females, types 1 and 3 showed a nearly even distribution (36.02% and 35.17%, respectively), which was not a significant difference. Type 4 was not observed in M1 and was rare in M2 (3.99%).
Figure 4
The frequency distribution of the classification in the maxillary first molars (A) and second molars (B).

The root protrusion was evaluated for each type 3 root, and it was found that protrusion of all roots was the most common pattern in M1, while buccal root protrusion was most common in M2 (Table 2).
Table 2
Distribution of subtypes of type 3 (with at least one root protruding into the maxillary sinus)

Analysis of VD measurements
The intra- and inter-observer ICC values of the VD measurements were 1.000 (95% CI, 1.00–1.00) and 0.977 (95% CI, 0.971–0.981), respectively. The mean and standard deviation of the shortest vertical distance according to tooth and type are presented in Table 3. For M1, the mean VD of type 1 was the longest (9.51±3.68 mm) and that of type 3 was the shortest (3.70±1.52 mm). For M2, the mean VD of type 1 was slightly shorter than that of M1 (8.07±2.73 mm). The mean total VD was 5.48±3.02 mm and 5.62±2.56 mm in M1 and M2, respectively.
Table 3
Mean values and standard deviations of the shortest vertical distance from the furcation midpoint to the sinus floor according to the relationship between the maxillary molars and the maxillary sinus

| Tooth | Type 1 (mm) | Type 2 (mm) | Type 3 (mm) | Type 4 (mm) | Total (mm) |
|---|---|---|---|---|---|
| M1 | 9.51±3.68 | 5.46±1.51 | 3.70±1.52 | - | 5.48±3.02 |
| M2 | 8.07±2.73 | 5.49±1.28 | 4.03±1.53 | 4.04±1.35 | 5.62±2.56 |
For M1, there was no statistically significant difference between males and females. In contrast, for M2, the VD measurements in females were significantly higher than those in males difference (P<0.05, independent t-test). No significant differences in the VD measurements were observed between the right side and left side for either M1 or M2 (P<0.05, paired t-test) (Table 4).
Table 4
Differences in the mean vertical distance between the maxillary molars according to sex and side

DISCUSSION
The maxillary sinus is located within the body of the maxillary bone, and it is the first of the paranasal sinuses to develop. The floor of the antrum is involved in maxillary tooth eruption, and the roots of the molar often form a conical elevation expanding into the sinus [1]. The degree of protrusion of the maxillary root apices into the lumen varies according to an individual's age and the size and the degree of pneumatization of the maxillary sinus [7]. A histological study showed that the maxillary molar roots that protrude radiographically into the sinus are actually enveloped by a thin cortical layer with a risk of perforation [9]. However, there is occasionally dehiscent bone over the molar roots, so that only the sinus mucosa covers these roots, separating them from the main sinus lumen [1]. These factors contribute to considerable variation in the anatomy of the maxillary sinus floor.
The diagnostic information obtained from panoramic radiographs is limited because of inherent drawbacks of the images, such as distortion, magnification, artifacts, blurring, and superimposition of structures [19]. Sharan and Madjar [9] reported that only 39% of cases of root protrusion observed on panoramic radiography were found to actually correspond to inserted roots on CT images.
Dental CBCT has the advantage of providing 3-dimensional information, similarly to CT, but at a low cost and with low radiation exposure [20]. Thus, the use of reconstructed CBCT images has been recommended for diagnostic purposes in dentistry, and especially for implant surgery [82122]. Several researchers [2324] have studied bone height on reconstructed CBCT images and suggested that a short alveolar bone height of the maxilla may increase the possibility of complications, such as sinusitis, penetration, and oroantral fistula, during surgical procedures. However, since the vertical dimension of a cross-sectional image is affected by the patient's head position during X-ray imaging and by the angle of the CBCT image, software-based correction is required to reorient structures to be parallel to the baseline [17]. To address this issue, we have designed a system to perform reorientation of the original data and to create cross-sectional images perpendicular to the curve of the arch, and by doing so, we obtained accurate and reproducible alveolar bone height values. In particular, measurements of the available alveolar bone height according to the relationship between the molar and the maxillary sinus could provide valuable anatomical information for immediate implant placement planning.
A notable result of this study was that type 3 (with at least one root protruding to the sinus floor) was the most common relationship for the first and second molars, at 44.4% and 41.5%, respectively. This is a higher rate than has been reported in previous studies. For instance, in a study of 50 patients, Pagin et al. [25] reported that 21.6% of roots had intimate contact and that 14.3% of roots protruded into the maxillary sinus floor. In an evaluation of 848 Chinese patients using CBCT, Tian et al. [6] suggested that most maxillary molar roots were located below the border of the maxillary sinus floor. The discrepancies among these results are hypothesized to be due to racial differences in the anatomical shapes of teeth and the maxillary sinus. Therefore, more research is needed on positional relationships in diverse populations to use for predicting clinical outcomes.
We divided type 3 into 4 subgroups according to the root position relative to the antrum. For the first molars, it was most common for both buccal and palatal roots to protrude into the maxillary sinus with no root fusion. Meanwhile, the buccal root of the second molars was frequently involved in the sinus, and root fusion was observed in 11.5% of cases. Liu et al. [12] reported there were no fused roots in the first molar, similarly to the present study, however, the frequency of fused roots in the second molar was higher than in Koreans, at 20.5%. These findings could be helpful for preventing complications from endodontic treatment or surgical extraction, as well as implant surgery.
Immediate implant surgery has become accepted, despite initial controversies, and the literature contains consistent reports of high levels of success, ranging from 94% to 100% on average [2627]. For this treatment strategy, it is essential to obtain data about the morphological characteristics of the residual alveolar ridge and the quantity of available bone before extracting when planning an immediate implant operation. A minimum of 5 mm of residual bone height is recommended for achieving primary stability of the implant [228]. In this study, type 3, which was most common, showed the least alveolar bone height, at 3.70±1.52 mm and 4.03±1.53 mm in the first and second molars, respectively, which was found to be less than the minimum standard. Therefore, morphological information of the root should be considered in the implant treatment plan.
In particular, the alveolar bone height of the first molars was slightly shorter than that of the second molars. The values of males were found to be shorter than those of females in both the first and second molars, and this difference was statistically significant for the second molars. Meanwhile, there were no significant differences in alveolar height measurements between the right and left sides. This result is consistent with research showing that for the most part the maxillary sinuses develop symmetrically, with only minor common variations [1].
In conclusion, type 3 (with at least one root protruding into the maxillary sinus) was found to be the most frequent anatomical relationship, and its alveolar bone height was the smallest among the four types. The alveolar bone height from the root furcation to the sinus floor was higher in females than in males, and the height of the first molars was shorter than that of the second molars in females. Anatomical information about the maxillary molar and the sinus can be helpful for planning implant placement.
 XML Download