

 PDF
PDF Citation
 Print
Print


INTRODUCTION
Big data has begun garnering attention and is now widely used in many areas of society.1 In an attempt to keep abreast with these advances and to promote health, the Korean government has granted access to health utilization information by researchers in the private and public sectors since 2015. This was possible only because Korea adopted a single health insurance system known as the National Health Insurance Service (NHIS). Korea is a prime example of a country in which the entire population is enrolled in a single health insurance system.
The Health Insurance Review and Assessment (HIRA) database stores all data from the NHIS and has provided access to these data to healthcare professionals for research purposes since 2015. Researchers (e.g., physicians, nurses, medical technicians) can access health utilization data from individuals who are registered in the NHIS.1 With the preventive medicine and neurology departments at the forefront, there are many ongoing studies in the medical field utilizing this data.23 Facial fracture analysis is another field that could benefit greatly from this data.
The face is the most conspicuous part of the human body. For this reason, a defect in the facial bones critically undermines a person's quality of life. There are significant negative social and functional impacts related to facial trauma and scarring.4 In cases of facial trauma, a patient's physical appearance needs to be recovered to pre-accident conditions via surgery, which is both time-consuming and costly.5
Identifying and predicting trends in facial fractures would promote health, ultimately boosting quality of life. Accurately understanding and predicting potential facial fractures would undoubtedly be a valuable accomplishment from incorporating big data into medicine.
To date, studies on facial fractures have been retrospective studies in single hospitals and single departments.678 There have also been studies that have analyzed the trends in facial fractures within a region by combining data from medical institutions within the region.
The big data provided by HIRA contains data from nearly all Korean populations enrolled in the NHIS. We aimed to identify the incidence of facial fracture and its trends in Korea using this big data from HIRA. It will be the first study using and analyzing the database of almost all populations. Therefore, it can be more accurate than other studies about the incidence of facial fractures in Korea.
METHODS
Data extraction
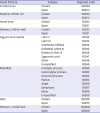
Billing statement identification codes for all patients who received healthcare services because of facial fractures in Korea between January 2010 and August 2017 were obtained from HIRA. The billing statement identification code contains the patient ID and diagnosis code, showing when a specific patient received healthcare services and for what type of facial fracture. Korean Standard Classification of Disease and Cause of Death (KCD) 6 was implemented in 2011 and has been revised to KCD 7 in 2015. KCD 7 is almost identical to KCD 6 in terms of facial fracture categories. Therefore, we used the KCD 6 and 7 for diagnosis codes (Table 1). The billing statement also contained information regarding gender and age, which enabled researchers to conduct gender-and age-specific analyses.
Table 1
Diagnosis codes for facial fractures based on KCD 6, 7
Data processing
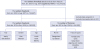
A total of 83,014,212 billing statements were obtained from HIRA. KCD 6 was implemented in 2011; therefore, we excluded data from the year 2010, as there were many omitted or newly created diagnosis codes compared to those in KCD 5. Data from January 2017 to August 2017 were also excluded because they were incomplete. To prevent duplicate counting of patients who received several treatments for the same diagnosis code, we only included the earliest hospital utilization data for a single facial fracture for each individual to calculate the incidence of the corresponding facial fracture in the corresponding year. As a result of this process, a total of 582,318 patients were included in the final analysis (Fig. 1).
Data analysis
We analyzed the number of facial fractures by year, month (season), age, gender, and type of fracture. We divided age groups into three groups: youth, adult, and elderly. The upper limit of the youth group was set to 19 years, the age that generally marks the end of growth. The youth group was further divided into infantile (0–2 years), child (3–12 years), and adolescent (13–19 years). The adult and elderly groups were divided at 60 years of age, based on the judgment that differences in activity according to employment status has a substantial impact on facial fractures. We performed a cross-tabulation analysis using the gender-specific number of facial fractures in a given year, as well as yearly man and woman populations shown in the annual health insurance statistics report. Facial fractures were classified into nasal bone fractures, orbital fractures, frontal sinus fractures, maxillary fractures, mandibular fractures, and nasoorbitoethmoid fractures. Orbital fractures were further divided into medial wall, inferior wall, and superior wall fractures.8910 Maxillary and mandibular fractures were classified on the basis of the diagnosis codes for comparison.
Age groups were compared after standardization because the population distribution varied across age groups. Standardization was performed using the 2011–2016 annual health insurance statistics reports published by the NHIS according to the following equation: number of patients in a given year/total population of the age group in given year × 100,000. It meant the incidence in a given year per 100,000 populations.
Statistical analysis
All statistical analyses were performed using SAS software (SAS Institute INC, Cary, NC, USA) and SPSS (IBM Corporation, Armonk, NY, USA) software. To determine whether the incidences of fractures differ seasonally, analysis of variance was performed using monthly data. Finally, gender-specific differences in incidences of fractures were investigated using χ2 tests.
RESULTS
Incidence of fractures by year
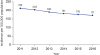
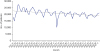
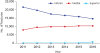
The incidence of facial fractures per 100,000 populations had decreased consistently, from 212 in 2011 to 171 in 2016 (Fig. 2).
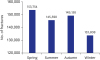
Incidence of fractures by month and season
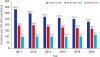
Fractures by age group
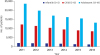
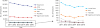
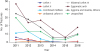
By age group, the youth group accounted for 31.0% of all fractures, while the adult and elderly groups accounted for 59.7% and 9.2%, respectively. The number of patients was the highest in the adult group and lowest in the elderly group (Fig. 5). After standardization, the incidence was found to occur most frequently in youth, followed by the adult group. The number of patients in the elderly population is the lowest, but it is increasing every year, and after standardization, there is a significant increase in annual incidence (Fig. 6).
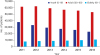
Fig. 6
Incidence per 100,000 population by age groups. Number of patients in a given year/total population of the age group in given year × 100,000.
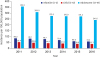
The youth group was further divided into infant, child, and adolescent groups, and the number of patients was the highest among adolescents (Fig. 7). After standardization, facial fractures most frequently occurred in the adolescent group, followed by the infantile group. In the infantile group, the total number of patients was below 2,000 cases per year, which was lower than other age groups. All three groups showed a declining trend of facial fractures annually (Fig. 8).
Fractures by gender
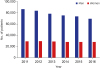
In a six-year study period, a total of 582,318 cases of patients were diagnosed, with 425,265 men patients and 157,053 women patients (Fig. 9). Both the number and percentage of fracture cases were higher among men than among women. The incidence of facial fractures declined in both gender over the six years. However, the percentage of fractures in woman patients rose (P < 0.001).
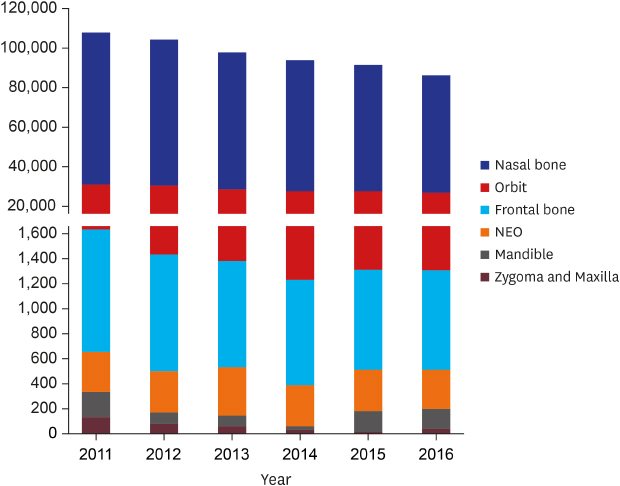
Fractures by facial area
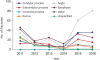
Nasal bone fractures were the most common, followed by orbital and frontal sinus fractures. The percentage of nasal bone fractures declined, whereas those of orbital wall fractures increased from 2011 to 2016 (P < 0.001) (Fig. 10). Among orbital wall fractures, inferior wall fractures were the most common, followed by medial wall fractures (Fig. 11). Among mandibular fractures, angle fractures were the most common, followed by condylar process and symphysis fractures (Fig. 12). The incidence of zygomatic and maxilla fractures had decreased since 2011 (Fig. 13).
DISCUSSION
The authors analyzed the data of 582,318 patients among 83,014,212 medical uses related to facial fractures and found the following results.
The number of facial fractures consistently declined over the years, from 107,695 cases in 2011 to 87,306 cases in 2016. There was no clear monthly trend; however, the number of fractures tended to increase from January to June, and the number was the highest in the spring season. By gender, both men and women showed decreasing trend, but the proportion of women was relatively increased. The number of facial fractures was higher in order of adult, youth and elderly, but after standardization, the most frequent was youth group. The elderly population had the lowest incidence of fractures but increased annually. Nasal bone fractures were the most common, accounting for 70.9% of all fractures, followed by orbital wall fractures, 28.3%.
While the population of Korea is growing gradually, the incidence of facial fractures is decreasing. With standardization, the age group with the highest incidence of facial fractures was the youth group, presumably because this age group is more active and is more careless than other age groups. It was interesting that the incidence in the elderly group is increasing annually. This represents the fact that with the aging society, the elderly people's social and outdoor activities increase, and therefore there are higher risks of their facial fractures as well as the overall number of fractures. Thus, we should prepare for preventing facial fractures in elderly individuals for economizing national health costs. The growing percentage of women facial fractures may be related to the rising level of social activity on the part of women. By season, incidence of fracture was the highest in the spring, which is a season in which outdoor activity increases.
Another value of this study is analysis of detailed facial fractures. We found that the percentage of nasal bone fracture is diminishing, while that of orbital wall fractures is rising. Among the orbital wall fractures, inferior wall fracture was the most common, followed by medial wall fracture, while the number of fractures increased in medial wall and decreased in inferior wall.1112131415 In mandibular fractures, angle fracture was the most common in this study, and fracture in other regions did not show any significant difference. This result differed from the previous reports in which condyle fractures were the most common.16 In zygomatic and maxilla fractures, we could not find any dominant subtype fracture.
The main reason for this detailed analysis about subtype of facial fractures is the popularization of CT. The increase in CT imaging and the expansion of insurance benefits contribute to the accuracy of the diagnosis. In terms of diagnostic codes, the KCD was also changed from 5 to 6 with reference to changing from The International Statistical Classification of Diseases and Related Health Problems 9 to 10. Although KCD 6 and 7 make it possible to classify facial fractures in more detail, past KCD 5 was inadequate.
The results obtained from big data depend on the method used. In this paper, we only included the earliest health service utilization for each individual to calculate the number of fractures in the corresponding year in order to prevent duplicate counting of fractures for the same individual in cases in which one person underwent several treatments for the same diagnosis. Therefore, we only counted the first fracture even when one patient had several fractures in a single year. The accuracy of this method is lower than that of a retrospective survey in a single institution. However, this method produces statistically significant results with a considerably greater number of cases.
We were able to observe national trends in facial fractures because Korea implements a single health insurance system. Although KCD 6 and 7 do not have a complete classification for facial fractures, these codes make it possible to identify the area of fracture and number of open or closed fractures for each diagnosis in detail.
This is the first study to examine the frequency and trends of facial fractures in the Korean population using Big Data. Korea has adopted a single, uncommon health insurance system, so the authors were able to analyze Big Data's data. We used this data to analyze the frequency of facial fractures, annual, monthly, seasonal variation, age, gender, and detailed fracture analysis, as well as national trends.
Nevertheless, there are several limitations in this study. A major limitation of this study is that the raw data itself may be flawed when health professionals omit some diagnosis codes during entry. For example, when other fractures were present in addition to a nasal bone fracture, health professionals only entered the diagnosis code for nasal fracture. This results in a partial omission. Furthermore, in cases of facial laceration and related facial fracture, entering only the facial laceration code without entering the fracture code would result in a complete omission of the fracture code.
Another limitation of this study is that the data from automobile accidents is missing. Because car accident data has the patient's medical records for each insurer, it is impossible to investigate individual medical records of each insurer under the Personal Information Protection Act of the Republic of Korea.
The other limitation is that KCD 6 and 7 include incomplete diagnosis codes that have not been completely categorized. For example, under zygomatic and maxilla fractures, zygomatic arch has its own code for fractures, but there is no code for zygomatic body fractures. In the case of a body fracture, depending on the medical institution, the accuracy of the diagnosis is reduced by omitting it or borrowing another code. Also, there is no distinction between simple fractures and comminuted fractures in all fracture categories. In the case of comminuted fractures, there is a big difference in that the treatment is difficult and the prognosis is poor.
The authors used Big Data to examine the frequency of facial fractures in the Korean population and to analyze the facial fractures by detailed classification. It is important that this study is the first to investigate the frequency and trend of facial fractures in Koreans using Big Data.
 XML Download