

 PDF
PDF ePub
ePub Citation
 Print
Print


INTRODUCTION
Cardiovascular disease (CVD) has remained the leading cause of non-communicable disease mortality globally over the past decade,123 as it was estimated to cause 17.8 million deaths according to the Global Burden of Diseases 2017 study, reflecting an increase of approximately 21% compared to the burden in 2007.1 While age-standardized CVD prevalence was reported to decline between 1990 and 2005 in most high- and middle-income countries, no significant change was observed in most Asian countries.4 In South Korea, the age-adjusted mortality rate of all heart diseases showed a 79.9% decline in men and 77.6% decline in women during the 30-year period from 1983 to 2012, although the rate was consistently higher in men than in women.5
The decreasing trend in CVD mortality might be explained both by advances in disease treatments and by changes in lifestyle and nutritional factors affecting CVD risk.36 Hypertension and dyslipidemia have been consistently recognized as risk factors for CVD.78910 Results from the Asia Pacific Cohort Studies Collaboration revealed that the population-attributable risks for high blood pressure (BP) and high total cholesterol (TC) were first (28.6%) and third (6.5%) highest in Asian men, and first (30.5%) and second (8.2%) highest in Asian women among single risk factors.11 Additionally, findings from the Korean Heart Study with a median follow-up of 11.6 years showed a significantly elevated risk of coronary heart disease (CHD) among those with elevated or high levels of BP, TC, triglyceride (TG), or low-density lipoprotein cholesterol (LDL-C), and those with low levels of high-density lipoprotein cholesterol (HDL-C).12
However, age-adjusted data from nationwide studies in 1980–1990 and the Korea National Health and Nutrition Examination Survey (KNHANES) in 1998–2012 showed a decreasing trend of hypertension, but an increasing trend of hypercholesterolemia.713 In contrast, recent updates have reported a significant increase in the prevalence of elevated BP and hypercholesterolemia. Among modifiable risk factors, appropriate nutritional behavior is the most fundamental step that individuals can take to prevent hypertension14 and dyslipidemia,15 which is expected to decrease the risk of CVD; therefore, poor-quality diets themselves also play a vital role in the development of CVD.16
Recent guidelines for the management of hypertension17 and dyslipidemia,18 with a particular focus on dietary recommendations, have been published. However, several of these recommendations were based on guidelines in Western countries and extrapolated for the Korean population. Therefore, we conducted this meta-analysis to systematically review the current evidence regarding the associations of dietary intake with CVD, hypertension, and dyslipidemia.
MATERIALS AND METHODS
1. Data source and literature search
We systematically searched the PubMed and Embase databases from their inception to December 12, 2019, following the Preferred Reporting Items for Systematic Reviews and Meta-Analyses (PRISMA) guidelines.19 The search terms, which were based on the Population, Intervention, Comparison, and Outcome (PICO) guideline,20 contained dietary intake and its synonyms as exposure (“diet,” “dietary,” “intake,” and “consumption”); cardiovascular disease, hypertension, and dyslipidemia as outcomes (“cardiovascular disease,” “coronary heart disease,” “heart attack,” “myocardial infarction,” “cerebrovascular disease,” “stroke,” “peripheral vascular disease,” “heart failure,” “rheumatic heart disease,” “congenital heart disease,” “cardiomyopathy,” “hypertension,” “blood pressure,” “dyslipidemia,” “hyperlipidemia,” “cholesterol,” “high-density lipoprotein,” “low-density lipoprotein,” and “triglyceride”); and the Korean population (“Korea” and “Korean”). No limitation was placed on language of publication or the format (abstract or full-text), but a restriction was placed on conference abstracts with no published full-text version.
2. Inclusion and exclusion criteria
All studies evaluating the association between dietary intake and CVD, hypertension, or dyslipidemia risk in the Korean population were eligible for this meta-analysis. The inclusion criteria were as follows: i) the study was conducted on the Korean population; ii) the exposure was dietary intake of any food items, dietary patterns, or dietary indices; iii) the outcome was any CVDs, elevated BP or hypertension, or abnormalities in any lipid markers including TC, TG, HDL-C, and LDL-C; and iv) odds ratios (ORs) or hazard ratios (HRs) and their corresponding 95% confidence intervals (CIs) were reported for the association between exposures and binary outcomes. When studies overlapped in both the exposure and outcome, the most comprehensive one was selected for the final analysis.
3. Data extraction
Two researchers (T.H. and J.K.) independently selected the studies based on the eligibility criteria and extracted the following information: first author's name, publication year, project name, study design, duration of participant recruitment, follow-up time (for prospective studies only), sample size, type of exposure, type of outcome, confounding variables, and ORs/HRs with their 95% CIs of the highest quantile in the comparison with the lowest quantile from the model that adjusted for the highest number of potential confounders. For studies that selected the highest level of consumption as the reference group, ORs/HRs and 95% CIs were recalculated to obtain the effect size using the lowest level of consumption as the reference.
4. Quality assessment
The methodological quality of individual studies was assessed according to the Newcastle Ottawa Scale (NOS) for cross-sectional, case-control, and cohort studies.2122 Two investigators (T.H. and J.K.) independently scored each study according to the three subscales of the NOS: study selection, comparability, and exposure (or outcome) assessment. All discrepancies were addressed and judged by other co-authors. We considered studies with scores of 6 or higher to be high-quality studies. Additionally, we evaluated the level of evidence for nutritional findings according to the modified Joint World Health Organization-Food and Agriculture Expert Consultation criteria.23 Evidence was considered “possible” when a finding was consistent with a previous meta-analysis of prospective studies with no significant heterogeneity.23 Evidence was considered “limited” when a finding was consistent with either a meta-analysis of prospective studies with significant heterogeneity or a meta-analysis of case-control or cross-sectional studies.23 Evidence was deemed “insufficient” when a finding was consistent with a meta-analysis of 2 or fewer studies.23
5. Statistical analysis
When a pooled effect size was generated from at least two individual studies, heterogeneity across studies was assessed by computing the I2 statistic, for which an I2 value greater than 50% implies substantial heterogeneity.24 By assuming that all studies were conducted on study participants with different characteristics, we applied a random-effects model with the DerSimonian and Laird method to obtain the pooled effect size.25 We also performed subgroup analyses by study design and study population. Publication bias was tested using the Begg funnel plot and the Egger test2627 when at least 5 studies were available.
RESULTS
1. Study selection
Of the 3,577 records identified through an electronic search from databases and hand searches of bibliographies, 3,562 articles were assessed based on their title and abstract after removing duplicates. Of those studies, 3,404 were not relevant and the full texts of the 158 remaining articles were assessed for the eligibility criteria. Ninety-six articles were additionally excluded because of the following reasons: inappropriate exposure and/or outcome (n=62), unrelated methodology (n=14), unrelated population (n=6), and overlapping study population (n=14). Therefore, 62 studies,2829303132333435363738394041424344454647484950515253545556575859606162636465666768697071727374757677787980818283848586878889 including 42 cross-sectional, 3 case-control, and 17 cohort studies, were finally included in the systematic review and meta-analysis (Fig. 1).
2. Study characteristics and quality assessment
Supplementary Table 1 details the general characteristics of individual studies. Forty-nine articles (including 34 cross-sectional and case-control studies, and 15 cohort studies) reported ORs/HRs for single food items, macronutrients, and micronutrients; three cross-sectional studies provided ORs for dietary indices; and 10 articles (including 8 cross-sectional and 2 cohort studies) reported ORs/HRs for dietary patterns. The studies were from the Korea National Health and Nutrition Examination Survey (KNHANES) (n=31), the Ansan-Ansung or Urban cohort (n=19), the Health Examinee (HEXA) cohort (n=5), the National Sample cohort (n=1), the Korea National Cancer Screenee Cohort (KNCC) (n=2), and hospital and/or community-based studies (n=4).
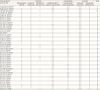
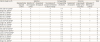
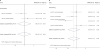
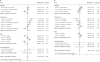
Tables 1-3 presents the quality assessment for individual studies based on the NOS. All the studies were deemed to be high-quality, with NOS scores of at least 6. The median quality scores were 8 (out of a total of 10) for cross-sectional studies, 6 (out of a total of 9) for case-control studies, and 7 (out of a total of 9) for cohort studies. Most of the cross-sectional studies showed selection bias, with different characteristics between responders and non-responders. For case-control studies, selection bias was reported for controls and unblinded interviews about dietary intake, as well as exposure bias for not reporting the non-response rate. For cohort studies, outcome bias regarding unblinded assessments was reported.
Table 1
Quality assessment of cross-sectional studies based on the Newcastle-Ottawa Scale
| Cross-sectional study (n=42) | Selection | Comparability | Outcome | Total | ||||
|---|---|---|---|---|---|---|---|---|
| Representative samples | Justice of sample size | Satisfactory response rate | Validated tool for exposure measurement | Controlling for confounding factors | Outcome assessment | Appropriate statistical test | ||
| Hong and Kim (2017)38 | - | ☆ | ☆ | ☆☆ | ☆☆ | ☆☆ | ☆ | 9 |
| Kang and Kim (2016)42 | ☆ | ☆ | - | ☆☆ | ☆☆ | ☆☆ | ☆ | 9 |
| Cha and Park (2019)29 | ☆ | ☆ | ☆ | ☆☆ | ☆☆ | ☆☆ | ☆ | 10 |
| Chung et al. (2019)34 | ☆ | ☆ | - | ☆ | ☆ | ☆☆ | ☆ | 7 |
| Yang et al. (2019)89 | ☆ | ☆ | ☆ | ☆ | ☆ | ☆☆ | ☆ | 8 |
| Song et al. (2017)84 | ☆ | ☆ | - | ☆ | ☆☆ | ☆☆ | ☆ | 9 |
| Shin et al. (2018)77 | ☆ | ☆ | - | ☆ | ☆ | ☆☆ | ☆ | 8 |
| Noh et al. (2017)66 | ☆ | ☆ | ☆ | ☆ | ☆ | ☆ | ☆ | 7 |
| Lee and Cho (2017)61 | ☆ | ☆ | - | ☆ | ☆☆ | ☆☆ | ☆ | 8 |
| Kim and Kim (2016)42 | - | ☆ | - | ☆☆ | ☆☆ | ☆☆ | ☆ | 8 |
| Kim and Je (2018)51 | ☆ | ☆ | - | ☆ | ☆☆ | ☆☆ | ☆ | 8 |
| Kwon et al. (2010)54 | ☆ | ☆ | - | ☆ | ☆☆ | ☆☆ | ☆ | 8 |
| Joo et al. (2016)41 | ☆ | ☆ | - | ☆ | ☆☆ | ☆ | ☆ | 7 |
| Kim (2013)45 | ☆ | ☆ | - | ☆ | ☆☆ | ☆☆ | ☆ | 8 |
| Park et al. (2010)72 | ☆ | ☆ | ☆ | ☆ | ☆☆ | ☆☆ | ☆ | 9 |
| Ha et al. (2018)36 | ☆ | ☆ | ☆ | ☆ | ☆ | ☆☆ | ☆ | 8 |
| Song et al. (2017)87 | ☆ | ☆ | - | ☆ | ☆ | ☆☆ | ☆ | 7 |
| Lee et al. (2018)63 | ☆ | ☆ | - | ☆ | ☆ | ☆☆ | ☆ | 7 |
| Park et al. (2016)70 | ☆ | ☆ | - | ☆☆ | ☆ | ☆☆ | ☆ | 8 |
| Oh and No (2018)67 | - | ☆ | ☆ | ☆ | ☆ | ☆☆ | ☆ | 7 |
| Oh et al. (2017)68 | - | ☆ | ☆ | ☆ | ☆ | ☆☆ | ☆ | 7 |
| Choi and Bae (2015)33 | ☆ | ☆ | - | ☆ | ☆☆ | ☆☆ | ☆ | 8 |
| Lee et al. (2013)55 | ☆ | ☆ | - | ☆☆ | ☆☆ | ☆☆ | ☆ | 9 |
| Shin and Kim (2019)81 | ☆ | ☆ | - | ☆ | ☆☆ | ☆☆ | ☆ | 8 |
| Park et al. (2015)71 | ☆ | ☆ | - | ☆☆ | ☆☆ | ☆☆ | ☆ | 9 |
| Seo et al. (2019)73 | ☆ | ☆ | ☆ | ☆☆ | ☆ | ☆☆ | ☆ | 9 |
| Shin et al. (2018)82 | - | ☆ | ☆ | ☆☆ | ☆ | ☆☆ | ☆ | 8 |
| Shin et al. (2017)79 | ☆ | ☆ | - | ☆☆ | ☆ | ☆☆ | ☆ | 8 |
| Shin et al. (2019)80 | ☆ | ☆ | - | ☆☆ | ☆ | ☆☆ | ☆ | 8 |
| Lee et al. (2017)58 | ☆ | ☆ | - | ☆☆ | ☆☆ | ☆☆ | ☆ | 9 |
| Shin et al. (2017)78 | ☆ | ☆ | - | ☆☆ | ☆ | ☆☆ | ☆ | 8 |
| Kim and Kim (2018)47 | ☆ | ☆ | - | ☆☆ | ☆☆ | ☆☆ | ☆ | 9 |
| Ha et al. (2018)35 | ☆ | ☆ | ☆ | ☆ | ☆ | ☆☆ | ☆ | 8 |
| Lee and Cho (2014)60 | ☆ | ☆ | - | ☆ | ☆☆ | ☆☆ | ☆ | 8 |
| Kim and Jo (2011)46 | ☆ | ☆ | - | ☆ | ☆☆ | ☆☆ | ☆ | 8 |
| Shin et al. (2014)75 | ☆ | ☆ | - | ☆☆ | ☆☆ | ☆☆ | ☆ | 9 |
| Kim et al. (2019)49 | ☆ | ☆ | - | ☆ | ☆ | ☆☆ | ☆ | 7 |
| Lee et al. (2011)59 | - | ☆ | - | ☆☆ | ☆ | ☆☆ | ☆ | 7 |
| Na et al. (2019)64 | - | ☆ | - | ☆ | ☆ | ☆☆ | ☆ | 6 |
| Cho et al. (2011)31 | ☆ | ☆ | - | ☆☆ | ☆ | ☆☆ | ☆ | 8 |
| Choi et al. (2015)32 | ☆ | ☆ | - | ☆☆ | ☆ | ☆☆ | ☆ | 8 |
| Hong et al. (2012)37 | - | - | ☆ | ☆ | ☆ | ☆☆ | ☆ | 6 |
![]()
Table 2
Quality assessment of case-control studies based on the Newcastle-Ottawa Scale

| Case-control study (n=3) | Selection | Comparability | Expose | Total | |||||
|---|---|---|---|---|---|---|---|---|---|
| Adequate definition of cases | Representative cases | Selection of controls | Definition of controls | Comparability of cases and controls | Exposure ascertainment | Same ascertainment criteria for cases and controls | Non-response rate | ||
| Lee et al. (2015)62 | ☆ | ☆ | ☆ | ☆ | ☆ | - | ☆ | ☆ | 7 |
| Suh et al. (2001)88 | ☆ | ☆ | - | ☆ | ☆☆ | - | ☆ | - | 6 |
| Nam et al. (2003)65 | ☆ | ☆ | - | ☆ | ☆☆ | - | ☆ | - | 6 |
![]()
Table 3
Quality assessment of cohort studies based on the Newcastle-Ottawa Scale
| Cohort study (n=17) | Selection | Comparability | Outcome | Total | |||||
|---|---|---|---|---|---|---|---|---|---|
| Representative exposed cohort | Selection of non-exposed cohort | Assessment of exposure | No presence of outcome of interest at start of study | Comparability of cohorts | Assessment of outcome | Long enough follow-up for outcomes | Adequacy of follow-up of cohorts | ||
| Kim and Kim (2018)47 | - | ☆ | - | ☆ | ☆☆ | ☆ | ☆ | ☆ | 7 |
| Song et al. (2017)85 | ☆ | ☆ | - | ☆ | ☆ | ☆ | ☆ | - | 6 |
| Kim et al. (2019)50 | ☆ | ☆ | - | ☆ | ☆☆ | ☆ | ☆ | - | 7 |
| Baik et al. (2010)28 | ☆ | ☆ | - | ☆ | ☆☆ | ☆ | ☆ | ☆ | 8 |
| Son et al. (2019)83 | ☆ | ☆ | - | ☆ | ☆☆ | - | ☆ | - | 6 |
| Park et al. (2017)69 | ☆ | ☆ | - | ☆ | ☆☆ | - | ☆ | - | 6 |
| Lee and Park (2018)57 | ☆ | ☆ | - | ☆ | ☆ | - | ☆ | ☆ | 6 |
| Jang et al. (2018)39 | ☆ | ☆ | - | ☆ | ☆☆ | - | ☆ | - | 6 |
| Kwak et al. (2019)53 | ☆ | ☆ | - | ☆ | ☆☆ | ☆ | ☆ | - | 7 |
| Shin et al. (2013)74 | ☆ | ☆ | - | ☆ | ☆☆ | ☆ | ☆ | - | 7 |
| Kim and Kim (2017)44 | - | ☆ | - | ☆ | ☆☆ | ☆ | ☆ | ☆ | 8 |
| Kang and Kim (2017)43 | ☆ | ☆ | - | ☆ | ☆☆ | ☆ | ☆ | ☆ | 8 |
| Jeon and Park (2019)40 | ☆ | ☆ | - | ☆ | ☆☆ | - | ☆ | - | 6 |
| Chae et al. (2019)30 | ☆ | ☆ | - | ☆ | ☆☆ | ☆ | ☆ | - | 7 |
| Shin et al. (2019)76 | ☆ | ☆ | - | ☆ | ☆☆ | ☆ | ☆ | ☆ | 8 |
| Lee et al. (2019)56 | ☆ | ☆ | - | ☆ | ☆☆ | ☆ | ☆ | ☆ | 8 |
| Song et al. (2018)86 | - | ☆ | - | ☆ | ☆☆ | ☆ | ☆ | ☆ | 7 |
![]()
3. Main analysis
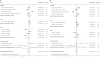
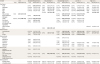
A comprehensive evaluation of single food items, micronutrients, macronutrients, and dietary indices and their associations with CVD, hypertension, and lipid profile is presented in Table 4. Overall, higher fruit intake was associated with a lower risk of elevated BP/hypertension (OR/HR, 0.52; 95% CI, 0.37–0.73) and elevated/high TG (OR, 0.84; 95% CI, 0.73–0.96), whereas egg intake was found to be associated with a reduced risk of elevated BP/hypertension (OR/HR, 0.89; 95% CI, 0.79–0.99) and low HDL-C (OR, 0.84; 95% CI, 0.78–0.91). Negative associations were found between consumption of milk and dairy and the risks of CVD, elevated/high TG, and low HDL-C. “Limited” evidence was found for an inverse association between coffee consumption and CVD (OR, 0.71; 95% CI, 0.52–0.97) and elevated/high TG (OR, 0.84; 95% CI, 0.78–0.90). In addition, subjects with elevated BP/hypertension were less likely to consume meat (HR, 0.68; 95% CI, 0.56–0.83) and coffee (OR, 0.90; 95% CI, 0.83–0.98). In contrast, significant associations were found between sugar and meat intake and the risk of elevated/high TC, with ORs (95% CIs) of 1.24 (1.05–1.48) and 1.14 (1.06–1.22), respectively. Sugar-sweetened beverage intake was also significantly related with a 20% increased risk of elevated BP/hypertension (OR/HR, 1.20; 95% CI, 1.09–1.33) and elevated/high TG (OR, 1.20; 95% CI, 1.03–1.41) based on possible evidence. Moreover, insufficient evidence showed a higher risk of elevated BP/hypertension among those with a higher intake of fried foods, with an OR (95% CI) of 1.56 (1.14–2.15).
Table 4
Meta-analysis of the associations of food items, nutrients, and dietary indices with cardiovascular disease, hypertension, and lipid profile
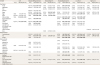
Bold and italic text indicates significant associations.
CVD, cardiovascular disease; BP, blood pressure; TC, total cholesterol; TG, triglycerides; HDL-C, high-density lipoprotein cholesterol; LDL-C, low-density lipoprotein cholesterol; N, number of individual population; I2, heterogeneity I-square; OR, odds ratio; HR, hazard ratio; CI, confidence interval; NA, not applicable.
The presented data have an “insufficient” level of evidence, except for *“limited” evidence and †“possible” evidence.
![]()
Regarding macronutrient consumption, individuals with elevated/high TG or low HDL-C were observed to have a higher intake of carbohydrates, but a lower intake of fat and protein, compared to those with normal TG and HDL-C levels. Additionally, fat intake was negatively associated with elevated BP/hypertension, but positively associated with high LDL-C. None of the associations between micronutrients and the outcomes were significant, except for vitamin C and elevated/high TG.
Among dietary indices, negative associations were found between high scores of the Mediterranean diet and elevated/high TG (OR, 0.70; 95% CI, 0.53–0.92), and between a low-carbohydrate-diet and elevated/high TG (OR, 0.76; 95% CI, 0.61–0.95) and low HDL-C (OR, 0.77; 95% CI, 0.63–0.95). Furthermore, the Integrated Korean Dietary Pattern Score showed a borderline association with elevated BP/hypertension (OR, 0.85; 95% CI, 0.72–1.00), but a non-significant association with elevated/high TC and low HDL-C based on “limited” evidence.
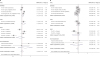
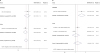
In the analyses of dietary patterns (Figs. 2-7), adherence to a healthy dietary pattern, which was defined as a rice-based or traditional pattern, showed borderline relationships with a decreased risk of elevated/high TC (OR, 0.87; 95% CI, 0.77–1.00, Fig. 4) and elevated/high TG (OR, 0.90; 95% CI, 0.78–1.04, Fig. 5). A meta-analysis of two studies showed a 17% lower risk of high LDL-C among those who adhered to healthy diets (OR, 0.83; 95% CI, 0.74–0.94, Fig. 7). In contrast, adherence to an unhealthy dietary pattern, which was defined as a meat-based or Western pattern, was observed to be associated with a 6% lower risk of low HDL-C (OR, 0.94; 95% CI, 0.88–0.99, Fig. 6).
 | Fig. 2Meta-analysis of the associations of (A) healthy and (B) unhealthy dietary patterns with cardiovascular disease.OR, odds ratio; HR, hazard ratio; CI, confidence interval.
|
 | Fig. 3Meta-analysis of the associations of (A) healthy and (B) unhealthy dietary patterns with elevated or high blood pressure.OR, odds ratio; HR, hazard ratio; CI, confidence interval; KNHANES, Korea National Health and Nutrition Examination Survey; KNCC, Korea National Cancer Screenee Cohort.
|
 | Fig. 4Meta-analysis of the associations of (A) healthy and (B) unhealthy dietary patterns with elevated or high total cholesterol.OR, odds ratio; HR, hazard ratio; CI, confidence interval; KNHANES, Korea National Health and Nutrition Examination Survey.
|
 | Fig. 5Meta-analysis of the associations of (A) healthy and (B) unhealthy dietary patterns with elevated or high triglycerides.OR, odds ratio; HR, hazard ratio; CI, confidence interval; KNHANES, Korea National Health and Nutrition Examination Survey; KNCC, Korea National Cancer Screenee Cohort.
|
 | Fig. 6Meta-analysis of the associations of (A) healthy and (B) unhealthy dietary patterns with low high-density lipoprotein cholesterol.OR, odds ratio; HR, hazard ratio; CI, confidence interval; KNHANES, Korea National Health and Nutrition Examination Survey; KNCC, Korea National Cancer Screenee Cohort.
|
4. Subgroup analysis
The findings of the meta-analysis of all study types were mostly consistent with those of cross-sectional, case-control, or cohort studies (Tables 5 and 6). However, while there was a significant association between sugar-sweetened beverage intake and elevated/high TG in the overall analysis, the association was borderline in the subgroup analysis of cross-sectional and case-control studies (Table 5). Additionally, the significant associations between milk and dairy or sugar-sweetened beverage intake and the risks of elevated/high TG or low HDL-C in the subgroup analysis of cohort studies were different from those in the overall analysis (Table 6).
Table 5
Subgroup analysis of cross-sectional or case-control studies for the associations of dietary intake with cardiovascular disease, hypertension, and lipid profile
Bold and italic text indicates significant associations. Underlining indicates a difference in the significance level from the overall analysis.
CVD, cardiovascular disease; BP, blood pressure; TC, total cholesterol; TG, triglycerides; HDL-C, high-density lipoprotein; LDL-C, low-density lipoprotein cholesterol cholesterol; N, number of individual population; I2, heterogeneity I-square; OR, odds ratio; HR, hazard ratio; CI, confidence interval; NA, not applicable.
![]()
Table 6
Subgroup analysis of cohort studies for the associations of dietary intake with cardiovascular disease, hypertension, and lipid profile

Bold and italic text indicates significant associations. Underlining indicates a difference in the significance level from the overall analysis.
CVD, cardiovascular disease; BP, blood pressure; TC, total cholesterol; TG, triglycerides; HDL-C, high-density lipoprotein; LDL-C, low-density lipoprotein cholesterol cholesterol; N, number of individual population; I2, heterogeneity I-square; OR, odds ratio; HR, hazard ratio; CI, confidence interval; NA, not applicable.
![]()
Furthermore, a subgroup analysis by study population showed a significant association between adherence to an unhealthy dietary pattern and the risk of elevated/high TC in Urban populations (OR, 1.14; 95% CI, 1.03–1.25, Fig. 4). Additionally, adherence to a healthy dietary pattern was found to associated with a 19% lower risk of elevated/high TG (OR, 0.81; 95% CI, 0.67–0.98, Fig. 5). A borderline association between a healthy dietary pattern and low HDL-C was observed in the KNHANES study (Fig. 6).
5. Publication bias
Fig. 8 shows Begg funnel plots and Egger tests for the evaluation of publication bias in meta-analyses of at least 5 studies. All the results showed no evidence of publication bias (p>0.05).
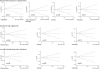 | Fig. 8Publication bias for estimates in the meta-analysis of the associations between dietary intake and the risks of hypertension and dyslipidemia.OR, odds ratio; HR, hazard ratio; SE, standard error.
|
Stata SE version 14.0 (StataCorp, College Station, TX, USA) was used for all statistical analyses.
DISCUSSION
The current systematic review and meta-analysis investigated the effects of dietary intake on CVD risk, BP, and lipid profile by pooling the effect sizes of 62 published observational studies in the Korean population. Most of the studies reported findings from nationwide surveys such as KNHANES, Ansan-Ansung, HEXA, and KNCC. In most cases, findings on elevated BP/hypertension, elevated/high TG, and low HDL-C from studies of dietary factors and metabolic syndrome were evaluated. Additionally, accumulated evidence on CVD, elevated/high TC, and high LDL-C were also reported. Regarding dietary factors, fruits, vegetables, fish, sugar, meat, milk and dairy, sugar-sweetened beverages, coffee, carbohydrates, and the Integrated Korean Dietary Pattern Score were the most frequently examined parameters. Despite subjective variation in the nomenclature used in individual studies, dietary patterns based on factor analyses of healthy and unhealthy foods were also identified and their associations with the outcomes of interest were analyzed.
Beneficial associations, with “possible” and “limited” evidence, were found between fruit and egg intake and a decreased risk of elevated BP/hypertension, between milk and dairy intake and a reduced risk of elevated/high TG and low HDL-C, and between coffee intake and a lower risk of CVD, elevated BP/hypertension, and elevated/high TG. Additionally, a Western-based dietary pattern was negatively associated with low HDL-C risk. In contrast, sugar-sweetened beverage consumption was positively associated with the risk of elevated BP/hypertension and elevated/high TG. Additionally, high carbohydrate consumption was related to an increased risk of elevated/high TG.
A recent dose-response meta-analysis of prospective studies reported that fruit and/or vegetable consumption had a beneficial effect, as shown by significant decreases in the risk of CHD, stroke, and CVD (with risk reductions ranging from 8% to 21%).90 Fruits, vegetables, and the combination of fruits and vegetables were also associated with 13%, 12%, and 10% decreased risks of incident hypertension, respectively.91 A consistent finding from another meta-analysis of fruit intake only found a significantly decreased risk of high TG, with a pooled OR of 0.91 (95% CI, 0.84–0.98) for every serving/day increase in fruit consumption.92 A biological mechanism has been proposed for the protective effect of fruits and/or vegetables, according to which high levels of micronutrients such as flavones, potassium, magnesium, and vitamin C can enhance antioxidant activity.93 However, no significant effect of vegetable intake was found in the small number of studies investigating this relationship that were included in our analysis (n=2).
Furthermore, the role of D-galactose, which is most often consumed in milk, in oxidative stress and inflammatory processes has been investigated, and high milk consumption has therefore been proposed for disease prevention.94 Although a previous comprehensive review found no significant effect of total dairy intake on TG and HDL-C levels, our meta-analysis observed a protective effect of combined milk and dairy consumption.95
Previous studies found J-shaped96 and U-shaped97 effects of coffee consumption on CVD and CHD risk, respectively. This is consistent with our findings of a lower risk of CVD among those who were in the highest coffee consumption quantile than among those who were in the lowest quantile. Coffee has been reported to contain several antioxidants and micronutrients, which have beneficial effects on endothelial function and decrease the level of inflammation markers, potentially leading to a decreased risk of CVD.98
In contrast, consistent findings from a dose-response meta-analysis of prospective studies showed an 8% (OR, 1.08; 95% CI, 1.04–1.12) increased risk of hypertension per daily serving of sugar-sweetened beverages.99 It was suggested that fructose, high levels of which are contained in sugar-sweetened beverages, could activate the renin-angiotensin system and cause an increased risk of hypertension.99
According to the authors' knowledge, this is the most comprehensive study to draw conclusions about the effects of various dietary factors—including single food items, macronutrients, micronutrients, dietary indices, and dietary patterns—for the outcomes of CVD, BP, and lipid profile in the Korean population. Consistent findings between the overall analysis and subgroup analyses were obtained for most of the associations. Although the available data were not sufficient to perform sex-specific subgroup analysis, sex was adjusted in individual studies to exclude its confounding effect. Moreover, the large sample size obtained from nationwide studies such as the KNHANES (KNHANES 1998, KNHANES 2001, KNHANES 2005, KNHANES 2007-2009, KNHANES 2010-2011, KNHANES 2013-2015, KNHANES 2015-2016) conducted by the Korea Centers for Disease Control and Prevention,100 and the Ansan-Ansung 2001–2002 (up to 12 years of follow-up) and HEXA 2004–2013 cohorts from the Korean Genome and Epidemiology Study project allowed us to obtain robust results for the overall population.101
Despite its strengths, this review has several limitations. Firstly, 34 of the 62 articles included in the final analyses were cross-sectional or case-control studies, which provide a lower level of evidence than prospective cohort studies. Additionally, the relatively small number of studies for many pooled estimates and the substantial between-study heterogeneity resulting from differences between the study populations might have decreased the strength of the evidence obtained from the pooled analyses. As a result, most of the evidence was deemed to be “limited” or “insufficient.” Secondly, although diabetes has been well established as a strong risk factor of CVD,102 and a predictive equation for CHD has been developed for the Korean population,103 we focused our research on only hypertension and dyslipidemia because the population-attributable risk of diabetes for CVD was fourth-highest in Korean men and third-highest in Korean women, after the population-attributable risks of hypertension and dyslipidemia for CVD.18 Thirdly, although several other biomarkers of atherosclerotic CVD have been reported for the Korean population, such as the ankle-brachial index, high-sensitivity C-reactive protein level, lipoprotein(a), apolipoprotein B, and the coronary artery calcium score,104 data on these biomarkers were not available for the analysis. Lastly, the currently available data were insufficient to perform a dose-response meta-analysis for all the associations or to analyze the effects of different subtypes of meat and fat.
In summary, this study provided comprehensive evidence of the effects of nutritional intake on CVD and some risk factors, such as BP and lipid profile. “Limited” and “possible” evidence was found for the protective effects of milk and dairy and coffee, while harmful effects were found for sugar-sweetened beverages. Awareness of the role of each dietary component is required for the prevention of CVD and related risk factors.
 XML Download