

 PDF
PDF ePub
ePub Citation
 Print
Print


Abstract
Purpose
Methods
Results
Figures and Tables
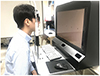 | Figure 1Actual measurement of hyperacuity. For binocular vision separation, the target was projected onto a polarization monitor and the subject wore polarized glasses (3 dimensional glasses) orthogonal to both eyes.
|
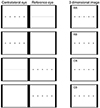 | Figure 2Chart developed for hyperacuity measurement. It consists of target images which consist of 5 dots with reference line and without reference line. When subject wears 3 dimensional (3D) glasses and looks at the target, it looks like a 3D image. RR = reference eye has a reference line and dots on the contralateral eye; RB = reference eye has a blank image and dots on the contralateral eye; CR = reference eye has dots and reference line on the contralateral eye; CB = reference eye has dots and blank image on the contralateral eye.
|
 | Figure 3Chart developed for hyperacuity measurement. This image consists of five dots. Randomly one of five dots is out of baseline. Grades are from 6 to 1, and are indicated at the upper left of each chart. Each grade means that the deviation is from 6 pixel to 1 pixel from the baseline. In the figure above, grade 6 (the first chart on the left) is a dot 6 pixel away from the baseline, which corresponds to the third dot (The downwards arrow points to the dot that is out of the baseline, which does not appear in the actual chart).
|
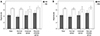 | Figure 4Difference in hyperacuity with or without reference line. The analysis was divided into two cases: Reference line on the reference eye (A) and the contralateral eye (B). All groups can detect more sensitively than when there is no reference line (all p < 0.05). p-value is obtained from Wilcoxon signed rank test. RR = reference eye has a reference line and dots on the contralateral eye; RB = reference eye has a blank image and dots on the contralateral eye; CR = reference eye has dots and reference line on the contralateral eye; CB = reference eye has dots and blank image on the contralateral eye.
|
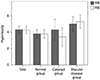
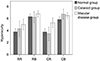 | Figure 5Difference in hyperacuity by group. Normal group and cataract group showed no difference in hyperacuity, but normal group and macular disease showed significant differences in RR (p = 0.028) and CR (p = 0.002). p-value is obtained from Mann-Whitney U test. RR = reference eye has a reference line and dots on the contralateral eye; RB = reference eye has a blank image and dots on the contralateral eye; CR = reference eye has dots and reference line on the contralateral eye; CB = reference eye has dots and blank image on the contralateral eye.
|
 | Figure 6Difference in hyperacuity depending on site of reference line. There is no difference in the hyperacuity when the reference line is in the reference eye or contralateral eye. p-value is obtained from Wilcoxon signed rank test. RR = reference eye has a reference line and dots on the contralateral eye; CR = reference eye has dots and reference line on the contralateral eye.
|
Table 1
Demographics of the study
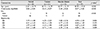
Values are presented as mean ± standard deviation or number.
RR = reference eye has a reference line and dots on the contralateral eye; RB = reference eye has a blank image and dots on the contralateral eye; CR = reference eye has dots and reference line on the contralateral eye; CB = reference eye has dots and blank image on the contralateral eye.
*p-value is obtained from chi-square statistics for sex and other is calculated by analysis of variance.
![]()
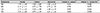
Table 2
Difference in hyperacuity with or without reference line

All groups can detect more sensitively than when there is no reference line. Values are presented as mean ± standard deviation.
RR = reference eye has a reference line and dots on the contralateral eye; RB = reference eye has a blank image and dots on the contralateral eye; CR = reference eye has dots and reference line on the contralateral eye; CB = reference eye has dots and blank image on the contralateral eye; Macular ds. = macular disease.
*p-value is obtained from Wilcoxon signed rank test.
![]()
Table 3
Difference in hyperacuity by group
Normal group and cataract group showed no difference in hyperacuity, but normal group and macular disease showed significant differences in RR and CR. Values are presented as mean ± standard deviation.
Macular ds. = macular disease; RR = reference eye has a reference line and dots on the contralateral eye; RB = reference eye has a blank image and dots on the contralateral eye; CR = reference eye has dots and reference line on the contralateral eye; CB = reference eye has dots and blank image on the contralateral eye.
*p-value is obtained from Mann-Whitney U test.
![]()
 XML Download