

 PDF
PDF ePub
ePub Citation
 Print
Print


INTRODUCTION
Osteoarthritis (OA) is the most common degenerative disorder and is traditionally characterized by clinical symptoms such as joint pain and stiffness as well as radiographic changes including joint space narrowing and osteophyte formation [12]. OA is markedly associated with increased health burden and mortality. Diverse pathogenic mechanisms in the development and progression of OA consist of mechanical stress, inflammatory responses, metabolic disturbances, and genetic predisposition, although the different degrees to which these contribute to OA in a given individual remain poorly determined. Physical examination, radiography, musculoskeletal ultrasound (MSUS), and recently magnetic resonance image (MRI) are used to diagnose OA and guide therapy [2]. Furthermore, many studies have investigated biochemical markers and biomarkers as noninvasive tools for diagnosis, predicting disease severity, and monitoring treatment response in OA [3,4,5,6].
Uric acid is an end byproduct of human purine metabolism and is well-recognized as a biomarker of various diseases such as metabolic syndrome, cardiovascular disease, and chronic renal disease [7]. There is increasing evidence that serum uric acid is pathogenically associated with radiographic changes in OA such as joint space narrowing and osteophytes [8910]. In addition, uric acid in synovial fluid has been suggested to play an important role in the pathogenesis of OA [1112]. Although an association between uric acid and osteoarthritis has been reported in previous studies, the specific role of urine uric acid in OA has not been assessed.
There is insufficient evidence of association between uric acid and ultrasonographic features in knee OA. In this study, we evaluated whether serum and spot urine uric acid are associated with radiographic grade and ultrasonographic findings of suprapatellar effusion, synovial hypertrophy, osteophyte formation, and cartilage degradation in patients with knee OA.
MATERIALS AND METHODS
Study population
A total of 100 subjects who visited the outpatient clinic of our institution was consecutively enrolled in this study from January 2018 to December 2018. The study groups consisted of patients with knee OA (n=42) and healthy controls (n=58). Knee OA was defined according to the classification criteria proposed by the American College of Rheumatology [13]. Healthy controls were patients who visited the rheumatology outpatient clinic but had no evidence of inflammatory rheumatic disease such as rheumatoid arthritis (RA), systemic lupus erythematosus, ankylosing spondylitis (AS), or Sjögren's syndrome or other types of inflammatory arthritis such as gout and pseudogout.
All subjects taking medications affecting uric acid metabolism such as aspirin, diuretics, or cyclosporine; patients who were already diagnosed with gout or renal insufficiency; and patients who had undergone knee arthroscopy, intraarticular injection, or other knee arthrocentesis in the previous month were excluded from the study.
All participants including patients with knee osteoarthritis and healthy controls registered in this study provided informed consent for inclusion in the study. This study was also approved by the Institutional Review Board (IRB) at the time of enrollment in the registry (IRB no. CR-19-093-L).
Collection of clinical information
Baseline clinical characteristics consisted of age (years), sex, and body mass index (BMI, kg/m2). Erythrocyte sedimentation rate (ESR, mm/hr), C-reactive protein (CRP, mg/L), serum uric acid (mg/dL), serum creatinine (mg/dL), urine uric acid (mg/dL), and urine creatinine (mg/dL) were measured at the time of enrollment. Estimated glomerular filtration rate (eGFR, mL/min/1.73 m2) was calculated using the simplified equation of the Modification of Diet in Renal Disease Study [14].
Radiographic assessment
Weight-bearing plain anteroposterior and lateral radiographs of the knee joint were obtained with patients in a semi-flexed position. All films were independently read by two rheumatologists (UH Jung and SK Kim). Radiographic severity of both knee joints was assessed by Kellgren-Lawrence (K-L) grade, which ranges from grade I to grade IV [15]. In addition, joint space width was measured as the radiolucent area between the distal femur and the proximal tibia for the medial and lateral joint spaces of each knee [16]. Intraclass correlation coefficient (ICC) for intra- and inter-observer variability for K-L grade was assessed. K-L grade had higher intra- and inter-observer reliability (ICC=0.837 and ICC=0.867, respectively).
Ultrasonographic assessment
Musculoskeletal ultrasonographic findings of the knee joint in patients diagnosed with knee OA were suprapatellar effusion, synovial hypertrophy, osteophyte formation, cartilage degeneration, and Baker's cyst [171819]. MSUS examinations using the ACUSON S2000 Ultrasound System (Siemens Healthineers, Seoul, Korea) were performed with a 5~14 MHz linear transducer (14L5) by two rheumatologists (UH Jung and SK Kim). Synovial effusion and synovial hypertrophy was determined using the definition proposed by the Outcome Measure in Rheumatology (OMERACT) US Working Group [17]. Anechoic or hypoechoic material that is compressible and displaceable in the longitudinal plane at the knee joint was defined as suprapatellar effusions. For measurement, the knee joint was placed at approximately 30 degrees of flexion, and the size of effusion was measured at the longitudinal suprapatellar position as the maximum diameter in the longitudinal plane. Depths greater than 4 mm were judged as a suprapatellar effusion [18]. Intra- and inter-observer ICC for suprapatellar effusion by ultrasound were 0.876 and 0.891, respectively. Presence of intraarticular hypoechoic tissue that is nondisplaceable in the suprapatellar recess was defined as synovial hypertrophy, which may show Doppler signal. The depth of the maximum diameter in synovial hypertrophy was also measured. Synovial hypertrophy was defined as a synovial membrane thickness greater than 4 mm in the median longitudinal plane [18]. Suprapatellar effusions and synovial hypertrophy were arbitrarily graded on the basis of a previously described classification system [18], as shown in Table 1. Cartilage degradation was arbitrarily classified into one of four groups from group 0 to group 3 based on quartiles of cartilage thickness measured in the study. Baker's cyst was defined as a synovial cyst filled with hypoechoic fluid between the medial head of the gastrocnemius and the semimembranosus tendons [19].
Statistical analysis
Data are described as median (interquartile range) for quantitative variables and number (%) for qualitative variables. Non-parametric analyses were used in cases where normality was absent. The differences of uric acid and uric acid/creatinine in serum and spot urine between healthy controls and knee OA were assessed by the Mann-Whitney U-test. The Kruskal-Wallis test was used to evaluate differences in uric acid and uric acid/creatinine for serum and spot urine according to K-L grade (grades 1 to 3). Correlation analysis between uric acid and ultrasonographic findings were assessed by Spearman's correlation method, which was reported as a correlation coefficient (r). Association between serum uric acid and cartilage and synovial hypertrophy thickness was confirmed by linear regression analysis after adjustment with age and BMI. Multivariate logistic regression analysis was used to determine variables associated with knee OA and were presented as odds ratio (OR) with 95% confidence interval (95% CI). Statistical significance was defined as a p-value less than 0.05. Statistical analyses were performed by IBM SPSS Statistics 19.0 (IBM Corp., Armonk, NY, USA).
RESULTS
A total of 100 subjects was included in this study and consisted of knee OA (n=42) and healthy controls (n=58), as shown in Table 1. There was significant difference between the two groups with respect to age and BMI but no other parameters such as sex, ESR, CRP, and eGFR. Radiographic findings assessed by K-L grade and ultrasonographic findings such as synovial hypertrophy, cartilage degradation, suprapatellar effusion, osteophyte formation, and Baker's cyst in patients with knee OA are described in Table 1.
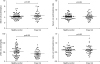
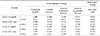
We first compared level of uric acid and uric acid/creatinine ratio in serum or spot urine between healthy controls and patients with knee OA (Figure 1). Only urine uric acid in knee OA was significantly lower than that in healthy controls (35.6 [23.7~54.5] vs. 50.0 [30.4~70.8], p=0.021). Other biomarkers of serum uric acid, serum uric acid/creatinine ratio, and urine uric acid/creatinine ratio were similar among study groups (p>0.05 for all).
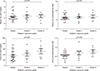
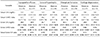
The differences of uric acid and uric acid/creatinine ratio in serum or spot urine according to K-L grade in knee OA were evaluated (Figure 2). Serum uric acid, urine uric acid, and serum urine/creatinine ratio among three groups were not statistically different, and only urine uric acid/creatinine ratio was significantly higher in K-L grade III than grade II (0.83 [0.55~1.02] vs. 0.59 [0.46~0.67], p=0.043). However, we identified a tendency of urine uric acid to increase in grade III compared to grade I, without statistical significance (56.2 [29.3~72.0] vs. 32.4 [20.0~51.0], p=0.087).
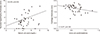
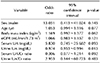
We next investigated the relationship between uric acid and the OA characteristics osteophyte length, cartilage thickness, synovial hypertrophy thickness, depth of synovial effusion, and radiographic joint space width using univariate correlation analysis (Table 2). Serum uric acid was closely associated with synovial hypertrophy thickness (r=0.350, p=0.023). In addition, urine uric acid/creatinine ratio was negatively associated with cartilage thickness (r=-0.355, p=0.021). Figure 3 showed correlation of uric acid with synovial hypertrophy and cartilage thickness in knee OA. After adjusting for age and BMI, serum uric acid was significantly associated with synovial hypertrophy thickness (r=0.375, p=0.018). However, the significant association between urine uric acid/creatinine and cartilage thickness was lost after adjusting for age and BMI (r=-0.277, p=0.100).
We compared uric acid and uric acid/creatinine ratio in serum or urine according to ultrasonographic abnormalities (Table 3). Patients with synovial hypertrophy had higher serum uric acid level and serum/urine uric acid ratio compared to those without synovial hypertrophy (p=0.016 and p=0.002, respectively). In contrast, spot urine uric acid and uric acid/creatinine ratio were marginally lower in patients with synovial hypertrophy compared to those without (p=0.055 for both). We also identified a significant difference in urine uric acid/creatinine ratio between patients with and without cartilage degradation (p=0.022). In addition, patients with cartilage degradation had a lower serum/urine uric acid ratio compared to those without cartilage degradation (p=0.042). There was no difference in uric acid or uric acid/creatinine ratio in patients with and without suprapatellar effusion and osteophyte formation.
To determine the effect of uric acid on knee OA, we performed multivariate logistic regression analysis. Only urine uric acid was negatively associated with knee OA in the analysis (OR=0.974, 95% CI 0.954~0.994, p=0.013) (Table 4).
DISCUSSION
Although the precise pathogenic mechanism of OA has not been determined, several studies have suggested that synovium-, cartilage-, and bone-derived molecules in synovial fluid, serum, and urine may be useful as biomarkers of therapeutic response, diagnosis, and prognostic potential in OA [3456]. To the best of our knowledge, our study is the first to evaluate the association between degree of inflammation and progression of knee OA based on radiographic and ultrasonographic assessments and uric acid level in serum and spot urine. We found that serum uric acid accurately reflected the burden of synovial hypertrophy compared to suprapatellar effusion size, osteophyte formation, and cartilage degradation as assessed by knee MSUS. In addition, urine uric acid/creatinine ratio appeared to increase with increasing severity of knee OA.
Uric acid is the causative agent of gout related to hyperuricemia or uric acid deposition in joint fluid [20]. In addition, several studies have demonstrated that uric acid is associated with OA [89101112]. In a cross-sectional study of 4,685 Chinese subjects, presence of osteophytes in knee OA was statistically significant in women with the highest tertile of serum uric acid (adjusted OR 1.43, 95% CI 1.01~2.03) but not in men [9]. Similarly, another study reported that the highest tertile of serum uric acid is positively associated with generalized OA in patients with hip arthroplasty (adjusted OR 3.5, 95% CI 1.3~9.1) [8]. A recent prospective study with a 2-year follow-up period demonstrated that baseline serum uric acid level predicted the occurrence of joint space narrowing in knee OA, which is also significantly correlated with baseline synovial volume measured by MRI, a practical marker of joint space narrowing [10]. In our study, serum uric acid level in patients with synovial hypertrophy detected by MSUS was significantly higher than those without synovial hypertrophy. In addition, serum uric acid was significantly correlated with synovial hypertrophy. In contrast, serum uric acid was not related to suprapatellar effusion, osteophyte formation, or cartilage degradation in knee OA. Thus, the results of our study are consistent with previous studies [10] and together indicate that uric acid might be associated with inflammation of synovial tissue in OA.
Uric acid may be an important trigger for increasing the inflammatory response of synovial membrane in OA. Zamudio-Cuevas et al. [21] demonstrated that reactive oxygen species and nitrogen species are induced in fibroblast-like synoviocytes after exposure to monosodium urate crystals. The NLRP3 inflammasome also plays a crucial role in the production of inflammatory cytokines such as interleukin-1β (IL-1β) and IL-18 released from mononuclear cells stimulated by uric acid [22]. These inflammatory cytokines are also important molecules in the understanding of OA pathogenesis. Denoble et al. [11] showed the correlation of synovial IL-1β and IL-18 produced by NLRP3 inflammasome activation with OA severity assessed by plain radiography and/or bone scintigraphy. In addition, Zheng et al. [23] demonstrated that MSU crystals induced NLRP3 inflammasome-mediated IL-1β production in human fibroblast-like synoviocytes.
During uric acid metabolism, renal excretion of uric acid is determined by multifactorial mechanisms including genes related to urate renal transporters, concurrent medications, and comorbidities [2425]. Along with serological biomarker studies related to OA, many biomarkers such as urinary C-terminal cross-linking telopeptide of type I collagen (CTX) and N-terminal cross-linking telopeptide of type I collagen-1 (NTX-1) have been identified in urine [3456]. Although the relationship between serum uric acid and OA has been confirmed in some studies, urinary uric acid has not been confirmed as a biomarker of OA.
To date, there have been few studies on the relationship between urinary uric acid and OA. Previous studies demonstrated that the uric acid to creatinine ratio may be a more reliable value of renal uric acid excretion, replacing the need for a 24-hour uric acid excretion measurement [2627]. In the present study, we used spot urine uric acid and urine uric acid/creatinine ratio. We observed a significantly lower spot urine uric acid level in patients with knee OA compared to healthy controls, although the urine uric acid/creatinine ratio was not different between the two groups. Interestingly, the urine uric acid/creatinine ratio in patients with K-L grade III knee OA was significantly higher than that with K-L grade I (p=0.043), whereas serum uric acid did not vary according to K-L grade. Thus, urine uric acid/creatinine tended to be lower in patients with synovial hypertrophy compared to those without synovial hypertrophy, but this result did not reach statistical significance (p=0.055).
We are currently unable to explain why the urine uric acid level was much lower in knee OA patients, but considered several possibilities. First, the synovial fluid to serum uric acid ratio in OA is higher compared to other inflammatory arthritis diseases such as RA and AS [12]. It can be assumed that uric acid is more involved in inflammation within the joints rather than shifting to urinary excretion. In addition, some NSAIDs such as piroxicam and naproxen induce decreased renal excretion of uric acid [28]. In this study, we only analyzed patients who had not taken therapeutic NSAIDs in the two weeks prior to enrollment. However, the possibility that renal uric acid excretion was reduced by other therapeutics against hypertension or diabetes should be investigated in future studies.
The K-L grading scale takes into consideration pathogenic changes in cartilage and bone within affected joint in OA [16], and it can be inferred that cartilage damage progresses with increasing K-L grade as assessed by plain radiography. Recent experimental studies demonstrated that uric acid within the joint might contribute to aggravation of cartilage damage in OA. In addition, Chhana et al. [29] demonstrated that MSU crystals suppress viability of primary human chondrocytes by reducing expression of type II collagen and the cartilage matrix protein aggrecan and enhancing expression of the degradative enzymes ADAMTS4 and ADAMTS5. Consistently, MSU crystals induce cellular death of chondrocytes through autophagy by inhibiting phosphorylation of the Akt/mTOR signaling pathway [30]. Considering that urine uric acid level can reflect the amount of uric acid in the whole body, our results demonstrating higher urine uric acid/creatinine ratio in advanced radiographic progression and cartilage degradation (Figure 2 and Table 3) may offer an explanation for the association between urine uric acid metabolism and OA.
The K-L grading scale of OA based on plain radiography is the most commonly used scale of OA progression and is considered an acceptable measure of severity of knee OA. Radiographs also offer the considerable benefit of being able to identify bony abnormalities and structural alignment. In addition to radiography, clinical applications of MSUS have recently been used to improve detection of pathologic abnormalities for articular cartilage, synovial recess, meniscus, and periarticular soft tissue [1819]. The relationship between uric acid and OA is traditionally based on plain radiography as a gold standard imaging tool. However, some studies have investigated the degree of inflammation and severity in OA by MRI or bone scan [1011]. Consistent with a prior study showing that serum uric acid correlates with MRI-measured synovial volume [10], we found that serum uric acid level correlates with the presence of synovial hypertrophy as detected by MSUS. These results suggest that MSUS may be useful as an imaging tool to investigate novel biomarkers related to the pathogenesis of OA.
There were some limitations of the present study. First, although our results suggested a correlation between uric acid in serum and urine and ultrasonographic and radiographic findings, the size of the study population was too small to sufficiently verify this result. Second, our investigation of relationships between ultrasonographic or radiologic findings and uric acid levels was performed only as a cross-sectional study. Therefore, prospective studies are needed to determine whether this technique can predict structural and anatomical changes in knee OA. A third limitation of our study was that we did not measure uric acid in the joint fluid. It is necessary to study whether uric acid plays a direct role in the development of OA or simply secondary phenomenon detected by MSUS.
CONCLUSION
In conclusion, we observed a significant association between serum uric acid and synovial inflammation measured by MSUS in knee OA. In addition, urine uric acid/creatinine, reflecting urine uric acid excretion per day, was closely associated with cartilage damage measured by MSUS and radiographic OA progression. The results of our study suggest that uric acid levels detected in serum and urine might be associated with pathogenesis of OA and may also be important indicators of the severity and activity of OA.
 XML Download