

 PDF
PDF Citation
 Print
Print


INTRODUCTION
Identifying human immunodeficiency virus (HIV) infection epidemiology plays a crucial role in HIV infection control. The burden of HIV infection can be estimated based on the number of incident cases and that of acquired immune deficiency syndrome (AIDS) patients during a certain period.12 Many countries have been running HIV surveillance programs to identify HIV epidemiology.34 However, it is very costly to develop such a surveillance system, and the access to protected health information is often restricted.
The Korean Center for Disease Control (KCDC) has the legal right to access reports of all HIV positive cases. This means the number of confirmed HIV infections nationwide can be more exactly identified. However, it may be no easy task to estimate the total number of HIV infections or time to diagnosis because KCDC data contain a large number of patients with unknown CD4 positive cell counts. Alternatively, claims data can be used to identify HIV infection epidemics. In the Republic of Korea, the annual numbers of new HIV infections and AIDS patients are currently calculated using the national health insurance claims data and antibiotic prescriptions recommended for patients at risk of opportunistic infections.
This study was conducted to estimate the total HIV burden in Korea, including the proportion of undiagnosed HIV-infected people and the pre-diagnosis elapsed time. The number of people living with human immunodeficiency virus (PLHIV) and AIDS patients was confirmed by nationwide claims data of the Korean National Health Insurance System.
METHODS
Study design
This cross-sectional study used the nationwide claims data to identify the number of patients visiting health facilities and those suffering from HIV/AIDS through diagnosis codes and prescription records. The total number of PLHIV, including undiagnosed cases, was estimated using the annual number of incident cases visiting health facilities and the annual number of AIDS patients. The HIV modeling program was used to estimate the total number of HIV infections, including undiagnosed ones, and time to diagnosis.567
Data source
Since 2000, the National Health Insurance Service in the Korea has covered its entire population. Health facilities are responsible for submitting claims for insurance reimbursement. As health care related to HIV infection is covered by this insurance system, all healthcare information, including nationwide epidemiological data, can be identified through the claims data.8 Data from 2007 to 2015 were analyzed and data from 2009 to 2015 were used for the study.
Definitions
HIV infection is defined as an HIV-related diagnosis using the International Statistical Classification of Diseases and Related Health Problems, 10th Revision, Clinical Modification (ICD-10 CM) guidelines for HIV/AIDS with essential laboratory HIV infection tests (T cell subset, HIV RNA quantification, and HIV drug resistance mutation). If having more than three screening tests (or also known as HIV antigen/antibody tests) performed, patients were considered to receive treatment protocols, such as pre- or post-exposure prophylaxis, other than HIV treatment. These cases were excluded from the study population.
AIDS is defined as HIV infection with an AIDS-defining illness by a diagnosis or HIV infection with a prophylactic-antibiotics prescription for patients with CD4 positive T cell < 200/mm3. Antibiotic prophylaxis is defined as a prophylactic dose of trimethoprim/sulfamethoxazole or dapsone; those medications are recommended for patients with CD4 positive T cell < 200/mm3 in the international guidelines for the prevention of HIV opportunistic infections.9
Patients visiting a health facility for the very first time between 2009 and 2015 were included in the study after excluding all existing patients in the 2007–2008 period.
Statistical analysis
The number of new patients who visited hospitals each year from 2009 to 2015 and that of AIDS patients were used to estimate the total number of HIV infections, including undiagnosed infections, and the time to diagnosis. While there are several statistical methods used to estimate HIV prevalence, including back-calculation methods that implement an estimated incubation time, extrapolation using a quadratic spline function of time, and weighted least squares,210 back-calculation techniques have mainly been used in developed countries with reliable data on the number of AIDS diagnoses over time, and data on the distribution of the incubation period. More recently, extended back-calculation methods have been developed to overcome some of the shortcomings of the original methods. These new methods allow for the modification of parameters to account for the use of antiretroviral therapy and utilize more information about people with AIDS than has been utilized previously.11 In this study, we used the European Centre for Disease Prevention and Control (ECDC) HIV Modeling Tool (Version 1.3.0; Stockholm, Sweden: European Centre for Disease Prevention and Control, 2017), which is an extended back-calculation modeling program that only requires the following: 1) HIV surveillance data in order to estimate the number of PLHIV, including those with undiagnosed infections; 2) the annual incidence of HIV infection; 3) the average time between infection and diagnosis; and 4) the number of people in need of treatment according to their CD4 counts.12 Of the two methods provided by the modeling tool, we used the incidence method, which requires more data but provides more details than the alternative method. This method uses a mathematical model to estimate the annual number of HIV infections, probability of being diagnosed with HIV according to CD4 count, and time between infection and diagnosis13 and requires surveillance data collected over multiple years, preferably covering the full duration of the HIV epidemic in the country. This method works with, or without, data on CD4 counts at the time of HIV diagnosis and also works even if data on CD4 counts are not available for some periods. We used the following data for modeling projections: the total number of HIV diagnoses per annum and annual number of cases of AIDS based on either an AIDS diagnosis or a CD4 cell count < 200 cells/mm3 at the time of diagnosis.
The model is a deterministic compartmental model that describes HIV progression in the absence of antiretroviral treatment as a unidirectional flow through the different stages of the infection (Fig. 1).13 The model estimated the HIV incidence and time to diagnosis simultaneously. All PLHIV were assumed to have experienced an acute infection phase. The results of individual CD4 cell counts were not available in the claims data, and individuals with a CD4 cell count < 200 cells/mm3 at the time of diagnosis were identified using prescription records of prophylactic antibiotic agents that are prescribed when these counts are < 200 cells/mm3.
Fig. 1
Structure of the model. The incidence of HIV infection for calendar time t is represented by I(t). Immediately after infection, all individuals enter the primary stage of infection. After primary infection, the individual enters one of four AIDS-free CD4 compartments of undiagnosed HIV infection at the rate of fi qP. The sum of fi equals 1. In the absence of treatment, the individual will continue to the next compartment at a rate of qi (i = 1, 2). During each stage, except the primary infection stage, the individual can be diagnosed with HIV infection at a rate of di(t). This figure is a modified version of a figure of van Sighem et al.13
HIV = human immunodeficiency virus, AIDS = acquired immune deficiency syndrome.
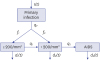
The estimation period was defined as the 20-year period between 2000 and 2020, and the diagnostic method was assumed to remain unchanged during this period. The mean undiagnosed duration, tdiag, when the time of infection was calculated as the sum of the average duration of all possible pathways in Fig. 1 from infection to each of the three stages of diagnosed HIV infection, was weighted by the probability of taking each pathway. The ECDC HIV modeling tool that was used for the estimation analysis assumed a Poisson distribution. Subgroup analysis of sex and three age groups (teenagers, 20–40 years old, and ≥ 50 years old) was performed in the same way. The proportion of patients visiting health facilities by year was calculated by comparing the number of patients from claims data and the estimated number of prevalent cases. Incidence data were analyzed using the statistical software SAS Enterprise Guide, version 6.1 (SAS Institute, Inc., Cary, NC, USA).
RESULTS
A total of 11,381 people were diagnosed with HIV infection from 2007 to 2015 (Table 1), of whom, 7,033 new HIV cases were identified in the 2009–2015 period, including 2,899 AIDS patients (41.2%). Men outnumbered women, accounting for 90.9% (n = 6,390). In 2009, 873 PLHIV visited health facilities for the very first time, while the figure for 2015 was 995 PLHIV (Table 2). AIDS patients constituted 33.9%–52.7% each year.
Table 1
Annual hospital visits of people living with HIV/AIDS in Korea by age
Table 2
Annual initial hospital visits of people living with HIV/AIDS in Korea by age
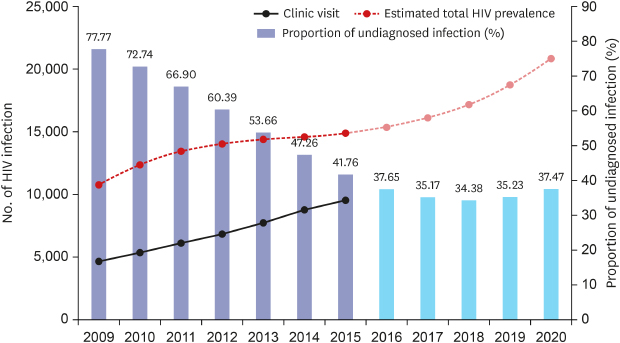
The total number of prevalent cases was estimated to be 10,753 in 2009, gradually rising to 14,880 in 2015 (Table 3). The proportion of patients visiting the hospital also increased, from 42.9% (4616/10,753) in 2009 to 64.1% (9,544/14,880) in 2015. In 2009–2015 period, the estimated number of new HIV infections decreased from 2,081 to 305. During this same period, the number of undiagnosed patients decreased from 8,363 (77.77%) to 6,215 (41.76%). Compared to claims data, the incidence of newly diagnosed HIV infections remained at approximately 1,000 per year during this period.
Table 3
Estimated number of HIV infections in Korea
The total number of prevalent HIV cases was estimated to increase steadily to 20,839 by 2020, and the prevalence of undiagnosed HIV infections was projected to decrease to 37.5% by this same year. A mean of 6.96 years was the duration between HIV infection and diagnosis.
When analyzed by sex and age groups, the proportion of undiagnosed HIV infections was slightly higher in men than that in women, and higher in people aged ≥ 50 years than in teenagers (Table 4). Moreover, time to diagnosis was also longer in men (6.98 years), compared to that in women (6.59 years). By age group, the figures for teenagers, those in their 20–40s and people aged ≥ 50 years were 4.03 years, 6.76 years, and 7.72 years, respectively.
Table 4
Estimated undiagnosed proportion of HIV infections in Korea by age and gender
DISCUSSION
In this study, the number of nationwide prevalent HIV infection was estimated to be 14,880 in 2015, and proportion of undiagnosed people decreased from 77.8% in 2009 to 41.8% in 2015. It took a mean of 6.96 years for a patient to have HIV infection diagnosed. This is the very first estimation of the total prevalent HIV cases, including undiagnosed ones, and time to diagnosis in the Korea.
In major developed countries, such as the United States and European countries, the diagnostic rate of HIV infection was at least 85%,131415161718 much higher than that in our study. A Japanese study using mathematical estimation methods also reported that about 80% of PLHIV were diagnosed.19 This might explain the gradual increase in the total HIV prevalence, while HIV incidence has been declining globally since 1996, and the Republic of Korea had a large proportion of late diagnoses.32021
The reason for the low diagnostic rate in Korea might be due to the lack of voluntary testing. A vigorous voluntary test is required for high diagnostic rates and early diagnoses. However, the KCDC data indicated that only a small proportion of cases in the Korea was confirmed by voluntary tests (20.8%; 210/1,009).21 The number of patients who were screened for HIV infections after being diagnosed with certain diseases (33%; 333/1,009) was higher than that of patients who were screened through voluntary testing while being asymptomatic. This implied that they were more likely to have advanced HIV infection and be accompanied by opportunistic infections. Particularly in Korea, the HIV prevalence was as low as 0.02% of the national population (about 12,000/50 million people); hence, physicians should pay additional attention to suspected HIV infections if patients do not provide them with any information to suspect HIV infection.
In this study, the proportion of newly diagnosed AIDS among the incident HIV cases in Korea decreased from 52.7% (460/873) to 33.9% (337/995) during the study period. These results are comparable to those of the United States or China, but still higher than the European results. The World Health Organization European Region reported that the proportion of AIDS patients in Europe in 2017 was 9.2% (14,703/159,420).4 In the United States, AIDS patients accounted for 46.0% (17,604/38,281) of all newly diagnosed PLHIV in 2017.22 In China, the proportion in 2013 was estimated to be 56.4% (27135/48145).23
Explanations for the difference in time to diagnosis between men and women remain unclear. Possibly, women were more likely to visit the hospital, or conversely, men were at high risk of HIV infection, for example, men who have sex with men might be reluctant to visit health facilities due to their fear of stigma. Another possibility is that older patients tended to delay their HIV infection diagnosis because they are less likely to suspect themselves to have sexually transmitted infections than younger patients. The US Preventive Services Task Force Recommendation Statement recommends routine HIV screening be applied to 15- to 65-year-old people unless their HIV prevalence was documented to be < 0.1%.24 Active routine screening would help shorten the duration to diagnosis in older cases with unexpected HIV infection.
There are few published reports on estimates of the number of PLHIV in Korea. A projection published in 1996 estimated that the cumulative prevalence of infected individuals in Korea would rise to 5,800 in 2000 based on the KCDC annual data for the period 1985–1995.25 The prevalence of HIV infection in 2000 was estimated to be 572–2,313 according to the assumptions made regarding the HIV epidemic in Korea in this study. The prevalence of HIV infection in 2000 was estimated using the EpiModel program developed by the World Health Organization. Over the period of approximately 20 years, the hypothesis of this model, e.g., the average survival time after diagnosis with AIDS, has changed, and the relative proportion of cases according to risk group has also changed. Therefore, it is necessary to modify the estimation model to adapt it to the changed medical situation. Later, using the back-calculation model, Lee et al.26 estimated the cumulative number of PLHIV to be 708–1,980, which is 1.4–4.0 times the number of diagnosed PLHIV, using 496 diagnosed PLHIV from 1991 to 1996. This study was published in 2002 and is also > 15 years old. The back-calculation method using the number of AIDS patients is limited to reflect the antiretroviral therapy era; this study used an extended back-calculation model with the addition of HIV incidence.11 We could not find a direct estimation in a recent report; however, a few reports cited estimations from organizations such as Joint United Nations Programme on HIV/AIDS (UNAIDS).2728 An analysis of data from a multicenter HIV cohort comprising approximately 10% of PLHIV in Korea described epidemiological characteristics such as opportunistic infections and metabolic complications of PLHIV in Korea293031 but did not estimate the total number of PLHIV in Korea.
This study had certain limitations. First, it used secondary claims data. Although we were cautious with developing disease definitions, these estimates may not reflect the true HIV situation in Korea. However, using KCDC reports, based on laboratory HIV test results, the annual HIV incidence can be determined, but the number of people with AIDS cannot be determined due to a considerable amount of missing data regarding CD4 cell counts.14 The difference determined using the claims data and KCDC data was found to be approximately 10%. This might be interpreted as being due to a time gap between diagnosis and linkage-to-care. Individuals who were lost to follow-up for longer than the window period might be considered newly diagnosed cases. Data on foreign participants might also be another reason for the difference. Foreigners constitute approximately 10% of PLHIV in Korea, and their data are included in the claims data but not in the KCDC Korean reports. Second, the estimates in this study were based on the assumption that all patients were diagnosed with the same HIV-1 subtype. This means that we did not consider HIV-1 subtype variability to estimate the time to diagnosis from the annual number of AIDS patients. The subtype influences decline rates of CD4 positive cell counts.32 However, most strains are known to be HIV-1 B clade in Korea.33
This is the very first study to estimate the total number of HIV infections, including undiagnosed patients, from the nationwide numbers of PLHIV and AIDS patients using health insurance data with diagnoses and prescription records. Claims data can be used to identify the total number of HIV/AIDS patients visiting health facilities, thereby estimating the number of undiagnosed cases.
 XML Download