

 PDF
PDF ePub
ePub Citation
 Print
Print


INTRODUCTION
Diabetes mellitus is one of the most common metabolic disorders and has an increasing prevalence worldwide. Several new classes of agents, including glucagon-like peptide 1 (GLP-1) agonists, dipeptidyl peptidase-4 (DPP4) inhibitors, and sodium-glucose cotransporter 2 (SGLT-2) inhibitors, have been introduced and demonstrated a dramatic increase in their use, whereas the older treatments continue to be replaced or supplemented by newer therapies [1].
Among the various classes of antihyperglycemic agents, metformin remains the optimal agent as the initial medication because of its low cost, proven safety record, weight neutrality and possible benefits on cardiovascular outcomes. Regarding second- and third-line agents, the American Diabetes Association/European Association for the Study of Diabetes (ADA/EASD) and the American Association of Clinical Endocrinologists/American College of Endocrinology (AACE/ACE) recommend an individualized approach, considering the medication efficacy, side effects, costs and potential weight change, rather than a one-size-fits-all approach [23].
α-Glucosidase inhibitors have been widely prescribed as a monotherapy or as a combination with other oral antihyperglycemic medications in Asian countries [45], where postprandial hyperglycemia is known to be a predominant or equally important contributor to excess hyperglycemia in type 2 diabetes mellitus (T2DM) [6]. Furthermore, DPP4 inhibitor and α-glucosidase inhibitor combination therapy represents an attractive treatment option by inhibiting the rapid elevation of postprandial blood glucose levels without excessive insulin secretion, and potentiation of active GLP-1 secretion [7]. Previously, the synergistic effects of an α-glucosidase inhibitor and DPP4 inhibitor on plasma insulin and active GLP-1 levels were reported in mice [89]. In clinical studies, DPP4-inhibitor add-on therapy with the α-glucosidase inhibitor [10111213] or α-glucosidase inhibitor add-on therapy with the DPP4 inhibitor [141516] have been shown to improve glycemic control and stabilize glucose fluctuation [14] in patients with T2DM.
However, the effect of acarbose as a third-line therapy in subjects who are poorly controlled with metformin and DPP4-inhibitor has less been evaluated. In the present study, we evaluated the efficacy and safety of adding acarbose in Korean patients with T2DM who showed an inadequate response to metformin and sitagliptin dual combination therapy.
METHODS
Study population
This study was conducted as a multicenter, 24-week, double-blinded, randomized, placebo-controlled study in five institutions throughout Korea. The subjects were eligible for this study if they had T2DM, were aged 20 to 80 years, had been taking stable doses of metformin (≥1,000 mg/day) and sitagliptin for at least 12 weeks, and had glycosylated hemoglobin (HbA1c) 7.0% to 10.0%. The exclusion criteria were abnormal renal function (serum creatinine >133 µmol/L for men and >124 µmol/L for women), abnormal liver function (aspartate transaminase or alanine transaminase ≥2.5 times the upper limit of normal) and a history of acute or chronic metabolic acidosis, congestive heart failure requiring treatment or showing New York Heart Association class III/IV dyspnea, inflammatory bowel disease, intestinal ulcer, enterostenosis or chronic enteric disease. The participants who had a history of myocardial infarction, unstable angina, coronary artery bypass graft surgery within 6 months or malignancy within 5 years were also excluded from the study.
Study design
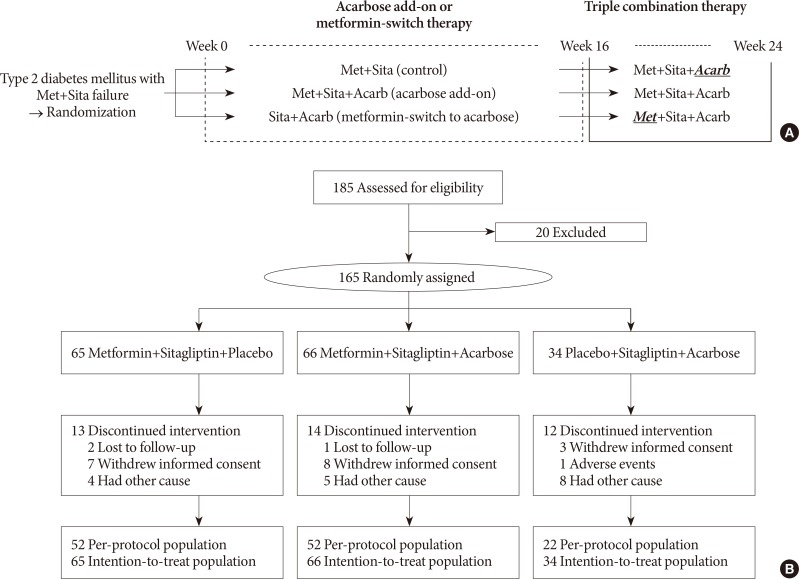
The eligible participants were randomized and assigned at a ratio of 2:2:1 to the following groups: the metformin, sitagliptin, and acarbose placebo (Met+Sita) group; metformin, sitagliptin and acarbose (Met+Sita+Acarb) group; or metformin placebo, sitagliptin and acarbose (Sita+Acarb) group. In Sita+Acarb group, metformin was switched to acarbose; the average dose of metformin was 1,330 mg before week 0, and the same doses of metformin were added-on at week 16 in each individual. The subjects who received DPP4 inhibitors other than sitagliptin (saxagliptin, n=44; vildagliptin, n=12; linagliptin, n=5; gemigliptin, n=1) were switched to sitagliptin 100 mg once a day. Acarbose or its placebo was prescribed an initial dose of 50 mg twice a day for the first 2 weeks, then 50 mg three times a day for the next 2 weeks and subsequently 100 mg three times a day until the end of the study period. This initial treatment was maintained for 16 weeks (acarbose add-on or metformin-switch therapy), followed by an 8-week treatment with metformin, sitagliptin, and acarbose triple combination (triple combination therapy) in all three groups (Fig. 1).
Meal tolerance tests (MTTs) were performed in a single institution at baseline and week 16 in the Met+Sita and Met+Sita+Acarb group. The participants ingested two caloric bars (268 kcal) (Soyjoy; Otsuka Pharmaceutical, Tokyo, Japan) and one caloric drink (200 kcal) (Newcare; Daesang Welllife, Seoul, Korea), and blood samples were obtained at 0, 30, 60, 90, and 120 minutes during the MTT. The continuous glucose monitoring system (CGMS) was applied (MiniMed; Medtronic Inc., Northridge, CA, USA) to monitor glucose fluctuations at baseline and week 16 in the three groups from a single institution. All of the participants were instructed to check self-monitor their blood glucose (SMBG) levels seven times per day (before each meal, 2-hour after each meal and at bedtime) at week 16 and 24. This study was registered at Clinicaltrials.gov (NCT01490918).
Efficacy and safety assessment
The primary objective was to compare the changes in HbA1c between baseline and week 16 in the Met+Sita and Met+Sita+Acarb group. The secondary objectives were to compare the changes in HbA1c between Met+Sita and Sita+Acarb group, and to evaluate the changes in body weight, waist circumference, systolic and diastolic blood pressures, fasting and postprandial 2-hour glucose, total cholesterol, triglyceride, high density lipoprotein cholesterol, low density lipoprotein cholesterol (LDL-C), and C-reactive protein (CRP) in three groups.
The plasma glucose, insulin and glucagon levels were measured using samples obtained during the MTTs. The area under the curve (AUC) of glucose, insulin and glucagon was calculated using the trapezoid method. The homeostasis model assessment of β-cell (HOMA-β) and insulin resistance (HOMA-IR) were calculated using the glucose and insulin values obtained during MTT as following equations, respectively: [20×fasting insulin (µU/mL)]/[fasting blood glucose (mmol/L)−3.5)]; [fasting blood glucose (mmol/L)×fasting insulin (µU/mL)]/22.5. The insulinogenic index was calculated as follows: [30-minute insulin (µU/mL)−fasting insulin]/[30-minute glucose (mg/dL)−fasting glucose].
The CGMS parameters were calculated from each CGMS output, which was extracted using the CGMS 3.0 software package (Medtronic Minimed, MMT-7310 version 3.0 C [3.0.128]). The mean±standard deviation (SD) and coefficient of variance (CV) of glucose were calculated using all of the consecutive sensor readings measured at 5-minute intervals over 3 days. The mean amplitude of glycemic excursion (MAGE) was used to assess the intraday glucose variability. MAGE was calculated by measuring the arithmetic mean of the differences of the consecutive peaks and nadirs that were larger than the SD [17].
Every adverse event (AE) was monitored and recorded regardless of the intensity or cause. All of the abnormalities identified in the clinical laboratory tests, which included serum chemistry, hematology, and urine tests, were recorded. The durations of the AEs and the follow-up actions were also recorded.
Statistical analyses
The sample size calculation is based on the normal approximation of the test statistic for comparing two means assuming a mean difference of 0.6% [18], a standard deviation of 1.27%, a power of 80%, a two-sided significance level of α of 0.05 and a drop-out rate of 15%. A total of 165 subjects were required for Met+Sita group and Met+Sita+Acarb group. The Sita+Acarb group was an exploratory assessment and therefore smaller number of participants was assigned without formal statistical calculation. All of the data are expressed as the mean±standard error values or as numbers with proportions. The differences in the baseline characteristics among the three groups were determined using analysis of variance or the chi-square test for the normally distributed variables and the Kruskal-Wallis test or Fisher's exact test for the variables with skewed deviations. The between-group differences in the HbA1c changes from baseline to week 16 or from week 16 to 24 were assessed by analysis of covariance using baseline HbA1c as a covariate. The paired t-test or Wilcoxon signed rank test was used to assess the intra-group differences of the measurements between the baseline and week 16 or 24. For the safety analysis, all of the randomized patients who received at least one dose of the investigational product and attended a visit afterward were included in the study. The last observation carried forward was applied for the patients who withdrew in the middle of the study. All of the hypotheses were assessed at the two-tailed 5% level of significance. The subjects are assigned to three groups at the ratio of 2:2:1 and the block randomization were applied. The random allocation was performed by a statistician having no a stake in this study using SAS version 9.1.3 software (SAS Institute Inc., Cary, NC, USA). The SAS version 9.2 software (SAS Institute Inc.) was used to perform the statistical analysis. All analyses were performed in the intention-to-treat population.
Ethics
Every patient who participated in this study provided his or her written informed consent. The study was approved by the independent Institutional Review Board of each study center (XC11MINT0108K). The study was conducted in accordance with the ethical principles of the Declaration of Helsinki.
RESULTS
Baseline characteristics
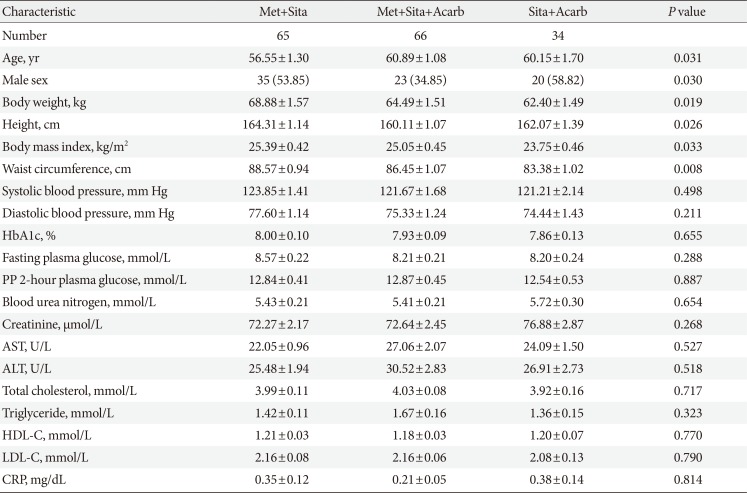
Among 185 subjects, 20 subjects were excluded and 65, 66, and 34 subjects were randomly assigned to the Met+Sita, Met+Sita+Acarb, and Sita+Acarb group, respectively (Fig. 1). The number of patients who completed the entire study were 52, 52, and 22 in the Met+Stia, Met+Sita+Acarb, and Sita+Acarb group, respectively. The mean age, male proportion, body mass index (BMI), and waist circumference differed among the three groups (Table 1). The mean±standard error values of the baseline HbA1c were 8.00%±0.10%, 7.93%±0.09%, and 7.86%±0.13% in the Met+Sita, Met+Sita+Acarb, and Sita+Acarb group, respectively (P=0.655). Other variables, including the liver function test and lipid parameters did not show significant differences among the three groups.
Primary objectives
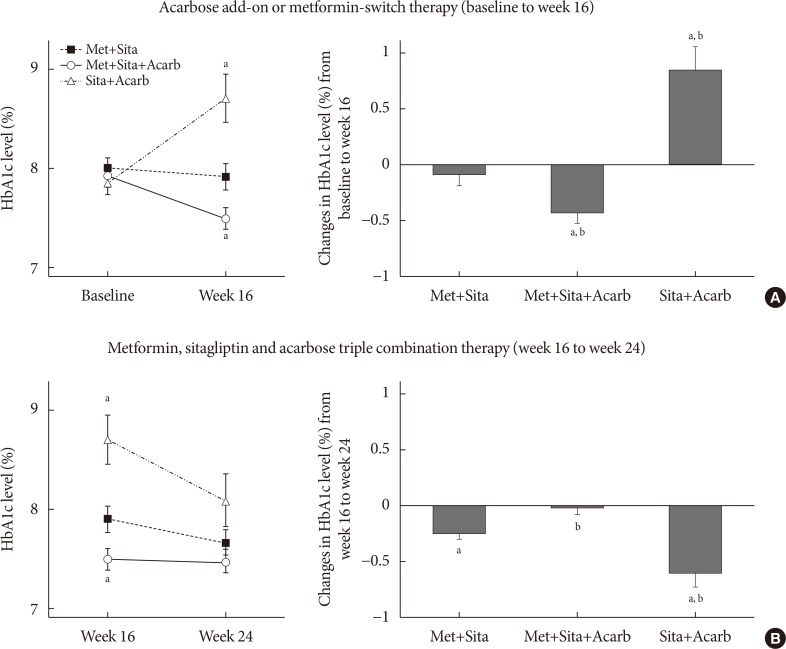
After 16 weeks of acarbose add-on therapy, the HbA1c levels reached 7.91%±0.13% and 7.49%±0.11%, and the HbA1c changes compared to the baseline values were −0.09%±0.10% (P=0.113) and −0.44%±0.08% (P<0.001) in the Met+Sita and Met+Sita+Acarb group, respectively (Fig. 2). After maintaining metformin, sitagliptin, and acarbose triple combination therapy from weeks 16 to 24, the HbA1c levels demonstrated 7.66%±0.13% and 7.47%±0.12% in the Met+Sita and Met+Sita+Acarb group, respectively (P=0.321, Met+Sita vs. Met+Sita+Acarb group). The HbA1c changes compared to week 16 were −0.25%±0.05% (P<0.001) and −0.03%±0.05% (P=0.429) in the Met+Sita and Met+Sita+Acarb group, respectively. Analyses of the per-protocol-population did not attenuated these results (Supplementary Table 1).
Secondary objectives
After metformin-switch therapy in Sita+Acarb group, HbA1c level increased by 0.84%±0.21% (P<0.001) and reached 8.71%±0.25% at week 16 (Fig. 1). After maintaining metformin, sitagliptin, and acarbose triple combination therapy from weeks 16 to 24, HbA1c decreased by 0.61%±0.12% (P<0.001) and demonstrated 8.09%±0.27% (P=0.267, Met+Sita vs. Sita+Acarb group) in Sita+Acarb group.
At week 16, the body weight of the enrolled subjects significantly decreased by 2.02±0.85 kg (P<0.001) and 1.26±0.87 kg (P=0.019) in the Met+Sita+Acarb and Sita+Acarb group, respectively, but not in the Met+Sita group (P=0.770) (Supplementary Table 2). Compared to the baseline values, the fasting plasma glucose decreased by 0.57±0.15 mmol/L (P<0.001) in the Met+Sita+Acarb group and increased by 1.80±0.38 mmol/L (P<0.001) in the Sita+Acarb group. The postprandial 2-hour glucose level decreased by 1.50±0.42 mmol/L (P<0.001) in the Met+Sita+Acarb group and increased by 2.18±0.72 mmol/L (P=0.003) in the Sita+Acarb group at week 16 versus baseline. The intragroup changes in waist circumference, systolic and diastolic blood pressures, and LDL-C level were insignificant in the three groups at week 16 versus baseline. However, the triglyceride level increased by 0.25±0.08 mmol/L (P=0.002) and decreased by 0.21±0.09 mmol/L (P=0.014) in the Met+Sita+Acarb and Sita+Acarb group, respectively, at week 16 versus baseline.
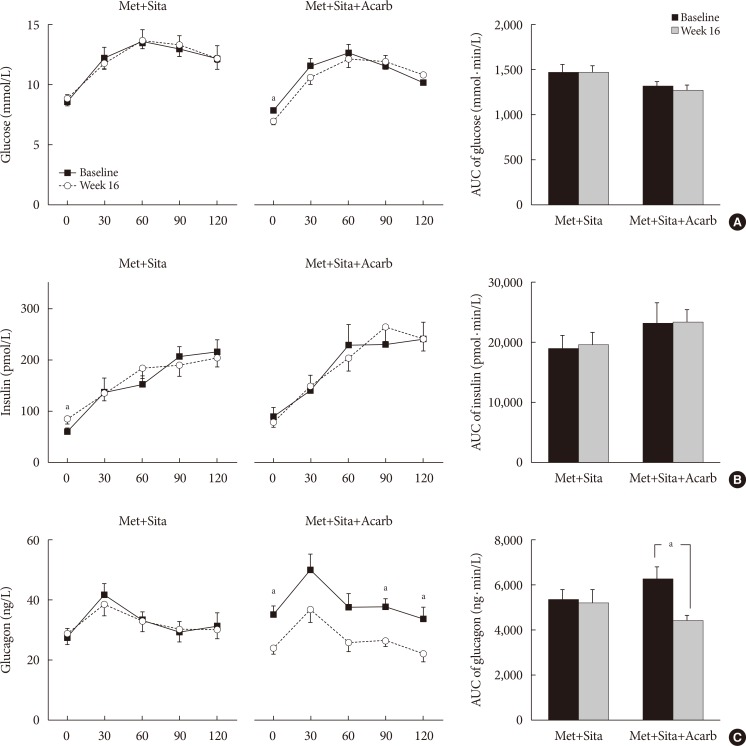
The MTTs were performed in 13 subjects from each of the Met+Sita and Met+Sita+Acarb group (Fig. 3). Except for the insulin level at 0 minute, the changes in the glucose, insulin and glucagon levels were insignificant at all of the time points in the Met+Sita group at week 16 versus baseline. In the Met+Sita+Acarb group, the glucose level at 0 minute was significantly lower at week 16 compared to the baseline value (7.76±0.26 mmol/L vs. 6.87±0.31 mmol/L, P=0.009). Although the insulin levels were similar at all time points, the glucagon level at 0, 90, and 120 minutes were significantly lower at week 16 compared to the baseline in the Met+Sita+Acarb group. In the Met+Sita+Acarb group, the AUC of glucagon significantly decreased at week 16 versus baseline (4,726.17±415.80 ng·min/L vs. 3,314.38±191.63 ng·min/L, P=0.004), which was not observed in the Met+Sita group (4,020.41±359.15 ng·min/L vs. 3,941.19±434.69 ng·min/L, P=0.426). The HOMA-IR significantly increased in the Met+Sita group (1.66±2.33, P=0.024), but not in the Met+Sita+Acarb group (−1.20±2.80, P=0.092) at week 16 versus baseline (Supplementary Table 3). There were no significant changes in HOMA-β and insulinogenic index between baseline and week 16 in both groups.
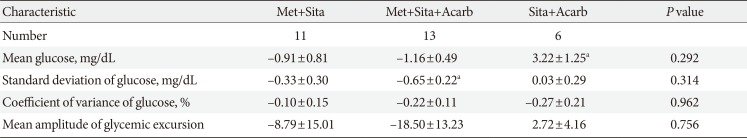
The CGMS measurements were obtained in 11, 13, and six subjects from the Met+Stia, Met+Sita+Acarb, and Sita+Acarb group, respectively (Table 2). The SD of glucose during the 72-hour CGMS monitoring significantly decreased in the Met+Sita+Acarb group at week 16 compared to the baseline value (P=0.013). Among the three groups, the changes in the mean, SD and CV values of the glucose level and MAGE were similar.
The SMBG levels were measured at weeks 16 and 24 in all of the subjects from three groups. Compared to the measurements in the Met+Sita group, the Met+Sita+Acarb group demonstrated lower values after lunch (10.28±0.37 mmol/L vs. 8.78±0.29 mmol/L, P=0.004) and after dinner (10.51±0.44 mmol/L vs. 9.14±0.33 mmol/L, P=0.013) at week 16. However, at week 24, the SMBG levels were similar at all time points in the subjects in the Met+Sita and Met+Sita+Acrab group. Compared to the SMBG levels in the Met+Sita group, the Sita+Acarb group demonstrated higher values at all time points at week 16. At week 24, the SMBG levels demonstrated similar levels between Met+Sita and Sita+Acarb group before breakfast, before and after lunch.
Baseline age, sex, body weight, BMI, and waist circumference significantly differed among three groups. However, further adjustment for age, sex, and BMI did not attenuated the original results, except for the changes in triglyceride level at week 16 (P=0.095) and CRP level at week 24 (P=0.711).
Safety profile
Among the 165 subjects in the safety analysis population, 14 (21.54%), 19 (28.79%), and 11 (32.35%) patients reported one or more AEs in the Met+Sita, Met+Sita+Acarb, and Sita+Acarb group, respectively. Adverse drug reactions (ADRs) were reported in nine (13.85%), 10 (15.15%), and three (8.82%) subjects in the Met+Sita, Met+Sita+Acarb, and Sita+Acarb group, respectively. Serious adverse effects (SAEs) were reported in two (3.08%, chest pain and lumbar spinal stenosis) and one patient (1.52%, spinal osteoarthritis) in the Met+Sita and Met+Sita+Acarb group, respectively. There were no significant differences in the prevalence of the AE, ADR, or SAE among the three groups. None of the SAE was related to the investigational agents.
DISCUSSION
In this study, the 16-week acarbose add-on therapy in patients with T2DM who were poorly controlled with metformin and sitagliptin significantly improved the HbA1c level, reduced the SD of glucose during the 72-hour CGMS and suppressed the glucagon secretion during the MTT. While switching metformin to acarbose initially worsened the blood glucose level, the metformin add-on therapy to the Sita+Acarb group effectively lowered the HbA1c level by 0.61%±0.12% in 8 weeks. The metformin, sitagliptin, and acarbose triple combination therapy was well tolerated and was not associated with treatment-related AEs.
Despite the good initial efficacy of the oral antihyperglycemic agents, patients with T2DM often require multiple antihyperglycemic agents to achieve glycemic control because of the progressive nature of diabetes mellitus [219]. Traditionally, the most common combination of oral antihyperglycemic agents used for patients with T2DM has been metformin and sulfonylurea [20]. Previous studies on the efficacy of oral antihyperglycemic agent triple combination therapy have been, for the most part, conducted with add-on therapy with metformin and sulfonylurea [21]. However, after the introduction of DPP4 inhibitor, the proportion of metformin and DPP4 inhibitor combination therapy has been increasing, reaching 20% to 40% of the total dual combination therapy in the United States [3]. In selecting a third agent added to metformin and DPP4 inhibitor, the ADA/EASD guidelines recommend selecting one of the agents among sulfonylurea, thiazolidinedione, SGLT-2 inhibitor or insulin, whereas other agents, including α-glucosidase inhibitor, are generally not favored because of their modest efficacy and frequency of administration [2]. However, considering the potential synergistic effect of α-glucosidase inhibitor and DPP4 inhibitor, this combination might be an ideal choice in T2DM. Especially, elderly subjects with high risk of hypoglycemia and high carbohydrate intake or postprandial hyperglycemia would be one of the optimal candidates for metformin, DPP4 inhibitor and α-glucosidase inhibitor triple combination.
Acarbose is known to reduce HbA1c by 0.7% to 0.8% in monotherapy [22] and by 0.6% when added to metformin monotherapy [23]. When used in combination, the majority of the antihyperglycemic agents reduced HbA1c to a lesser extent compared to monotherapy [23]. In our study, the acarbose add-on therapy to metformin and sitagliptin reduced HbA1c by 0.44%±0.08%. Unfortunately, no direct comparison of acarbose with other antihyperglycemic agents in combination with metformin and DPP4 inhibitor is available, and the efficacy of acarbose as a third-line therapy warrants additional clinical trials.
α-Glucosidase inhibitors block the decomposition of disaccharides by inhibiting α-glucosidase in the brush border of small intestinal mucosal epithelial cells [24]. As a result, sugars that are primarily absorbed in the upper small intestine are absorbed more slowly through the entire small intestine, which in turn, causes the relative suppression of glucose-dependent insulinotropic polypeptide (GIP) secretion from the K-cells in the upper small intestine, and enhances GLP-1 secretion from the L-cells in the lower small intestine [25]. In a murine model of diabetes, treatment with DPP4-inhibitor and α-glucosidase inhibitor elicited a 2.5- to 4.9-fold synergistic increase in active GLP-1 compared to the control [8]. In the subjects without T2DM, the AUC of the plasma active GLP-1 level increment was potentiated when miglitol and sitagliptin were used in combination (153% increase compared to the placebo) than when they were used as a monotherapy (38% and 78% increase after miglitol and sitagliptin monotherapy, respectively) [26]. In subjects with T2DM, the combination of miglitol and sitagliptin demonstrated additive effect on glycemic control and active GLP-1 level compared to miglitol monotherapy or sitagliptin monotherapy [27]. Furthermore, enhancement of active GIP by sitagliptin was abolished by combination therapy with miglitol. Unfortunately, we were unable to measure the active GLP-1 or GIP level, which might have provided more information on the likely synergistic effects of sitagliptin and acarbose.
A single administration or a 2-week treatment of acarbose failed to demonstrate significant changes in the plasma glucagon level during MTT in the subjects with T2DM [2829]. In a report by Kishimoto and Noda [30], the short-term co-administration of α-glucosidase inhibitor (miglitol) and DPP4-inhibitor (anagliptin) showed a tendency for suppressed glucagon secretion in four patients. Theoretically, GLP-1 reduces glucose levels through its potent insulinotropic action as well as by suppressing glucagon secretion [31]. It remains unclear whether GLP-1 suppresses glucagon secretion directly [32] or indirectly by other paracrine factors [31] or via the central and peripheral nervous systems [33]. Also, suppressed glucagon secretion in the Met+Sita+Acarb group might be due to the modulation of bile acid metabolism in the small intestine. Recent report by Gu et al. [34] demonstrated that acarbose modulated the composition of gut thereby changing gut bile acid composition, resulting improvement in metabolic parameters. Also, metformin has been proposed to increase GLP-1 secretion via modulation of bile acids [35]; inhibitory effect of metformin on bile acid reabsorption increases the luminal concentration of bile acids and stimulates Takeda G-protein receptor 5 (TGR5) on enteroendocrine L-cells, leading to increased GLP-1 secretion. Previous studies with a small number of participants have demonstrated insignificant changes in glucagon secretion after short-term treatment of α-glucosidase inhibitors [28293036]. However, in our study, the glucagon levels were suppressed after acarbose add-on therapy in the Met+Sita+Acarb group. Whether this effect is associated with changes in GLP-1 or GIP levels warrants additional evaluation.
While α-glucosidase inhibitors are known to have a neutral effect on body weight, there were moderate body weight reductions in Met+Sita+Acarb and Sita+Acarb group in our study. This finding is in line with those of previous other studies [4273738]. Reduced nutrient absorption, improved gut microbiota and prolonged stimulation of enteroinsulinar axis with decreased hyperinsulinemic response have been suggested as explanations for weight reduction effect of acarbose [437]. In a study with overweight (BMI ≥25 kg/m2) Japanese patient with T2DM [27], only those with miglitol and sitagliptin combination therapy, but not with miglitol or sitagliptin monotherapy, demonstrated reduced visceral fat mass and increased serum adiponectin level. This favorable effect on body fat composition was explained by potentiated increase in GLP-1 level and decreased or neutral effect on GIP level with the combination therapy.
The limitations of this study include a single ethnic group, and a small number of participants who performed MTT and CGMS. Only 13 participants in each group were able to perform MTT. Among the total subjects in the Met+Sita+Acarb group (n=66), fasting plasma glucose and postprandial 2-hour plasma glucose significantly decreased after 16 weeks of treatment. However, among subjects who performed MTT, the glucose level at each time point or AUC of glucose was similar between baseline and week 16 in the Met+Sita+Acarb group (n=13), except for the fasting glucose level. This discrepancy might be the consequence of relatively lower baseline HbA1c (7.93%±0.09% vs. 7.78%±0.13%) and fasting plasma glucose (8.21±0.21 mmol/L vs. 7.76±0.26 mmol/L) as well as the small number of enrolled participants who performed MTT compared to the total population. Bloomgarden et al. [39] demonstrated that irrespective of the medication class, the baseline glycemic status strongly influenced the efficacy of the antihyperglycemic agents. Therefore, further studies are required to confirm our study results. Yang et al. [4] reported that considerable carbohydrate intake was associated with a trend toward a greater HbA1c decrease in Chinese subjects treated with acarbose. Although the Korean diet is moving towards a Western dietary pattern, Koreans are still typically reported to consume an excessive amount of carbohydrate and less protein and fat [40]. Detailed information regarding the carbohydrate intake might be useful for understanding the efficacy of acarbose. Finally, one subject with past history of total gastrectomy was included in Met+Sita group. In subjects with gastrectomy, insulin and GLP-1 secretion or glucose variability may be altered. However, MTT and CGMS were not performed in this subject, and therefore we were unable to obtain these information.
In conclusion, a 16-week acarbose add-on therapy in subjects who were poorly controlled with metformin and sitagliptin effectively lowered the HbA1c levels by 0.44%±0.08% and was accompanied by suppressed glucagon secretion in the absence of excessive insulin secretion during the MTT. Although the substitution of acarbose for metformin worsened the blood glucose level, the add-on of metformin and the maintenance of a triple combination effectively reduced the HbA1c levels by 0.61%±0.70% as early as 8 weeks. Additionally, the metformin, sitagliptin, and acarbose triple combination therapy was generally well tolerated without AEs.
 XML Download