

 PDF
PDF ePub
ePub Citation
 Print
Print


INTRODUCTION
Sodium glucose cotransporter 2 (SGLT2) inhibitors are a new class of anti-diabetic drugs that lower the plasma glucose levels by inhibiting urinary glucose reabsorption from the proximal convoluted tubule [12].
Few studies to date have determined the predictive factors for a better glucose-lowering efficacy of SGLT2 inhibitors [345]. In a previous retrospective study of 302 people with type 2 diabetes mellitus (T2DM) treated with SGLT2 inhibitors alone or in combination for 3 months, the greatest glucose-lowering effect was observed in cases with a higher baseline estimated glomerular filtration rate (eGFR) and glycosylated hemoglobin (HbA1c) level. Moreover, the initial response to treatment was an independent predictor of glucose-lowering efficacy after SGLT2 inhibitor treatment [3]. In addition, a Japanese study in people with T2DM has reported an almost 50% decrease in the HbA1c-lowering efficacy with luseogliflozin in people with reduced renal function compared with normal function [4].
Notably, however, the clinical variables that predict better glucose-lowering efficacy after SGLT2 inhibitor treatment have remained largely unknown. Therefore, we aimed in our present study to identify the baseline clinical and biochemical variables that could effectively predict a better glucose-lowering response in T2DM after treatment with the SGLT2 inhibitor, ipragliflozin. We had a particular focus in this analysis on urinary glucose excretion (UGE). In addition, we sought to determine the changes in clinical and biochemical variables that are most closely associated with the reduction in HbA1c levels.
METHODS
Study design
The study protocol was approved by the Institutional Review Board of each participating center (IRB approval number of the central institution: 2016-0100 in Asan Medical Center) and complied with the Declaration of Helsinki and the International Conference on Harmonization Harmonized Tripartite Guideline for Good Clinical Practice. This was a 12-week phase IV, investigator-initiated, open-label, single-arm multicenter study conducted in four hospitals in the Republic of Korea. Informed written consent was obtained from all subjects prior to study participation. This study was registered at ClinicalTrials.gov (NCT02791035).
Participants
We screened 119 people who were treated for T2DM between June 2016 and March 2017. People aged 20 to 70 years with a HbA1c level of 7% to 9.5% at screening despite receiving stable doses of anti-hyperglycemic medications for at least the previous 8 weeks were eligible.
A sample size of at least 100 patients was required to ensure a power of 80% and the significance level of 5% to detect a correlation coefficient of 0.3 between changes in HbA1c and other variables, assuming a 15% drop-out rate [5].
Eligible people (n=107) received ipragliflozin and were followed up for 12 weeks for efficacy and safety assessments. Of those enrolled, 92 people (86%) completed the 12-week treatment.
Interventions
After a 1- to 3-week screening period, people received once-daily therapy (in the morning with water) with 50 mg ipragliflozin as an add-on to the background therapy during the 12-week treatment period. During the study period, vital signs and the results of physical examinations and laboratory tests including hematology, chemistry, plasma glucose, HbA1c, mixed meal test (Mediwell Diabetic Meal; Maeil Dairies Co., Seoul, Korea), morning spot urine and 8-hour overnight urine were collected at baseline and at the end of the study.
Rescue medications were initiated during the treatment period if the HbA1c level was ≥9.5%. A drug compliance level of below 70% was defined as non-compliance and these people were excluded from the per protocol analysis.
End points and assessments
The primary outcome measure of this trial was the correlation between the change in the HbA1c and in the UGE as measured using morning spot urine or 8-hour overnight urine samples after the 12-week treatment with ipragliflozin. Key secondary outcome measures after the 12-week treatment with ipragliflozin included: (1) correlation between the changes in HbA1c and other parameters (homeostasis model assessment of insulin resistance [HOMA-IR], homeostasis model assessment of β-cell function [HOMA-β], and insulinogenic index); (2) changes in the fasting plasma glucose, HbA1c, and body weights; and (3) percentage of people achieving the target HbA1c level of <7.0%.
Statistical analysis
Differences between groups and before and after treatment were evaluated using the student t-test or Mann-Whitney U test for continuous variables and the chi-square test for categorical variables. Multiple linear regression analysis was performed to identify variables that were independently associated with a change in the HbA1c level. Statistical analyses were performed using PASW version 18.0 (SPSS, Chicago, IL, USA). A P<0.05 was considered significant.
RESULTS
The mean age of these subjects was 56.5 years and the median duration of diabetes was 6 years. Almost all of the people received metformin prior to study participation (94.6%) and 78.3% (n=71) of these cases were receiving dual anti-hyperglycemic therapy. After a 3-month treatment with ipragliflozin, the body weight, waist circumference, blood pressure, and glucose levels were significantly decreased (all P<0.001) and the mean HbA1c levels were reduced from 7.6% to 6.9% such that 62.0% (n=57) of our study population reached a HbA1c target of <7.0%. In terms of pancreatic β-cell function, no changes were observed in the HOMA-β and insulinogenic index after treatment. However, HOMA-IR, a representative of insulin resistance, was significantly decreased (P<0.001). As expected, the UGE level in the spot urine and 8-hour overnight urine was increased (Table 1).
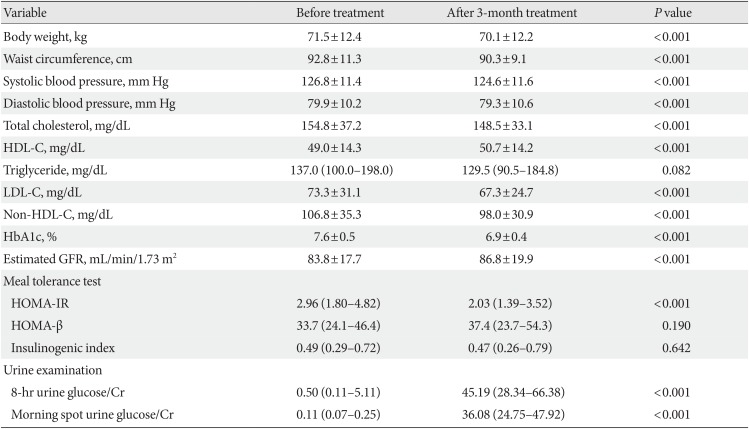
Table 1
Efficacy of a 3-month ipragliflozin treatment
Values are presented as mean±standard deviation or median (interquartile range).
HDL-C, high density lipoprotein cholesterol; LDL-C, low density lipoprotein cholesterol; HbA1c, glycosylated hemoglobin; GFR, glomerular filtration rate; HOMA-IR, homeostasis model assessment of insulin resistance; HOMA-β, homeostasis model assessment of β-cell function.
![]()
We next divided the study participants into two groups in accordance with a median HbA1c reduction of 0.7% and sought to determine which baseline variables better predicted the glucose-lowering efficacy of ipragliflozin treatment. We found however that no baseline variables, including the UGE level and eGFR, were associated with better hypoglycemic efficacy following a 3-month ipragliflozin treatment, other than a higher baseline HbA1c level (Supplementary Table 1).
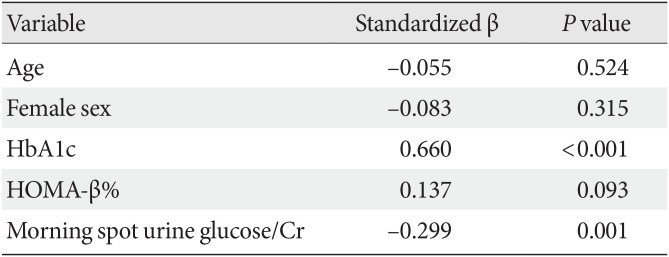
To determine if any variables were independently associated with a greater HbA1c reduction, multiple linear regression analysis was performed that included age and sex as well as variables found to be possibly related to the HbA1c reduction in simple linear regression analysis (Supplementary Table 2). The results indicated that a higher baseline HbA1c level and lower UGE were independent predictors of a better glucose-lowering effect of a 3-month ipragliflozin treatment (Table 2).
Lastly, Spearman correlation analysis was performed to determine the association between HbA1c reduction and changes in clinical and laboratory variables after ipragliflozin treatment, However, no variable including a UGE change was found to correlate with a change in the HbA1c level (Supplementary Table 3).
DISCUSSION
In our current single-arm multicenter prospective study of Korean people with T2DM, we found that a 3-month treatment with ipragliflozin decreased 0.7% of the mean HbA1c levels and that 62.0% of the people reached the HbA1c target of less than 7.0%. In addition, our analysis indicated that ipragliflozin treatment reduced not only body weight and blood pressure but also lipid parameters. A higher baseline HbA1c value was also an independent predictor for a greater reduction in the HbA1c level after ipragliflozin treatment. In addition, a lower baseline UGE independently predicted a better glucose-lowering efficacy of a 3-month treatment with ipragliflozin.
Previous studies have examined the relationship between the renal threshold for glucose reabsorption or UGE with SGLT2 inhibitor treatment and its glucose-lowering efficacy in people with T2DM [67]. In an earlier study of 20 Japanese people with T2DM, the UGE and blood glucose levels were measured before and several hours after a single dose of dapagliflozin, which was found to be more effective in younger people. The authors speculated that was because younger people have a higher UGE than older people and that this could be a marker for a better glucose-lowering response to an SGLT2 inhibitor [6]. Notably however, another Japanese study of 22 people with T2DM came to a different conclusion. In that report, the median improvement in HbA1c values after a 1-year treatment with ipragliflozin was −0.5% and there was a significant inverse correlation found between the renal threshold for glucose reabsorption and the improvement in the HbA1c level (r=−0.601, P=0.003) [7]. The authors speculated that as individuals with a higher renal threshold for glucose reabsorption have a greater capacity to reabsorb urinary glucose from the proximal tubule, these people may excrete a smaller amount of glucose into the urine [7].
In partial agreement with the aforementioned Japanese study [7], ipragliflozin showed a better glucose-lowering efficacy in our present study subjects with a lower baseline UGE. In addition, it is well recognized that people with diabetes have increased SGLT2 expression and activity [8] and hence that glycosuria does not arise in diabetics at the plasma glucose levels that would normally cause the excretion of glucose to urine in non-diabetic individuals [9]. Therefore, the lower baseline UGE in our better ipragliflozin response group might be due to increased SGLT2 expression and/or activity. Similarly, another independent predictor of a higher baseline HbA1c value could be associated with increased SGLT2 expression and/or activity. Collectively, increased SGLT2 expression and/or activity caused by hyperglycemia and the consequent decrease in the UGE level might be a marker for a better response to SGLT2 inhibitors in people with T2DM. Another explanation for a lower baseline UGE as a marker for better response to SGLT2 inhibitors is that confounding caused by baseline HbA1c. In this study, there was a positive correlation between baseline HbA1c and UGE (data not shown) and thus, the adjustment of baseline HbA1c might remove the confounding bias and resulted in unbiased estimate of the coefficient of baseline UGE for HbA1c reduction.
This study had several noteworthy limitations. First, this was a single arm study without a control group. Second, we only evaluated the association between UGE and HbA1c reduction after a 3-month ipragliflozin treatment and the association after longer-term treatments is therefore still uncertain. In addition, although ipragliflozin increased UGE at all time points during a 1-month treatment, the amount of UGE was greatest on the following day after the administration of ipragliflozin and then gradually decreased [10]. It may therefore be more appropriate to determine the association between changes in the UGE level and HbA1c reduction at an earlier time point after the initiation of SGLT2 inhibitor.
In conclusion, our current findings indicate that the baseline HbA1c and UGE are independent predictors of a higher glucose-lowering efficacy of SGLT2 inhibitors and that subjects with a lower baseline UGE and higher HbA1c may show the greatest benefit from these drugs.
 XML Download