Journal List > Diabetes Metab J > v.43(5) > 1142407

Kong, Koo, and Moon: Effects of Dapagliflozin on Endothelial Function, Renal Injury Markers, and Glycemic Control in Drug-Naïve Patients with Type 2 Diabetes Mellitus

Abstract

Background

The study aimed to evaluate the effects of dapagliflozin and metformin on vascular endothelial function and renal injury markers.

Methods

This prospective, randomized, open-label, crossover study included drug-naïve patients with type 2 diabetes mellitus, who were randomized to receive 8 weeks of initial treatment using metformin or dapagliflozin and crossed over for another 8 weeks of treatment after a 1-week washout period. Systemic endothelial function was evaluated via the reactive hyperemic index (RHI).

Results

The 22 participants included 10 males (45.5%) and had a median age of 58 years. The RHI values were not significantly changed during both 8-week treatment periods and there was no significant difference between the treatments. Relative to the metformin group, 8 weeks of dapagliflozin treatment produced significantly higher median N-acetyl-beta-D-glucosaminidase levels (10.0 ng/mL [interquartile range (IQR), 6.8 to 12.1 ng/mL] vs. 5.6 ng/mL [IQR, 3.8 to 8.0 ng/mL], P=0.013). Only the dapagliflozin group exhibited improved homeostatic model assessment of insulin resistance and body weight, while serum ketone and β-hydroxybutyrate levels increased.

Conclusion

Dapagliflozin treatment did not affect systemic endothelial function or renal injury markers except N-acetyl-beta-D-glucosaminidase.

INTRODUCTION

Endothelial dysfunction is considered as an early marker for atherosclerosis and an early step in atherosclerotic plaque formation, as the endothelium plays a major role in regulating vascular homeostasis via vasodilation, smooth muscle cell function, thrombogenesis, and fibrinolysis [123]. However, there is limited data regarding whether sodium-glucose cotransporter-2 (SGLT2) inhibitors improve endothelial function [456].
Several clinical trials have revealed that empagliflozin and canagliflozin were associated with slower progression of kidney disease and lower rates of clinically relevant renal events [7]. The suggested mechanisms involve reduced glomerular hyperfiltration by modifying tubuloglomerular feedback [8], which could theoretically activate the renin-angiotensin-aldosterone system (RAS) [9]. However, there remains controversy regarding the clinical implications of those findings.
The present study investigated the effects of dapagliflozin and metformin on endothelial function and renal injury markers among drug-naïve patients with type 2 diabetes mellitus (T2DM). The drugs' effects were also evaluated based on glycemic control, insulin resistance, ketogenesis, hemodynamic factors (including blood pressure), RAS, and renal injury markers (urine microalbumin, β2-microglobulin, and N-acetyl-beta-D-glucosaminidase [NAG]).

METHODS

Study design

This prospective, randomized, open-label, 8-week crossover study evaluated drug-naïve patients with T2DM. The study's protocol was approved by the Institutional Review Board of the Seoul National University Boramae Medical Center (26-2014-148), and informed consent was obtained from all participants and/or their legal guardians. The enrollment, randomization, data collection, and data management processes were implemented by third-party entities. The study was registered at ClinicalTrials.gov (NCT0250161).

Participants and treatments

The inclusion criteria were: (1) no treatment for T2DM during the 12 weeks before enrollment; (2) age of 20 to 80 years; and (3) glycosylated hemoglobin (HbA1c) levels of ≥7.0% to ≤9.0%. The exclusion criteria were: (1) type 1 diabetes mellitus or secondary diabetes; (2) a history of ischemic heart disease or stroke; (3) typical chest pain or atypical chest pain with dyspnea; (4) an estimated glomerular filtration rate (GFR) of <60 mL/min/1.73 m2 based on the Modification of Diet in Renal Disease method; (5) pregnancy, breastfeeding, or planning to become pregnant during the study period; and (6) exclusion at the discretion of the attending physician.
The participants were screened for eligibility and within 2 weeks were randomly assigned 1:1 to receive 8 weeks of treatment using either metformin followed by dapagliflozin or dapagliflozin followed by metformin. The starting dose for metformin was 1,000 mg/day and could be increased up to 2,000 mg/day by the attending physician. The starting dose for dapagliflozin was 10 mg/day. The dapagliflozin treatment represents the initial first 8-week treatment in dapagliflozin→metformin group, and later 8-week treatment in metformin→dapagliflozin group in total 22 patients (vice versa for metformin treatment).

Measurement of the reactive hyperemic index

The reactive hyperemic index (RHI) was measured using the Endo-PAT2000 system (Itamar Medical Ltd., Keisarya, Israel) by a technologist who was not otherwise involved in the study. All measurements were performed under fasting conditions during the morning in a temperature-controlled room (25℃). After resting for ≥15 minutes, a pressure cuff was placed on the patient's forearm and inflated to 50 mm Hg above the systolic blood pressure to occlude the brachial artery. The cuff was released 5 minutes later and the diameters of the peripheral artery on the pre- and post-hyperemia images were used to calculate the change in the RHI.

Measurements of laboratory parameters

Concentrations of HbA1c were evaluated using high-performance liquid chromatography with Bio-Rad Variant II HbA1c analyzer (Bio-Rad, Montreal, QC, Canada). Concentrations of total ketone bodies, acetoacetate, and β-hydroxybutyrate were measured using gas chromatography/mass spectrometry with a gas chromatography/mass selective detector (Hewlett Packard, Palo Alto, CA, USA). Concentrations of nitrotyrosine and endothelin were evaluated using the Nitrotyrosine ELISA kit (Cell Biolabs Inc., San Diego, CA, USA), and Quantikine ELISA kit (R&D Systems, Minneapolis, MN, USA). Concentrations of β2-microglobulin were measured enzymatically using a β2-microglobulin kit (Immunotech, Prague, Czech) and concentrations of NAG were measured using the CicaFit NAG (Kanto Chemical Co., Tokyo, Japan).

Statistical analysis

Outcomes were evaluated using the full analysis set, which included all participants who were enrolled and assigned a treatment. Normally distributed data were presented as mean±standard deviation, non-normally distributed data were reported as median (interquartile range [IQR]), and categorical data were reported as number (%). The Mann-Whitney U test and Wilcoxon signed-rank test were used to analyze continuous variables and Fisher's exact test was used to analyze categorical variables. Differences were considered statistically significant at P values of <0.05 and all analyses were performed using IBM SPSS software version 22.0 (IBM Corp., Armonk, NY, USA).

RESULTS

Baseline characteristics

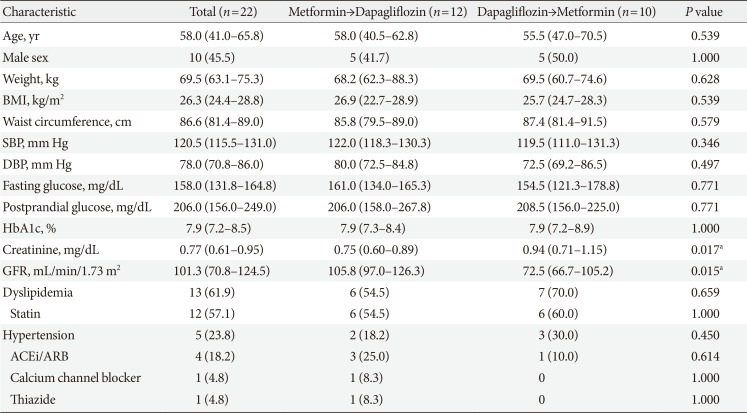
The participants' baseline characteristics are shown in Table 1. Twenty-three participants were originally enrolled, although one patient dropped out before the randomization and treatment. The groups had similar values for age, sex, body weight, body mass index, waist circumference, blood pressure, smoking status, medical history, fasting and postprandial glucose levels, and HbA1c levels. However, the group that received dapagliflozin first had significantly higher creatinine levels than the group that received metformin first (Table 1).

Changes in metabolic parameters

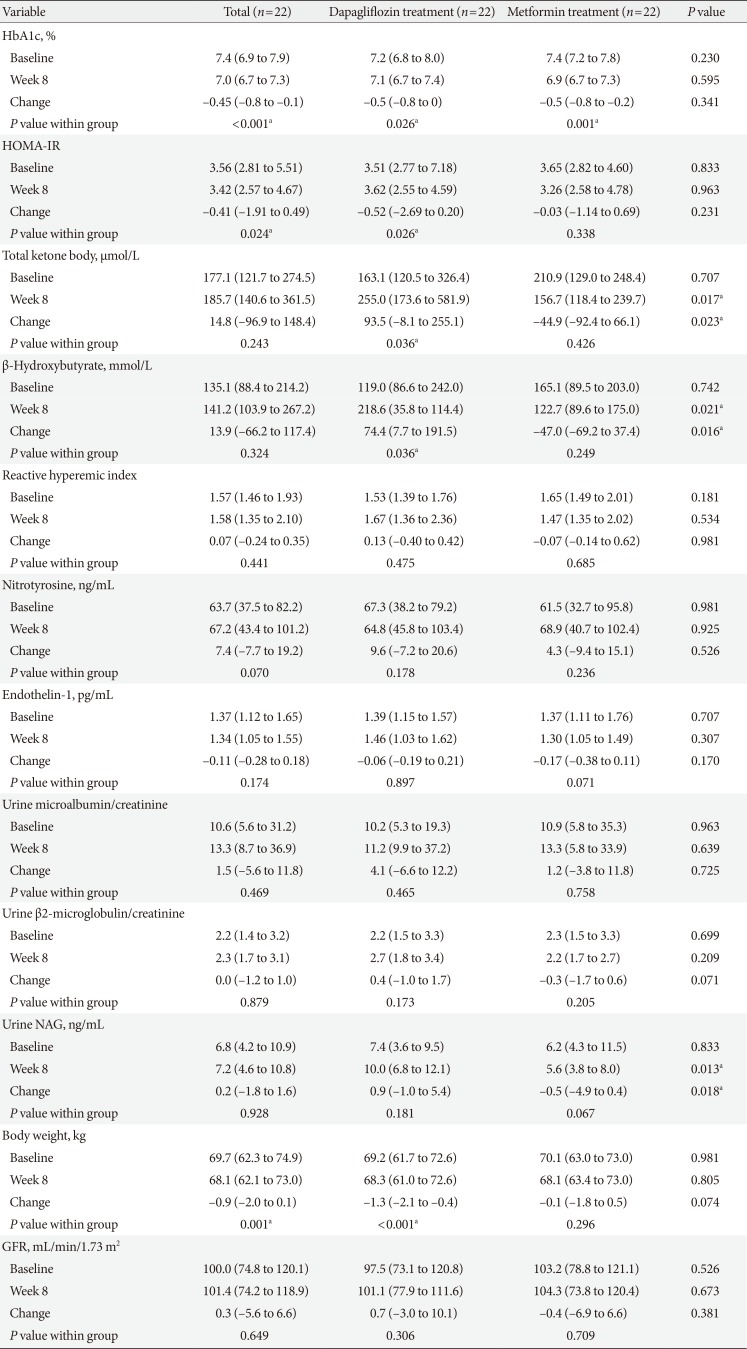
Both treatments significantly reduced the HbA1c levels. The changes in insulin levels, and lipid profiles were similar for the two treatments. After the dapagliflozin treatment, body weight and homeostatic model assessment of insulin resistance (HOMA-IR) were decreased, while plasma ketone and β-hydroxybutyrate levels were increased (Table 2).

Changes in systemic endothelial function and renal injury markers

The primary endpoint was the change in the RHI after 8 weeks, although no significant changes or inter-group differences were observed after 8 weeks of dapagliflozin treatment or after 8 weeks of metformin treatment. In addition, no significant changes or inter-group differences were observed for serum nitrotyrosine, and endothelin-1 levels. Furthermore, no significant changes or inter-group differences were observed for the urine microalbumin/creatinine ratio, the β2-microglobulin/creatinine ratio, and GFR. However, the NAG levels were significantly higher after 8 weeks of dapagliflozin treatment, and the change in the NAG level was greater for dapagliflozin treatment (Table 2).

DISCUSSION

This randomized, open-label, crossover study revealed no significant changes in the RHI, endothelin-1, and nitrotyrosine levels after dapagliflozin and metformin treatment. However, dapagliflozin induced greater increases than metformin in the values for NAG, serum ketones, and β-hydroxybutyrate. Furthermore, dapagliflozin treatment improved HOMA-IR and body weight, while glycemic control was similar for both treatments.
The present study failed to detect significant changes or inter-group differences in endothelial function. Although endothelial dysfunction is considered an early step in atherosclerotic plaque formation, cardiovascular mortality curves from the Empagliflozin Cardiovascular Outcome Event Trial in Type 2 Diabetes Mellitus Patients (EMPA-REG OUTCOME) study began diverging approximately 3 months after empagliflozin treatment, which is likely too early to be explained by an effect of de novo atherosclerosis on cardiovascular mortality [10]. It is also possible that our limited sample size and short treatment period hindered our ability to detect significant treatment-related changes in endothelial function. Nevertheless, the study period was not shorter than those of previous studies that have revealed changes in endothelial function within 8 weeks of treatment [111213].
Dapagliflozin induced a greater change in urine NAG than metformin in the present study. Urine NAG is an early marker for acute kidney injury originating from the proximal tubular cells [14] and has been suggested to predict diabetic nephropathy [15]. However, urine NAG has not been well-validated as a marker for drug-induced renal injury. One report indicated that urine NAG increased after sergliflozin treatment, which is an SGLT2 inhibitor with an O-glycan structure [16]. However, this effect was not reported for other SGLT2 inhibitors. Although urine NAG levels were increased after dapagliflozin treatment in the present study, the increase was not associated with concomitant changes in renal function such as serum creatinine and creatinine clearance, urine microalbumin, or β2-microglobumin. Therefore, the clinical relevance of changes in urine NAG levels requires further study to determine whether it is a temporary phenomenon that appears early during SGLT2 inhibitor treatment.
The RHI method in this study measures the digital pulse amplitude augmentation to quantify peripheral vasodilation potential via nitric oxide [1718] and is more reliable than the flow-mediated dilation method because it has less inter-personal variability and quantitatively evaluates the hyperemic response.
This is the first randomized clinical study to measure endothelial function during SGLT2 inhibitor treatment using the RHI method, which is a reliable method with low inter-personal variability. Cross-over study design could help minimize any effects of differences in the groups' baseline characteristics. Furthermore, the present study eliminated the effects of previous treatments by selecting drug-naïve patients. However, patients had relatively well controlled glucose levels and good endothelial function at baseline, which could minimize any treatment-related effects on endothelial function or renal injury markers. Also, the sample size and study duration might be insufficient to detect changes in endothelial function.
In conclusion, 8-week dapagliflozin treatment did not alter systemic endothelial function and renal injury markers, except urine NAG, and provided similar glycemic control to that of metformin.

ACKNOWLEDGMENTS

None

Notes

CONFLICTS OF INTEREST: This study was supported by an Investigator-Initiated Trial Grant from AstraZeneca and SNUH Research Fund from Seoul National University Hospital (No.0420140590). Funders played no role in the study design, conduct, analysis, preparation, or final approval of the manuscript.

AUTHOR CONTRIBUTIONS:

  • Conceived of the study: B.K.K., M.K.M.

  • Acquisition, analysis, or interpretation of data: S.H.K., B.K.K., M.K.M.

  • Drafting the work or revising: S.H.K., B.K.K., M.K.M.

  • Final approval of the manuscript: S.H.K., B.K.K., M.K.M.

References

1. Luscher TF, Barton M. Biology of the endothelium. Clin Cardiol. 1997; 20:II-3-10.
crossref
2. Kinlay S, Libby P, Ganz P. Endothelial function and coronary artery disease. Curr Opin Lipidol. 2001; 12:383–389. PMID: 11507322.
crossref
3. Davignon J, Ganz P. Role of endothelial dysfunction in atherosclerosis. Circulation. 2004; 109:III27–III32. PMID: 15198963.
crossref
4. Oelze M, Kroller-Schon S, Welschof P, Jansen T, Hausding M, Mikhed Y, Stamm P, Mader M, Zinbius E, Agdauletova S, Gottschlich A, Steven S, Schulz E, Bottari SP, Mayoux E, Munzel T, Daiber A. The sodium-glucose co-transporter 2 inhibitor empagliflozin improves diabetes-induced vascular dysfunction in the streptozotocin diabetes rat model by interfering with oxidative stress and glucotoxicity. PLoS One. 2014; 9:e112394. PMID: 25402275.
crossref
5. Salim HM, Fukuda D, Yagi S, Soeki T, Shimabukuro M, Sata M. Glycemic control with ipragliflozin, a novel selective SGLT2 inhibitor, ameliorated endothelial dysfunction in streptozotocin-induced diabetic mouse. Front Cardiovasc Med. 2016; 3:43. PMID: 27833913.
crossref
6. Steven S, Oelze M, Hanf A, Kroller-Schon S, Kashani F, Roohani S, Welschof P, Kopp M, Godtel-Armbrust U, Xia N, Li H, Schulz E, Lackner KJ, Wojnowski L, Bottari SP, Wenzel P, Mayoux E, Munzel T, Daiber A. The SGLT2 inhibitor empagliflozin improves the primary diabetic complications in ZDF rats. Redox Biol. 2017; 13:370–385. PMID: 28667906.
crossref
7. Barnett AH, Mithal A, Manassie J, Jones R, Rattunde H, Woerle HJ, Broedl UC. EMPA-REG RENAL trial investigators. Efficacy and safety of empagliflozin added to existing antidiabetes treatment in patients with type 2 diabetes and chronic kidney disease: a randomised, double-blind, placebo-controlled trial. Lancet Diabetes Endocrinol. 2014; 2:369–384. PMID: 24795251.
crossref
8. Fioretto P, Zambon A, Rossato M, Busetto L, Vettor R. SGLT2 inhibitors and the diabetic kidney. Diabetes Care. 2016; 39(Suppl 2):S165–S171. PMID: 27440829.
crossref
9. Cherney DZ, Perkins BA, Soleymanlou N, Xiao F, Zimpelmann J, Woerle HJ, Johansen OE, Broedl UC, von Eynatten M, Burns KD. Sodium glucose cotransport-2 inhibition and intrarenal RAS activity in people with type 1 diabetes. Kidney Int. 2014; 86:1057–1058. PMID: 25360497.
crossref
10. Zinman B, Wanner C, Lachin JM, Fitchett D, Bluhmki E, Hantel S, Mattheus M, Devins T, Johansen OE, Woerle HJ, Broedl UC, Inzucchi SE. EMPA-REG OUTCOME Investigators. Empagliflozin, cardiovascular outcomes, and mortality in type 2 diabetes. N Engl J Med. 2015; 373:2117–2128. PMID: 26378978.
crossref
11. Anderson TJ, Elstein E, Haber H, Charbonneau F. Comparative study of ACE-inhibition, angiotensin II antagonism, and calcium channel blockade on flow-mediated vasodilation in patients with coronary disease (BANFF study). J Am Coll Cardiol. 2000; 35:60–66. PMID: 10636260.
crossref
12. Cheetham C, Collis J, O'Driscoll G, Stanton K, Taylor R, Green D. Losartan, an angiotensin type 1 receptor antagonist, improves endothelial function in non-insulin-dependent diabetes. J Am Coll Cardiol. 2000; 36:1461–1466. PMID: 11079643.
crossref
13. Deshmukh SH, Patel SR, Pinassi E, Mindrescu C, Hermance EV, Infantino MN, Coppola JT, Staniloae CS. Ranolazine improves endothelial function in patients with stable coronary artery disease. Coron Artery Dis. 2009; 20:343–347. PMID: 19444092.
crossref
14. Liangos O, Perianayagam MC, Vaidya VS, Han WK, Wald R, Tighiouart H, MacKinnon RW, Li L, Balakrishnan VS, Pereira BJ, Bonventre JV, Jaber BL. Urinary N-acetyl-beta-(D)-glucosaminidase activity and kidney injury molecule-1 level are associated with adverse outcomes in acute renal failure. J Am Soc Nephrol. 2007; 18:904–912. PMID: 17267747.
15. Patel DN, Kalia K. Efficacy of urinary N-acetyl-β-D-glucosaminidase to evaluate early renal tubular damage as a consequence of type 2 diabetes mellitus: a cross-sectional study. Int J Diabetes Dev Ctries. 2015; 35(Suppl 3):449–457.
crossref
16. Hussey EK, Dobbins RL, Stoltz RR, Stockman NL, O'Connor-Semmes RL, Kapur A, Murray SC, Layko D, Nunez DJ. Multiple-dose pharmacokinetics and pharmacodynamics of sergliflozin etabonate, a novel inhibitor of glucose reabsorption, in healthy overweight and obese subjects: a randomized double-blind study. J Clin Pharmacol. 2010; 50:636–646. PMID: 20200268.
crossref
17. Bonetti PO, Pumper GM, Higano ST, Holmes DR Jr, Kuvin JT, Lerman A. Noninvasive identification of patients with early coronary atherosclerosis by assessment of digital reactive hyperemia. J Am Coll Cardiol. 2004; 44:2137–2141. PMID: 15582310.
crossref
18. Kuvin JT, Patel AR, Sliney KA, Pandian NG, Sheffy J, Schnall RP, Karas RH, Udelson JE. Assessment of peripheral vascular endothelial function with finger arterial pulse wave amplitude. Am Heart J. 2003; 146:168–174. PMID: 12851627.
crossref
Table 1

Baseline characteristics of study participants

dmj-43-711-i001
Characteristic Total (n=22) Metformin→Dapagliflozin (n=12) Dapagliflozin→Metformin (n=10) P value
Age, yr 58.0 (41.0–65.8) 58.0 (40.5–62.8) 55.5 (47.0–70.5) 0.539
Male sex 10 (45.5) 5 (41.7) 5 (50.0) 1.000
Weight, kg 69.5 (63.1–75.3) 68.2 (62.3–88.3) 69.5 (60.7–74.6) 0.628
BMI, kg/m2 26.3 (24.4–28.8) 26.9 (22.7–28.9) 25.7 (24.7–28.3) 0.539
Waist circumference, cm 86.6 (81.4–89.0) 85.8 (79.5–89.0) 87.4 (81.4–91.5) 0.579
SBP, mm Hg 120.5 (115.5–131.0) 122.0 (118.3–130.3) 119.5 (111.0–131.3) 0.346
DBP, mm Hg 78.0 (70.8–86.0) 80.0 (72.5–84.8) 72.5 (69.2–86.5) 0.497
Fasting glucose, mg/dL 158.0 (131.8–164.8) 161.0 (134.0–165.3) 154.5 (121.3–178.8) 0.771
Postprandial glucose, mg/dL 206.0 (156.0–249.0) 206.0 (158.0–267.8) 208.5 (156.0–225.0) 0.771
HbA1c, % 7.9 (7.2–8.5) 7.9 (7.3–8.4) 7.9 (7.2–8.9) 1.000
Creatinine, mg/dL 0.77 (0.61–0.95) 0.75 (0.60–0.89) 0.94 (0.71–1.15) 0.017a
GFR, mL/min/1.73 m2 101.3 (70.8–124.5) 105.8 (97.0–126.3) 72.5 (66.7–105.2) 0.015a
Dyslipidemia 13 (61.9) 6 (54.5) 7 (70.0) 0.659
 Statin 12 (57.1) 6 (54.5) 6 (60.0) 1.000
Hypertension 5 (23.8) 2 (18.2) 3 (30.0) 0.450
 ACEi/ARB 4 (18.2) 3 (25.0) 1 (10.0) 0.614
 Calcium channel blocker 1 (4.8) 1 (8.3) 0 1.000
 Thiazide 1 (4.8) 1 (8.3) 0 1.000

Values are presented as median (interquartile range) or number (%).

BMI, body mass index; SBP, systolic blood pressure; DBP, diastolic blood pressure; HbA1c, glycosylated hemoglobin; GFR, glomerular filtration rate; ACEi/ARB, angiotensin-converting enzyme inhibitor/angiotensin receptor blocker.

aFor P<0.05 between two groups using nonparametric test (Mann-Whitney).

Table 2

Changes in clinical parameters

dmj-43-711-i002
Variable Total (n=22) Dapagliflozin treatment (n=22) Metformin treatment (n=22) P value
HbA1c, %
 Baseline 7.4 (6.9 to 7.9) 7.2 (6.8 to 8.0) 7.4 (7.2 to 7.8) 0.230
 Week 8 7.0 (6.7 to 7.3) 7.1 (6.7 to 7.4) 6.9 (6.7 to 7.3) 0.595
 Change −0.45 (−0.8 to −0.1) −0.5 (−0.8 to 0) −0.5 (−0.8 to −0.2) 0.341
P value within group <0.001a 0.026a 0.001a
HOMA-IR
 Baseline 3.56 (2.81 to 5.51) 3.51 (2.77 to 7.18) 3.65 (2.82 to 4.60) 0.833
 Week 8 3.42 (2.57 to 4.67) 3.62 (2.55 to 4.59) 3.26 (2.58 to 4.78) 0.963
 Change −0.41 (−1.91 to 0.49) −0.52 (−2.69 to 0.20) −0.03 (−1.14 to 0.69) 0.231
P value within group 0.024a 0.026a 0.338
Total ketone body, µmol/L
 Baseline 177.1 (121.7 to 274.5) 163.1 (120.5 to 326.4) 210.9 (129.0 to 248.4) 0.707
 Week 8 185.7 (140.6 to 361.5) 255.0 (173.6 to 581.9) 156.7 (118.4 to 239.7) 0.017a
 Change 14.8 (−96.9 to 148.4) 93.5 (−8.1 to 255.1) −44.9 (−92.4 to 66.1) 0.023a
P value within group 0.243 0.036a 0.426
β-Hydroxybutyrate, mmol/L
 Baseline 135.1 (88.4 to 214.2) 119.0 (86.6 to 242.0) 165.1 (89.5 to 203.0) 0.742
 Week 8 141.2 (103.9 to 267.2) 218.6 (35.8 to 114.4) 122.7 (89.6 to 175.0) 0.021a
 Change 13.9 (−66.2 to 117.4) 74.4 (7.7 to 191.5) −47.0 (−69.2 to 37.4) 0.016a
P value within group 0.324 0.036a 0.249
Reactive hyperemic index
 Baseline 1.57 (1.46 to 1.93) 1.53 (1.39 to 1.76) 1.65 (1.49 to 2.01) 0.181
 Week 8 1.58 (1.35 to 2.10) 1.67 (1.36 to 2.36) 1.47 (1.35 to 2.02) 0.534
 Change 0.07 (−0.24 to 0.35) 0.13 (−0.40 to 0.42) −0.07 (−0.14 to 0.62) 0.981
P value within group 0.441 0.475 0.685
Nitrotyrosine, ng/mL
 Baseline 63.7 (37.5 to 82.2) 67.3 (38.2 to 79.2) 61.5 (32.7 to 95.8) 0.981
 Week 8 67.2 (43.4 to 101.2) 64.8 (45.8 to 103.4) 68.9 (40.7 to 102.4) 0.925
 Change 7.4 (−7.7 to 19.2) 9.6 (−7.2 to 20.6) 4.3 (−9.4 to 15.1) 0.526
P value within group 0.07 0.178 0.236
Endothelin-1, pg/mL
 Baseline 1.37 (1.12 to 1.65) 1.39 (1.15 to 1.57) 1.37 (1.11 to 1.76) 0.707
 Week 8 1.34 (1.05 to 1.55) 1.46 (1.03 to 1.62) 1.30 (1.05 to 1.49) 0.307
 Change −0.11 (−0.28 to 0.18) −0.06 (−0.19 to 0.21) −0.17 (−0.38 to 0.11) 0.170
P value within group 0.174 0.897 0.071
Urine microalbumin/creatinine
 Baseline 10.6 (5.6 to 31.2) 10.2 (5.3 to 19.3) 10.9 (5.8 to 35.3) 0.963
 Week 8 13.3 (8.7 to 36.9) 11.2 (9.9 to 37.2) 13.3 (5.8 to 33.9) 0.639
 Change 1.5 (−5.6 to 11.8) 4.1 (−6.6 to 12.2) 1.2 (−3.8 to 11.8) 0.725
P value within group 0.469 0.465 0.758
Urine β2-microglobulin/creatinine
 Baseline 2.2 (1.4 to 3.2) 2.2 (1.5 to 3.3) 2.3 (1.5 to 3.3) 0.699
 Week 8 2.3 (1.7 to 3.1) 2.7 (1.8 to 3.4) 2.2 (1.7 to 2.7) 0.209
 Change 0.0 (−1.2 to 1.0) 0.4 (−1.0 to 1.7) −0.3 (−1.7 to 0.6) 0.071
P value within group 0.879 0.173 0.205
Urine NAG, ng/mL
 Baseline 6.8 (4.2 to 10.9) 7.4 (3.6 to 9.5) 6.2 (4.3 to 11.5) 0.833
 Week 8 7.2 (4.6 to 10.8) 10.0 (6.8 to 12.1) 5.6 (3.8 to 8.0) 0.013a
 Change 0.2 (−1.8 to 1.6) 0.9 (−1.0 to 5.4) −0.5 (−4.9 to 0.4) 0.018a
P value within group 0.928 0.181 0.067
Body weight, kg
 Baseline 69.7 (62.3 to 74.9) 69.2 (61.7 to 72.6) 70.1 (63.0 to 73.0) 0.981
 Week 8 68.1 (62.1 to 73.0) 68.3 (61.0 to 72.6) 68.1 (63.4 to 73.0) 0.805
 Change −0.9 (−2.0 to 0.1) −1.3 (−2.1 to −0.4) −0.1 (−1.8 to 0.5) 0.074
P value within group 0.001a <0.001a 0.296
GFR, mL/min/1.73 m2
 Baseline 100.0 (74.8 to 120.1) 97.5 (73.1 to 120.8) 103.2 (78.8 to 121.1) 0.526
 Week 8 101.4 (74.2 to 118.9) 101.1 (77.9 to 111.6) 104.3 (73.8 to 120.4) 0.673
 Change 0.3 (−5.6 to 6.6) 0.7 (−3.0 to 10.1) −0.4 (−6.9 to 6.6) 0.381
P value within group 0.649 0.306 0.709

Values are presented as median (interquartile range). The dapagliflozin treatment represents the initial first 8-week treatment in dapagliflozin→metformin group, and later 8-week treatment in metformin→dapagliflozin group in total 22 patients (vice versa for metformin treatment). P values show results of comparisons between groups by nonparametric test (Mann-Whitney). P values within groups are results of Wilcoxon signed rank test.

HbA1c, glycosylated hemoglobin; HOMA-IR, homeostatic model assessment of insulin resistance; NAG, N-acetyl-beta-D-glucosaminidase; GFR, glomerular filtration rate.

aFor P<0.05.

TOOLS
Similar articles