

 PDF
PDF ePub
ePub Citation
 Print
Print


INTRODUCTION
The impairment of adipogenic capacity in pre-adipocytes may promote adipocyte hypertrophy and increase the risk of further metabolic dysfunction and disorders [1]. However, there are very few data on the impact of intermittent hypoxia (IH) on adipogenesis as a pathophysiologic feature in obstructive sleep apnoea (OSA), which is postulated to carry significant adverse metabolic and cardiovascular sequelae [23].
It is well known that the expansion of fat mass depends on the coordination of two processes: enlargement of existing adipocytes (hypertrophy) and formation of new adipocytes (hyperplasia) via the differentiation of stromal pre-adipocytes (adipogenesis) [1]. Adipocyte differentiation is divided into two sequential phases: determination (from pluripotent stem cells to pre-adipocytes) and terminal differentiation (conversion of pre-adipocytes to mature adipocytes) [4]. Given the well-established role of visceral adipose tissue (VAT) in the pathogenesis of metabolic disorders and atherosclerosis, previous IH studies have focused on VAT [5678]. However, the response of subcutaneous adipose tissue (SAT) to IH stimulus and the differences between SAT and VAT are unknown. Although visceral adipocyte hypertrophy is associated with metabolic syndrome, the inappropriate remodelling of subcutaneous adipocytes also contributes to adverse metabolic consequences. A recent review has provided mechanistic insight into how dysfunctional SAT remodelling leads to visceral and liver fat deposition (clinically as non-alcoholic fatty liver disease [NAFLD]) and, in doing so, may initiate metabolic dysfunction with development of components of metabolic syndrome (e.g., abdominal obesity/increased waist circumference, dyslipidaemia, hypertension, and insulin resistance) [9]. In addition, enlarged adipocytes of SAT are closely correlated with the risks and severities of insulin resistance and type 2 diabetes mellitus [9]. As adipose tissue (AT) displays depot-specific characteristics, it is important to investigate the behaviour of subcutaneous and VAT depots in response to IH exposure.
It has been reported that IH promoted M1/M2 macrophage polarization and a pro-inflammatory phenotype in VAT [5678] and AT surrounding tumours [10]. In the obese or hypoxic state, AT inflammation is accompanied by an imbalance in the ratio of M1/M2 macrophages, with the enhancement of M1 pro-inflammatory macrophages and the downregulation of M2 anti-inflammatory macrophages [11]. Macrophage polarization has been viewed as the initial regulator of AT dysfunction, including local inflammation, insulin resistance and oxidative stress [12]. Macrophage infiltration has also been demonstrated to exert an inhibitory role in subcutaneous adipogenesis in humans [13]. We hypothesize that macrophage polarization may be an intermediary mechanism in IH-induced AT dysfunction.
Most of the previous IH studies on AT metabolism focused on the effect of high frequency IH, taken to reflect more severe degrees of IH in the human scenario of severe sleep apnoea. However, many epidemiologic studies have suggested a dose-dependent effect of sleep apnoea (in terms of numbers of apnoea/hypopnoea and in terms of oxygen saturation dips) on various adverse cardiometabolic outcomes [23], and there are many people with milder degrees of sleep apnoea with uncertain health sequelae [14]. It is biologically plausible that low frequency IH would also give rise to dysregulation of AT function, but in a different pattern or degree compared with high frequency IH.
This study was designed to investigate the impact of low frequency IH on adipogenesis in the subcutaneous stromal-vascular fraction (SUB-SVF) and visceral SVF (VIS-SVF) from intermittent normoxia (IN)- and IH-exposed groups of lean mice and to further explore the role of macrophage polarization in IH-regulated adipogenic processes.
METHODS
In vivo IH-exposed mouse model
To investigate the role of IH in adipogenesis, 24 male C57BL/6N mice (approximately 25 g; 11 weeks old) were randomly divided into IN and IH groups. Treatments of IN and IH were simultaneously performed in two identical chambers (Oxycycler model A84; Biospherix, Oswego, NY, USA) for 6 hours daily, from 9:00 AM to 3:00 PM, for 6 weeks. The profile of IH was designed as approximately 4 minutes of 10% O2 followed by 2 minutes of 21% O2, while IN was designed with the same profile as IH but received 21% O2 (normal air) throughout the 360 seconds as the control. This hypoxic profile was associated with arterial oxyhaemoglobin saturation (SpO2), which fluctuated between a peak of 90% to 95%, gradually decreasing to a nadir of 60% to 70% 10 times per hour, as measured using a pulse oximeter (MouseVent G500; Kent Scientific, Torrington, CT, USA) (Supplementary Fig. 1). Total fat mass and total lean mass were measured by the Minispec LF90 Body Composition Analyzer (Bruker, Billerica, MA, USA) at baseline and before sacrifice. Mice were sacrificed with an overdose of sodium pentobarbital anaesthesia (100 mg/kg, intraperitoneal) after fasting overnight. Inguinal AT was isolated to represent SAT, and epididymal AT was isolated to represent VAT. All animal procedures conformed to the guidelines from Directive 2010/63/EU of the European Parliament. The experiment was approved by the Committee on the Use of Live Animals in Teaching and Research (CULATR, No. 2371-11) of the University of Hong Kong.
Stromal-vascular fraction isolation and differentiation
SAT and VAT were dissected and then digested in digestion medium (collagenase D 1.5 unit/mL and dispase II 2.4 unit/mL in sterilized phosphate-buffered saline [PBS]; Roche, Mannheim, Germany) at 37℃ for approximately 30 minutes, which was stopped by adding complete medium (Dulbecco's modified Eagle's medium [GIBCO, ThermoFisher Scientific, Waltham, MA USA]/F12 containing 10% foetal bovine serum [FBS] and 100 µg/mL penicillin and 0.1 mg/mL streptomycin). After centrifugation, the cell suspension was filtered through a cell strainer (50 to 70 µm diameter) and centrifuged at 700×g for 10 minutes. The SVF cells were re-suspended in complete medium and plated on collagen-coated six-well plates. After reaching 95% to 97% confluence, the cells were initiated to differentiate via addition of induction medium (complete medium with addition of insulin [GIBCO] 5 µg/mL, indomethacin 125 µM, dexamethasone 2 µg/mL, and 3-isobutyl-1-methylxanthine [IBMX; Sigma-Aldrich, St. Louis, MO, USA]). After 48 hours of differentiation, the medium was changed to maintenance medium (complete medium with addition of insulin 5 µg/mL, GIBCO) for 24 hours to complete one differentiation cycle. The SVF cells underwent two adipogenic differentiation cycles.
Cell culture of RAW 264.7 macrophage cell line
Murine RAW 264.7 cells (ATCC, Manassas, VA, USA) were cultured in growth medium (RPMI 1640 medium [GIBCO] supplemented with 10% FBS) to 90% confluence. After removing the medium, fresh medium was replenished for the collection of conditioned media. RAW 264.7 cells were exposed to either air (21% O2) or IH (1% O2 for 10 minutes followed by 21% O2 for 5 minutes, i.e., 4 cycles/hour) for 24 hours, and their conditioned media were collected simultaneously from different culture conditions, i.e., media from air (Raw) and from IH exposure (Raw-IH). The growth medium without exposure to macrophages was used as a control (Con). The collected conditioned media (Con, Raw, and Raw-IH) were centrifuged to remove cell debris and stored in aliquots at −20℃ until further use for studies with SVF cells.
Co-culture of SVF cells with conditioned media from macrophages (RAW 264.7)
SVF cells isolated from healthy mice aged 15 weeks were used throughout the study. The collected conditioned media (Con, Raw, and Raw-IH) were diluted with induction medium at a 1:1 ratio. The SVF cells were differentiated in the presence of diluted-induction media for 48 hours before changing to maintenance medium for another 24 hours. The differentiation from SVF cells to adipocytes was carried out for two cycles.
Determination of lipid accumulation with oil red O staining
After adipogenic induction, SVF cells were stained with oil red O dye to determine the lipid content of adipocytes. Cells were washed and then fixed with 10% formalin for 30 minutes at room temperature. After discarding the fixative, the cells were rinsed with 60% isopropanol two times and then stained with oil red O (Sigma-Aldrich; 5% in isopropanol, freshly diluted 2:3 with water) for 30 minutes. The stained cells were photographed under a light microscope (Nikon Eclipse; Nikon, Melville, NY, USA) using a SPOT RT3 colour camera (Diagnostic Instruments, Sterling Heights, MI, USA).
Haematoxylin and eosin staining for the measurement of adipocyte size
The paraffin-embedded sections of AT were cut at 10 µm for haematoxylin and eosin (H&E) staining. Images were visualized using a light microscope (Nikon Eclipse), and photomicrographs were taken of each slide using a SPOT RT3 colour camera (Diagnostic Instruments). ImageJ software (4.6) was applied to examine adipocyte size, representing the average adipocyte area in µm2. Adipocyte size was measured from four mice/group (>500 cells/section).
Immunofluorescence staining for M1 macrophages
Paraffin sections of AT (10 µm) were used to perform immunofluorescence staining. Primary antibodies anti-F4/80 antibody (Cat. # sc-377009; Santa Cruz Biotechnology, Dallas, TX, USA) and anti-inducible nitric oxide synthase (iNOS) antibody (BD Biosciences, San Jose, CA, USA) were diluted in PBS with bovine serum albumin before incubating with paraffin sections overnight. After washing in PBS, slides were incubated with biotinylated goat anti-rat immunoglobulin G at 5 µg/mL (Life Technologies, Carlsbad, CA, USA) for 1 hour at room temperature. Images were taken using a SPOT RT3 colour camera (Diagnostic Instruments) connected with a light microscope (Nikon Eclipse).
Real-time reverse transcription-polymerase chain reaction analysis
Total RNA extraction was performed with TRIzol (Invitrogen, Life Technologies) from SVF and differentiated SVF cells. Reverse transcription was performed using 1 µg of total RNA with a Qiagen RT kit (Qiagen, Hilden, Germany) according to the manufacturer's instructions. Real-time polymerase chain reaction analysis was performed using SYBR Green (Qiagen) normalized to glyceraldehyde 3-phosphate dehydrogenase (Gapdh). Primers were designed by Primer3 (Bio Tools, University of Massachusetts Medical School, Worcester, MA, USA) and synthesized by IDT (Integrated DNA Technologies, Singapore) (Supplementary Table 1). Relative expression was assessed by the comparative CT method, correcting for amplification efficiency of the primers, and performed in triplicate. Data represent the mean±standard error of the mean (SEM) of three independent experiments.
Detection of cytokines in conditioned media from SUB-SVF, VIS-SVF, and RAW 264.7 cells
Conditioned media were collected to detect the levels of secreted macrophage-related cytokines such as interleukin-6 (IL-6), tumor necrosis factor-α (TNF-α), and monocyte chemoattractant protein-1 (MCP-1) using commercially available enzyme-linked immunosorbent assay (ELISA) kits (eBioscience, San Diego, CA, USA).
Statistical analysis
Data are displayed as the mean±SEM from independent cell culture experiments or the number of animals (n≥4). Comparison between two different groups was performed using the Mann-Whitney test. Comparison among multiple groups was performed by one-way analysis of variance (ANOVA) followed by the post hoc Bonferroni's test. All statistical analyses were performed using GraphPad Prism version 7.0 (GraphPad Software Inc., San Diego, CA, USA). Statistical significance was defined by a P value (two-sided) <0.05.
RESULTS
Effect of IH on body composition
After 6 weeks of IH exposure, fat mass (% of body weight) was significantly increased (Supplementary Fig. 2A), while lean mass (% of body weight) was remarkably decreased (Supplementary Fig. 2B). However, there was no significant difference in body weight between the IN- and IH-exposed groups (Supplementary Fig. 2C).
Effect of IH on adipogenic differentiation from SUB-SVF and VIS-SVF
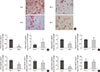
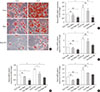
Oil red O staining was applied to assess the degree of differentiation from SVF cells from the IN- and IH-exposed groups. In comparison to SVF cells from the IN-exposed group, the IH-exposed group significantly suppressed oily droplets in SUB-SVF but not in VIS-SVF (Fig. 1A). In agreement with the oily droplets, differentiation-associated markers (fatty acid-binding proteins [Fabp4] and glucose transporter type 4 [Glut4]) and differentiation transcription factors (peroxisome proliferator-activator-γ [Pparg] and CCAAT/enhancer binding protein-α [Cebpa]) were also downregulated in SUB-SVF but not in VIS-SVF from the IH-exposed group (Fig. 1B–E).
Effect of IH on adipose tissue morphology
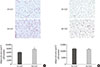
Histologic analysis of AT was carried out using H&E staining. In the IN-exposed group, the size of subcutaneous adipocytes was markedly smaller in comparison to visceral adipocytes. IH significantly enlarged the size of subcutaneous adipocytes (Fig. 2A). However, there was no difference in the size of visceral adipocytes between the IN- and IH-exposed groups (Fig. 2B).
Effect of IH on macrophage polarization in SAT and VAT
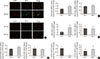
The paraffin sections of AT were double-stained for F4/80 and iNOS for the identification of total macrophages and M1 macrophages, respectively. In lean mice, the basal expression of F4/80 in SAT was comparably lower than that in VAT. IH dramatically enhanced both F4/80 and iNOS expression in SAT. The merged image indicated that activated M1 macrophages were significantly upregulated in the SAT of the IH-exposed group (Fig. 3A). Nevertheless, we did not observe any difference in F4/80 and iNOS staining in VAT after IH exposure (Fig. 3A), suggesting that the distribution of M1 macrophages in SAT was enhanced by IH. Induction of nitric oxide synthase 2 (Nos2)/F4/80 mRNA only occurred in SUB-SVF but not in VIS-SVF of the IH-exposed group (Fig. 3B). Moreover, the ratio of Nos2/arginase 1 (Arg1) was also upregulated in the SUB-SVF of the IH-exposed group (Fig. 3C), suggesting a switch from M2 macrophages to M1 macrophages. As M1 macrophages were closely associated with the pro-inflammatory state of AT, the mRNA expression of Tnfa was increased in SUB-SVF but not in VIS-SVF of the IH-exposed group (Fig. 3D). On the other hand, the M2 macrophage-related marker Chi313 (chitinase-like lectin) was suppressed in SUB-SVF but not in VIS-SVF of the IH-exposed group (Fig. 3E). In support of this finding, there were elevations of both MCP-1 and IL-6 concentrations in the conditioned media derived from SUB-SVF of the IH-exposed group in comparison to the IN-exposed group (Fig. 4A and C). A trend of increased MCP-1 levels was observed in the media derived from VIS-SVF of the IH-exposed group compared with the IN-exposed group but did not reach significance (Fig. 4B). In contrast, IL-6 release was significantly suppressed in the VIS-SVF of the IH-exposed group (Fig. 4D). TNF-α was below the detection limit of the commercially available ELISA kit (data not shown).
Effect of conditioned media derived from RAW 264.7 cells exposed to IH on adipogenic differentiation of SUB-SVF
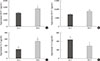
The adipogenic induction of SUB-SVF isolated from lean C57BL/6N mice was performed in the presence of control media (Con) and conditioned media collected from RAW 264.7 cells after air exposure (Raw) and after IH exposure (Raw-IH). The degree of differentiation was assessed by oil red O staining. The production of oily droplets in SUB-SVF was markedly suppressed in the presence of Raw media during adipogenic induction compared to in the presence of Con media in vitro. The inhibitory effect of Raw media on oily droplets was further enhanced in the presence of Raw-IH media (Fig. 5A). Consistent with the change in oily droplets, mRNA expression of differentiation-associated markers (Fabp4 and Glut4) (Fig. 5B and C) and adipogenic transcription factors (Pparg and Cebpa) (Fig. 5D and E) in the presence of Raw media showed a trend towards reduction during adipogenic induction. Compared to the presence of Con media, SUB-SVF in the presence of Raw-IH media showed significant downregulation of mRNA expression of Fabp4, Glut4, Pparg, and Cebpa during adipogenic induction after completing two cycles of differentiation (Fig. 5B–E).
To investigate the possible mediators from macrophages in the regulation of SUB-SVF adipogenesis, M1-associated cytokines were measured in Raw and Raw-IH media. Release of both TNF-α (Supplementary Fig. 3A) and MCP-1 (Supplementary Fig. 3B) but not IL-6 (data not shown) was found to be elevated in Raw-IH media compared to Raw media.
DISCUSSION
In this study using a lean mouse model, the group exposed to low frequency IH compared to the group exposed to normoxia showed hypertrophied adipocytes in subcutaneous fat and deceleration of adipogenesis of SUB-SVF ex vivo, while there was no effect on VIS-SVF. Furthermore, M1 macrophage polarization was also induced by IH exposure in SAT but not in VAT. To further explore the underlying relationship between inhibition of adipogenesis and macrophage polarization, SUB-SVF isolated from healthy lean mice was differentiated in the presence of conditioned media collected from different macrophage (RAW 264.7) cell culture conditions, i.e., IN (Raw) or IH exposure (Raw-IH). This complementary in vitro analysis demonstrated that IH-induced mediators released from macrophages (RAW 264.7) might play a role in the inhibition of SUB-SVF adipogenesis.
Although there was no obvious difference in body weight between the IN- and IH-exposed groups, a significant induction of fat mass and reduction of lean mass were found in IH-exposed lean mice. Expansion of fat mass requires either increased adipocyte size (hypertrophy) or increased adipocyte number (hyperplasia). Compared to hypertrophy, the hyperplasia of adipocytes might act as a healthy AT expansion, exerting a protective role against lipid and glucose/insulin abnormalities [15]. Upon adipogenic induction in vitro, oily droplets of SUB-SVF from the IH-exposed group were decreased together with downregulated mRNA expression of Fabp4, Glut4, Pparg, and Cebpa, suggesting that the adipogenic capacity of SUB-SVF was impaired. Hypertrophy of adipocytes is associated with insulin insensitivity and a pro-inflammatory state in AT [9], resulting in metabolic disorders of secondary organs. In this study, histological analysis showed hypertrophic adipocytes in SAT but not in VAT. In nutritional loading, large adipocytes become dysfunctional when they reach their expansion limit and are unable to respond to additional nutrition load. The enlarged size of the subcutaneous adipocytes might be a direct consequence of the impaired capacity to generate new adipocytes [16]. In humans, most studies have shown that the size of SAT adipocytes predicts the metabolic complications of obesity. Many reports, but not all, showed that enlarged SAT adipocytes were correlated with insulin resistance in both normal-weight and obese subjects [9].
In general, inflammation of AT is strongly related to macrophage infiltration [1718]. In obesity, AT macrophages play a key role in the regulation of AT function [19]. While macrophages in lean mice and humans make up approximately 5% of the cells in AT, they constitute up to 50% of all AT cells during obesity [20]. In addition to increased numbers of macrophages, low-grade inflammation of AT in obesity is also characterized by an increase in pro-inflammatory macrophages (M1) and a decrease in anti-inflammatory macrophages (M2) [21]. This switch of the macrophage phenotype is termed macrophage polarization. Apart from obesity, hypoxia has been found to be another potent stimulus of inflammatory M1 polarity [22]. Distinct anatomical structures and biological properties in depot-specific ATs might dramatically affect their macrophage phenotypes. Indeed, various studies reported higher expression of M1 macrophages in VAT than in SAT [2324]. The ratio of M1/M2 was upregulated after moderate-to-severe IH exposure in VAT [810]. In this study, the low frequency IH profile promoted M1 polarization in SAT but not in VAT, suggesting that the phenotype shifts of macrophages in different AT depots might also depend on the frequency, magnitude, and duration of IH exposure.
AT macrophages, especially M1 macrophages, are closely associated with the regulation of adipogenesis. Cellular experiments have shown that pro-inflammatory M1 macrophages inhibit proliferation and differentiation of adipocyte progenitors [25262728]. In obese AT, an inflammatory crown-like structure (CLS) consisting of macrophages was found surrounding dead adipocytes, while adipogenic clusters were only found at a distance away from CLS [29]. In fact, there is evidence to suggest that the pathological responses of AT to obesity and IH may be quite similar [30]. IH has been reported to be a pro-inflammatory stimulus resulting in M1 polarization [31]. On adipogenic induction with SVF from IN- and IH-exposed lean mice in vitro, an inhibitory effect on subcutaneous adipogenesis was observed in the IH-exposed group, which was in line with M1 macrophage polarization and hypertrophy of subcutaneous adipocytes in SAT but not in VAT. In further support of this model, inhibition of SUB-SVF adipogenic differentiation occurred in the presence of conditioned media collected from macrophage cell line cultures exposed to either air or IH. One can speculate that mediators released from macrophages may play a role in the regulation of adipogenesis during IH. In this study, cytokines such as MCP-1 and TNF-α were significantly upregulated in IH-exposed macrophages (RAW 264.7). Previous studies have reported that TNF-α suppressed adipogenic capacity via the β-catenin/TCF4 (TCF7L2)-dependent pathway [32], implying that TNF-α could be a candidate in this IH-induced inhibition of subcutaneous adipogenesis.
In contrast to our previous findings in an IH-exposed rat model, low frequency IH was found to promote subcutaneous adipogenic differentiation, suggesting that subcutaneous fat tissue might act as a metabolic buffer in early IH insults [33]. However, both studies using the same low frequency IH exposure found changes in the subcutaneous fat depot but not the visceral fat depot. The occurrence of opposite responses for subcutaneous adipogenesis in the Sprague-Dawley rat model and the C57BL/6N mouse model was unexpected. Other research groups have demonstrated different responses of pre-adipocytes to adipogenic modulators due to differences in species, sexual hormone status and age [343536]. In addition to differences in texture and vasculature in subcutaneous adiposity between rats and mice [37], the two rodent species have also been reported to show marked differences in metabolic rate when exposed to the same hypoxic condition [38]. However, the exact underlying mechanisms are currently unknown and beyond the scope of this study.
There are several limitations to this study. First, we have only investigated a relatively low frequency IH profile of 10 cycles/hour. In clinical or epidemiologic studies, the severity of metabolic aberrations usually correlated with the severity of sleep-disordered breathing [23]. Therefore, our data only illustrate macrophage polarization and adipogenic ability in low frequency IH profiles, and the findings are not generalizable to severe degrees of IH. Other researchers using a lean mouse model and IH of 60 cycles/hour have reported modification of white fat distribution, which was associated with insulin resistance [39]. Given the wide spectrum of OSA severity as defined by the apnoea-hypopnoea index, which is related though not identical to the severity of IH, and the very substantial proportion of people with mild degrees of sleep apnoea with uncertain health sequelae [14], it is important to study in depth the pathophysiologic cascades that occur in low frequency IH exposure; it is also important to expand research findings from low frequency IH to severe IH, taking into consideration various frequencies, magnitudes and durations of IH regimens. Second, these findings are derived from lean mice and not obese mice. As there may be marked differences in the behaviour of AT and macrophages between the lean and obese states [21], future in vivo studies using obese mouse models will be needed to further unravel the impact of IH on various AT depots and the role of AT macrophages in adipogenesis and adipocyte hypertrophy in IH-exposed obese AT. Lastly, although we established a causal relationship between IH-exposed macrophages (RAW 264.7) and subcutaneous adipogenesis through co-culture of SUB-SVF with Raw-IH media, further investigations are required to clearly identify which mediators from macrophages are responsible for exerting an inhibitory effect on adipogenesis.
In conclusion, our findings demonstrated that low frequency IH inhibited adipogenesis and caused production of hypertrophied adipocytes in SAT in a lean mouse model, and such AT dysfunction might be mediated by IH-induced M1 macrophage polarization (Fig. 6).
 XML Download