

 PDF
PDF ePub
ePub Citation
 Print
Print


INTRODUCTION
Previous studies have shown that aging is associated with substantial changes in body composition, characterized by increased fat mass combined with decreased lean body mass and muscle mass (MM) [123456]; however, most previous reports used a cross-sectional study design that revealed an association between decreased appendicular skeletal muscle mass (ASM) and increased age [1345], with few reported longitudinal studies [26]. Skeletal muscle is the largest insulin-sensitive tissue in the body, and skeletal muscle insulin resistance is a well-established key process in the development of type 2 diabetes mellitus (T2DM) [7]. Several previous cross-sectional studies have shown that low muscle mass or strength is associated with insulin resistance and T2DM [8910]; however, only a few longitudinal studies exist [11121314] that have investigated the association between MM and incident T2DM with inconsistent results. The discrepancies in results may be due to differences in age, sex, ethnicity, and degree of obesity of the participants, or methods of MM measurement. Moreover, several studies have investigated the role of MM in elderly people and have consistently demonstrated that sarcopenia is associated with several harmful outcomes including increased functional disability and mortality [1516171819]. Therefore, proper evaluation and early interventional management of body composition in younger and middle-aged individuals are required to prevent the development of sarcopenia or sarcopenic obesity in the elderly. However, the complex interplay between longitudinal changes in fat and MM and their clinical consequences in younger and middle-aged individuals remain poorly understood yet. Therefore, we sought to elucidate the changes in the prevalence of complex body composition phenotypes and their association with incident T2DM in a longitudinal follow-up of younger and middle-aged men and women.
METHODS
Participants
Initially, 20,639 individuals were recruited from those who visited the Health Screening and Promotion Center of the Asan Medical Center (Seoul, Korea) for routine medical check-ups from January 2007 to December 2008 and revisited for follow-up examinations from January 2012 to December 2014. Among them, 2,177 people who had a past medical history or were currently diagnosed with any cancer; overt renal, hepatic, thyroid dysfunction, or severe anemia at baseline or follow-up examinations; and age <20 or >69 years were excluded. Individuals with diabetes at baseline (fasting plasma glucose [FPG] ≥7.0 mmol/L or glycosylated hemoglobin [HbA1c] ≥6.5% [48 mmol/mol] or taking anti-diabetic medications) were also excluded (n=1,182). After the exclusion, 17,280 individuals (10,768 men and 6,512 women) with a mean age of 48.1 years (range, 20 to 69 years) were enrolled (Supplementary Fig. 1). This study was approved by the Institutional Review Board of the Asan Medical Center (Seoul, Korea) (2017-1065) and all participants gave informed consent. The work was done in accordance with the Ethical Principles for Medical Research Involving Human Subjects outlined in the Helsinki Declaration in 1975 (revised in 2000).
The participants completed a standard questionnaire regarding their previous medical or surgical diseases, medications, as well as exercise, drinking, and smoking habits. “Regular exercise” was defined as physical activity of moderate intensity that equals or more than brisk walking of at least 30 minutes per day, three times per week.
Body composition measurements
Body composition was measured via a bioelectrical impedance analysis (BIA) by InBody3.0 (baseline) or InBody720 (follow-up) (InBody Co. Ltd., Seoul, Korea). BIA devices measure the impedance of body tissues by sending detectable electrical signals through the body using an eight-point tactile electrode system to estimate segmental composition while a person standing on and gripping electrodes. The InBody3.0 device uses four frequencies (5, 50, 250, and 500 kHz) and produces a total of 20 impedance values for five body segments (trunk, right and left arms, and right and left legs) and the InBody720 device uses six frequencies (1, 5, 50, 250, 500, and 1,000 kHz) and produces 30 impedance values for five body segments.
The body composition variables included whole body lean body mass (LBM), MM (LBM minus bone mineral content), and fat mass. These measurements were also available for the five body segments. ASM included the MM from the arms and legs, which is primarily composed of skeletal muscles.
Calculation of various indices and defining body phenotypes
Body mass index (BMI), lean body mass index (LBMI), muscle mass index (MMI), appendicular skeletal muscle mass index (ASMI), and fat mass index (FMI) were calculated from each measurement (body weight, LBM, MM, ASM, and fat mass [kg], respectively) divided by the square of height (m2).
The four types of body composition according to the muscle to fat proportion were defined by median of ASMI (8.95 kg/m2 in men and 7.30 kg/m2 in women) or FMI (4.73 kg/m2 in men and 5.52 kg/m2 in women) as follows: (1) low muscle (LM)/low fat (LF), (2) high muscle (HM)/LF, (3) LM/high fat (HF), and (4) HM/HF groups.
Laboratory measurements
After overnight fasting, venous blood samples were drawn into vacuum-sealed tubes and were transferred to a central, certified laboratory. Glucose was measured using the hexokinase method with an autoanalyzer (Toshiba 200 FR Neo autoanalyzer; Toshiba Medical System Co., Tokyo, Japan). The HbA1c level was measured via ion-exchange high-performance liquid chromatography using an automated analyzer (Variant II; Bio-Rad Laboratories, Hercules, CA, USA). Total cholesterol, high density lipoprotein cholesterol (HDL-C), and triglycerides (TGs) levels were measured with an enzymatic colorimetric method using an autoanalyzer (Toshiba). Serum insulin concentrations were obtained via an immunoradiometric assay (TFB, Tokyo, Japan). The intra- and inter-assay coefficients of variations of these analyses were consistently <3.5%. The homeostasis model assessment of insulin resistance (HOMA-IR) and β-cell function (HOMA-β) index was calculated as follows: HOMA-IR=fasting serum insulin (µU/mL)×FPG (mmol/L)/22.5; HOMA-β=20×fasting serum insulin (µU/mL)/[FPG (mmol/L)−3.5].
Diagnosis of incident diabetes mellitus
Incident diabetes was diagnosed if FPG ≥7.0 mmol/L or HbA1c ≥6.5% (48 mmol/mol) or if anti-diabetic medications had commenced during the follow-up period in participants without diabetes at baseline.
Statistical analysis
Continuous variables with a normal distribution are expressed as the mean±standard deviation. Variables that are not distributed normally, including fat mass, TG, insulin, HOMA-IR, and HOMA-β are presented as the median (interquartile range). A Student's t-test or Mann-Whitney U test was used to compare the continuous variables between two groups. An analysis of variance (ANOVA) with a post hoc analysis by Tukey method or Kruskal-Wallis test was used for comparisons among three or more groups. Categorical variables were expressed as proportions (%) and chi-square tests were employed to compare proportions. Multivariate logistic regression analysis adjusting for confounding variables was used to calculate the odds ratios (ORs) of incident diabetes. All statistical analyses were performed using IBM SPSS Statistics version 20.0 (IBM Co., Armonk, NY, USA). A P<0.05 was considered statistically significant.
RESULTS
Baseline characteristics and mean changes in body weight, fat mass, and ASM of the study participants
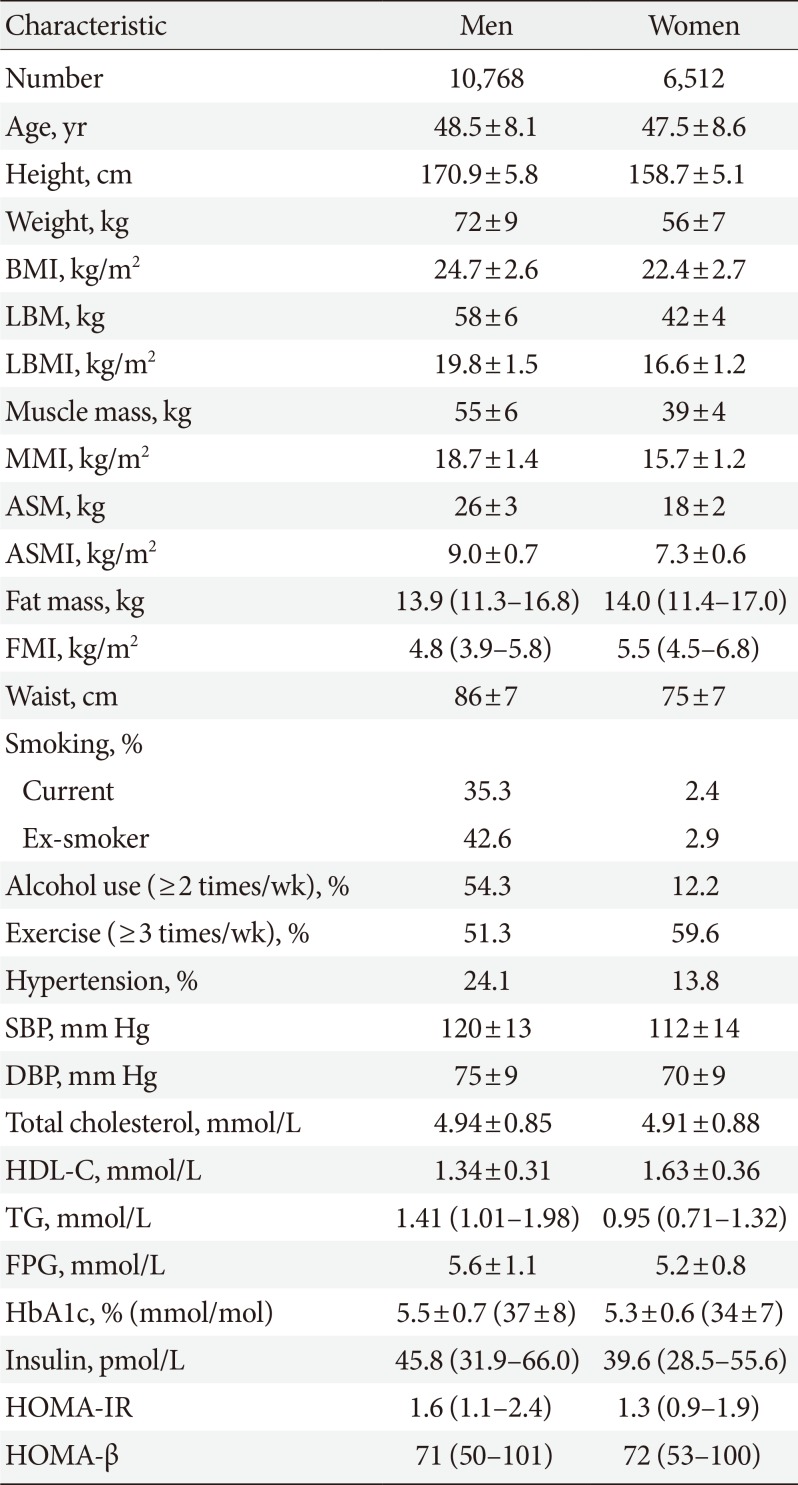
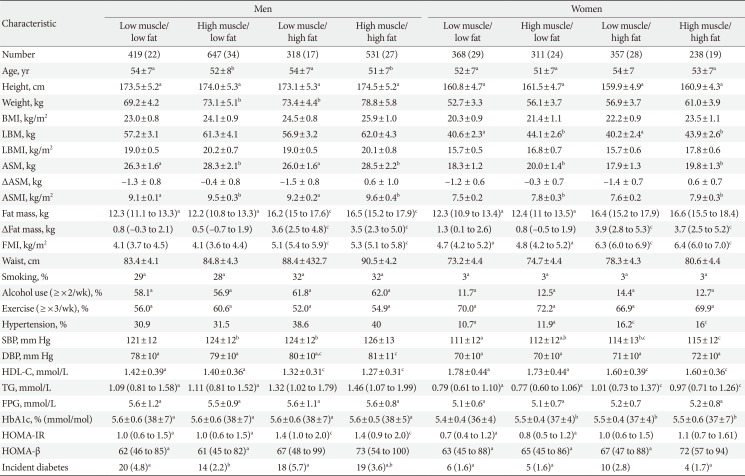
Table 1 shows the baseline characteristics of the participants in men and women. Most of the body composition variables were higher in men than in women; however, the FMI was higher in women than in men.
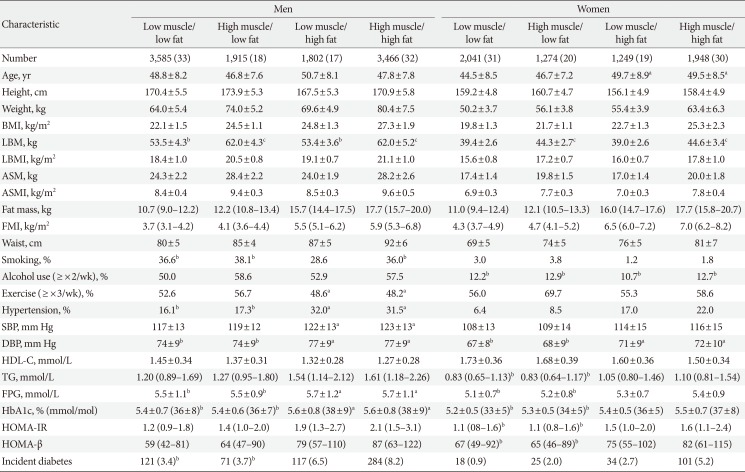
The mean follow-up duration was 5.5±0.5 years (range, 4.8 to 7.0 years). The mean changes in body weight, fat mass, and ASM were 0.4±3.2 kg (range, −19.1 to 26.7 kg), 1.7±2.8 kg (range, −14.6 to 22.0 kg; 2.5%/year), and −0.8±0.9 kg (range, −6.7 to 4.2 kg; −0.6%/year), respectively. Table 2 presents the baseline characteristics of the participants according to the four types of body composition. During the 5-year follow-up, the incidence of diabetes was similarly lower in the LM/LF and HM/LF groups (3.4% and 3.7%, respectively), whereas it was significantly higher in the LM/HF (6.5%) and HM/HF (8.2%) groups in men. For the women, the LM/LF group (0.9%) exhibited the lowest incidence of diabetes, followed by the HM/LF (2.0%), LM/HF (2.7%), and HM/HF (5.2%) groups.
Four types of body composition according to age at baseline and their changes after follow-up
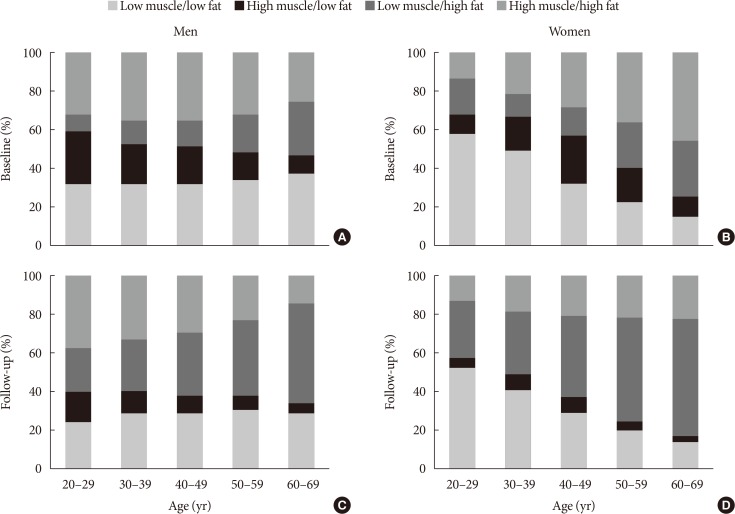
Fig. 1 shows the distribution of body composition phenotypes according to age group at baseline and follow-up. At baseline, proportion of HM/LF group was the highest in the youngest (age 20 to 29 years) men and middle-aged (40 to 49 years) women. The youngest women (age 20 to 39 years) consisted primarily of LM/LF group. After 5 years, the proportion of individuals in the LM/HF group had markedly increased for all age groups in both men and women (Fig. 1).
Transitions of each body composition phenotype from baseline to follow-up
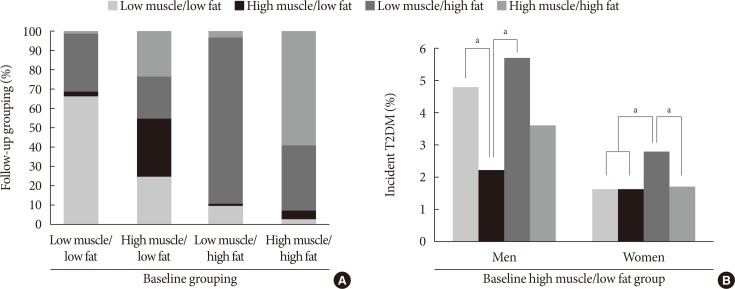
Fig. 2A presents the transitions of each body composition phenotype from baseline to follow-up. For the LM/LF group, over 60% of the original individuals maintained the same phenotype, while over 30% transitioned to the LM/HF group. Most of the individuals in the LM/HF group stayed in the same group. Approximately 60% of the HM/HF group stayed in the group, while over 30% transitioned to the LM/HF group. Of the participants in the baseline HM/LF group, approximately 30% stayed in the same group, while the remaining individuals transitioned to the three other groups with similar proportions. Therefore, we compared each of the four transited body composition phenotypes after 5 years follow-up among the individuals in the baseline HM/LF group.
Comparison of the four transited body composition phenotypes among the individuals in the baseline HM/LF group
Table 3 presents the follow-up characteristics of the baseline HM/LF group according to each transition group. Among men, incident diabetes was significantly lower in individuals who stayed in the HM/LF group (2.2%) than the LM/LF (4.4%) or LM/HF (5.7%) transition groups; however, only the LM/HF transition group (2.8%) was associated with a significantly higher incidence of diabetes compared to the other groups (1.6% to 1.7%) in women (Fig. 2B).
Regression analysis for incident diabetes
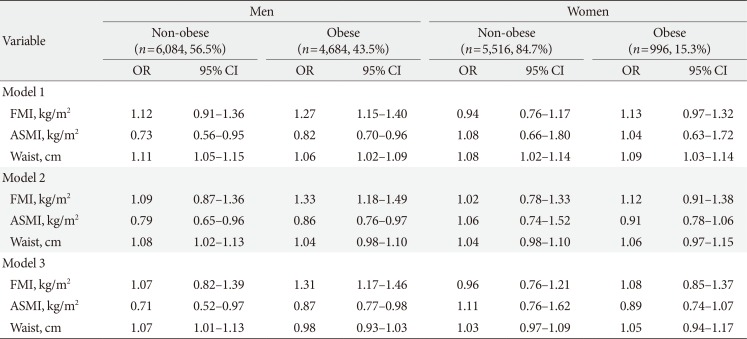
Table 4 lists the ORs for incident diabetes according to obesity status (BMI <25 or ≥25 kg/m2) because previous studies [1213] have shown that the association between MM/strength and diabetes risk are different according to obesity status and there was also significant interaction between obesity status and body composition in our analysis. In the first model, we adjusted for age because it is closely associated with both body composition and diabetes incidence. We subsequently adjusted for baseline HbA1c, HOMA-IR, and HOMA-β since they are well-known, most powerful predictors of T2DM. ASMI was found to be significantly associated with a decreased risk for incident diabetes in men, regardless of obesity status. Moreover, waist circumference in non-obese men and FMI in obese men were independently associated with an increased risk for diabetes. For women, only waist circumference was significantly associated with an increased risk for incident diabetes in the age-adjusted model; however, it was not significantly associated with an increased risk of diabetes after adjusting for baseline HbA1c, HOMA-IR, and HOMA-β. The results were not changed significantly after fully adjusting for all factors associated with incident diabetes in bivariate analysis (age, physical activity, smoking, alcohol drinking, family history of diabetes, systolic blood pressure, baseline HbA1c, HOMR-IR, HOMA-β, serum cholesterol, TGs, and HDL-C).
DISCUSSION
This study confirmed that a decrease in MM and an increase in fat mass were associated with an increased risk of developing T2DM. In addition, we observed that the complex interplay of changes in fat and MM could differently affect the risk. Moreover, fat mass tended to increase, whereas ASM decreased with aging in all age groups, consistent with the findings of previous studies [12345]. In an Italian study [2], men lost significantly more ASM than women (1.1%/year vs. 0.6%/year, respectively). In our study, while the mean reduction in ASM was similar between men and women (0.5%/year vs. 0.8%/year), the mean gain of fat mass tended to be greater in women compared to men (2.9%/year vs. 2.2%/year). This sex difference could arise from the influence of sex hormones and menopause in women, and could have resulted in different metabolic effects between men and women. Therefore, we analyzed all the data separately in men and women. After 5 years, the incidence of diabetes was lower in the baseline LM/LF and HM/LF groups compared with the LM/HF and HM/HF groups. This increased incidence of diabetes in the HF groups regardless of the baseline MM may be partly related to the fact that the mean gain of fat mass (1.7 kg; 2.5%/year) was much greater than the change of ASM (−0.8 kg; −0.6%/year) during the follow-up period.
Among the HM/LF group at baseline, individuals who maintained the HM/LF phenotype exhibited a significantly lower incidence of diabetes compared with those who transitioned to the LM/LF or LM/HF phenotypes. These results can be explained by the metabolically protective roles of skeletal muscle in the development of diabetes. Skeletal muscle is known as the largest insulin-sensitive tissue in the body and accounts for 80% of glucose uptake under euglycemic hyperinsulinemic conditions [7]. In addition, skeletal muscle insulin resistance is a key process in the development of T2DM, which may be observed decades before β-cell failure and hyperglycemia occur [7]. Several previous cross-sectional studies have shown that low muscle mass or muscle strength are associated with insulin resistance and T2DM [8910]. Furthermore, decreased muscle strength or physical fitness was associated with future incident T2DM [202122]; however, only a few longitudinal studies [11121314] have prospectively investigated the association between MM and incident T2DM yielding variable results. One Australian study [13] reported that reduced muscle strength, but not reduced MM, is a risk factor for incident T2DM in non-obese men; however, this was not the case in obese men. Larsen et al. [12] reported that while a greater muscle area measured by computed tomography scan was associated with a lower risk of incident diabetes in older normal-weight women, higher levels of muscle measures were associated with a greater risk of incident diabetes in overweight and obese women. Our data revealed that a high ASM significantly decreased the risk for incident diabetes regardless of obesity status in men; however, it was not protective in women. The effects of muscle on metabolic health may be visible only in the absence of excess adipose tissue; therefore, muscle may not be protective for overweight or obese women because the harmful effects of large amounts of excess fat are stronger than the protective effects of muscle [12]. The discrepancies in the results between ours and Larsen's could also be explained by different ethnicity (Asian vs. Caucasian), degree of obesity (BMI ≥25 kg/m2; 33% vs. 65%), age group (20 to 69 years vs. 70 to 79 years), the duration of follow-up (5 years vs. 11 years), and the timing of the skeletal muscle mass measurement (follow-up vs. baseline). In our study, the HM/HF group at baseline exhibited the highest incidence of diabetes in both men and women, but not in those that transitioned to the HM/HF from the HM/LF group. It is possible that a longer duration of fatness and aging could cause poor muscle quality, including the increased infiltration of skeletal muscle by ectopic fat [23] in the baseline HM/HF group.
Recently, one Korean population-based prospective study reported that low muscle mass defined by the MMI (total MM divided by weight) was associated with an increased risk of developing T2DM, independent of general obesity [14]. Our results are in general agreement with that study; however, our study included a much larger number of participants and analyzed ASM, which is a key component of assessing the health and functional status related to aging and a key diagnostic feature for sarcopenia. In addition, we also analyzed the influence of complex body composition phenotypes and their longitudinal changes. It should be noted that we examined the effect of ‘relative’ low muscle mass using the median value of the study population as cut-off points. In contrast, most of the previous studies used the definition of sarcopenia as MM below two standard deviations of the young adult means [81015]. In addition, the site and methods of MM measurement and calculation of MMI were different among the studies. Therefore, it was difficult to compare the cut-off values with other previous studies.
Sarcopenia is consistently associated with increased incidences of functional disability and mortality, independent of other comorbidities that present with old age [1516171819]; however, the loss of skeletal muscle mass can occur quite rapidly, even in middle-aged adults, as shown in this study. Continuous regular exercise over a long period of time is associated with higher ASM mass and grip strength in old age, but not with exercise in early adulthood or old age alone [24]. One study [25] compared the muscle function and structure in well-trained seniors who exercised regularly in their previous 30 years with age-matched healthy sedentary cohorts. Relative to their sedentary controls, muscles from the senior sportsmen had greater maximal isometric force, as well as better preserved fiber morphology and ultrastructure of intracellular organelles. Recently, a Swedish military conscripts study [21] demonstrated that low aerobic capacity and muscle strength during early adulthood were associated with an increased long-term risk of developing T2DM. Therefore, apparently healthy individuals should be regularly evaluated for exercise capacity and muscle strength, and followed from youth to old age to reduce the incidence of sarcopenia, which is associated with various morbidities and mortality, in the future as they grow old.
In our logistic regression analyses, ASMI and FMI exhibited significant impact on the risk of T2DM only in men, but not in women. There could be several possible explanations for these differences in results according to sex. It is well known that body composition is quite different between men and women because androgens and estrogens greatly affect muscle and fat formation and distribution as well as nutrient metabolism. Menopause in women also has large impact on body composition changes with aging. In addition, while the loss of skeletal muscle mass was similar between men and women, the gain of fat mass was greater in women compared to men during the follow-up. This could be one of the possible reasons why ASMI could not exhibit protective effect on the risk of T2DM in women. On top of that, the overall incidence of diabetes was much lower in women compared to men (2.7% vs. 5.5%), which could have led to insufficient number of incident cases to show statistically significant results in women.
It is important to note that this study has several limitations. (1) We could not ensure that the participants were representative of the general Korean population because the participants were voluntarily recruited during routine health examinations. However, when we reviewed the nationally representative data from the Fourth Korean National Health and Nutrition Examination Surveys [26], the patterns of body composition according to age and sex were very similar to our data. (2) Due to the unavailability of dual-energy X-ray absorptiometry (DEXA), we used a BIA to measure body composition. Therefore, we could not examine the different metabolic roles of adipose tissue depending on body fat distribution. Moreover, the absolute value of fat or MM estimated from BIA analysis can be varied among different devices, so it is difficult to draw a specific index or cut-off value that can be used generally. However, BIA is more suitable for a health screening program because it is simple, low cost, and involves no exposure to radiation. In addition, substantial validation data have been accumulated so far [272829]. Another drawback was that we used different versions of BIA machine between baseline (InBody 3.0) and follow-up (InBody 720) for analyzing body composition. However, both devices were validated using the same DEXA machine as a standard with high degree of agreement (according to the manufacturer's data). Although there could be small differences in the measured body composition values, it is less likely to affect the classification of the phenotype groups. (3) Since skeletal muscle strength was not measured, the relationship between metabolic disorders and muscle function could not be evaluated. (4) Since we could analyze only the data from two interval visits, the timing for the development of incident T2DM could not be identified; however, a considerably similar follow-up period for all participants could help minimize the effect of duration for developing diabetes. (5) Data for changes in physical activity and dietary factors during the follow-up were not available. Therefore, these factors might have affected the body composition change and incidence of T2DM. (6) The lack of an oral glucose tolerance test might have resulted in the inclusion of participants with undiagnosed T2DM at baseline and an under-diagnosis of incident diabetes at follow-up; however, the addition of HbA1c test to FPG may be helpful for reducing undetected T2DM that exhibits a predominantly postprandial hyperglycemic pattern.
Despite these limitations, our study has many strengths, including a large sample size, the inclusion of relatively young and middle-aged individuals that previously have not been sufficiently studied with regards to MM, the rigorous control of confounding factors, an adequate follow-up duration, and thorough measurements and analysis of both baseline and follow-up data.
In summary, with increasing age, fat mass tended to increase and the ASM to decrease, resulting in an increased proportion of individuals in the LM/HF group. The group maintaining an HM/LF phenotype exhibited a significantly lower incidence of T2DM compared with those who changed to an LM/LF or LM/HF phenotypes. ASM was independently associated with a decreased risk for incident diabetes among men, regardless of their obesity status. Therefore, both the prevention of obesity, as well as the maintenance of ASM appears to be important to prevent the development of T2DM. Further studies that provide more accurate measurements of ASM mass and strength in association with metabolic health and mortality should be followed.
 XML Download