

 PDF
PDF ePub
ePub Citation
 Print
Print


INTRODUCTION
Metabolic syndrome is a constellation of clinical features linked with metabolic abnormalities, which consist of abdominal obesity, impaired fasting glucose, hypertension, and dyslipidemia. Metabolic syndrome has become a major problem in public health, with a prevalence rate of 20% to 25% among adults worldwide [1]. As metabolic syndrome is associated with elevated risk of developing type 2 diabetes mellitus, cardiovascular disease, and all-cause mortality, modifiable risk factors for metabolic syndrome must be determined and managed [2]. Particularly, as lifestyle modification is the primary method of management for metabolic syndrome [3], identifying health behaviors that may influence the risk of metabolic syndrome is imperative.
Alcohol consumption, one of the most common health-related behaviors, has previously been shown to be associated with metabolic syndrome. While some studies have shown that alcohol consumption is associated with reduced risk of metabolic syndrome [45], a recent meta-analysis consisting of six prospective studies has shown that moderate to heavy levels of alcohol intake is associated with elevated risk of metabolic syndrome [6]. Previous studies, however, measured alcohol intake only once and assumed that alcohol consumption did not change over time. Therefore, it is yet unclear whether lowering alcohol intake leads to reduced risk of metabolic syndrome, or that increases in alcohol consumption is associated with elevated metabolic syndrome risk.
In this study, we investigated the association between change in alcohol consumption and metabolic syndrome among a large population using the Health Examinees-GEM (HEXA-G) study. Furthermore, the impact of change in alcohol intake on individual components of metabolic syndrome were determined.
METHODS
Participants
The study population is derived from the HEXA-G study conducted in Korea. The HEXA-G database is a community-based multicenter study consisting of males and females aged 40 to 69 years who underwent health examinations between 2004 and 2013. Multiple epidemiological studies have used HEXA-G previously [78910] and its validity has been demonstrated in detail elsewhere [1011]. Among 65,642 participants who underwent health examinations twice, 319, 14, 5, 99, and 1,680 participants without information on waist circumference, triglyceride, high density lipoprotein cholesterol (HDL-C), blood pressure, and fasting serum glucose (FSG) were excluded, respectively. An additional 1,274 participants who did not respond to questions on alcohol consumption were further excluded. Finally, 14,813 and 6,070 participants who were diagnosed with metabolic syndrome during the first health examination and with missing values on covariates were excluded, respectively. The final study population consisted of 41,368 participants. This study is not a clinical trial and does not need to be registered.
Ethics
This study was approved by the Institutional Review Board of Seoul National University Hospital (IRB number: 1503-103-657). During recruitment, all participants signed a voluntary consent form before study entry. The HEXA-G study complies with the principles of the Declaration of Helsinki.
Key variables
Alcohol consumption was determined based on a self-reported questionnaire the participants answered during each health examination. The participants responded to questions on the frequency (sittings per week) and amount (drinks per sitting) of alcohol consumed for soju (a popular Korean alcoholic beverage), beer, rice wine, wine, fruit wine, and hard liquor. The amount of alcohol consumed in grams per day for each alcoholic beverage type were calculated, after which the total amount of alcohol consumed was determined for each participant [12]. From this, the participants were divided into non-drinkers (0.0 g/day), light drinkers (0.1 to 19.9 g/day for males, 0.1 to 9.9 g/day for females), moderate drinkers (20.0 to 39.9 g/day for males, 10 to 19.9 g/day for females), and heavy drinkers (≥40.0 g/day for males, ≥20.0 g/day for females) for each of the initial and follow-up health examinations (Supplementary Fig. 1) [13].
The primary endpoint was metabolic syndrome, which did not change during the course of the research. Metabolic syndrome was determined based on the National Cholesterol Education Program Adult Treatment Panel III (NCEP-ATP III) criteria modified for Asian populations [14]. Participants were diagnosed with metabolic syndrome if they met three of the following five conditions: waist circumference of ≥90 cm for males and ≥80 cm for females, triglyceride levels of ≥150 mg/dL or taking lipid-lowering drugs, HDL-C levels of <40 mg/dL for males and <50 mg/dL for females, blood pressure of ≥130/85 mm Hg or taking anti-hypertensive drugs, and FSG levels of ≥100 mg/dL or taking anti-diabetic drugs. The presence of metabolic syndrome was determined for each participant during the initial and follow-up health examinations.
Statistical analysis
Chi-square test for categorical variables and analysis of variance for continuous variables were used to determine the difference in descriptive characteristics according to secondary alcohol consumption. We conducted logistic regression analysis to determine the adjusted odds ratios (aORs) and 95% confidence intervals (CIs) of developing metabolic syndrome during the follow-up examination according to the change in alcohol consumption between the initial and follow-up health examinations. Furthermore, we also determined adjusted mean values of the change in waist circumference, FSG, blood pressure, triglycerides, and HDL-C levels according to the change in alcohol consumption by linear regression analysis.
The differences in the descriptive characteristics according to initial alcohol consumption were determined by the chi-square test for categorical variables and analysis of variance for continuous variables. For all analyses, participants without changes in alcohol consumption (e.g., initial non-drinkers to follow-up non-drinkers) were the reference group. For both logistic and linear regression analyses, the aORs and adjusted mean values were determined after adjustments for covariates. The covariates considered were age (continuous, years), sex (categorical, male and female), household income (categorical, first, second, third, and fourth quartiles), education (categorical, elementary school or below, middle school, high school, and college or higher), physical activity (categorical, yes and no), smoking (categorical, never smoker, quitter, and continual smoker), total energy intake (continuous, kcal per day), body mass index (continuous, kg/m2), past history of cardiovascular disease (categorical, no and yes), family history of hypertension, diabetes, and dyslipidemia (categorical, no and yes), follow-up duration (continuous, years), and baseline metabolism risk score (categorical, 0, 1, and 2). Body mass index was calculated by dividing the weight in kilograms by the height in meters squared and was not adjusted for when determining the association of change in waist circumference according to alcohol consumption change.
Statistical significance was defined as a P<0.05 in a two-sided manner. All data collection and analysis were conducted using SAS version 9.4 (SAS Institute Inc., Cary, NC, USA) and STATA version 13.0 (StataCorp LP, College Station, TX, USA).
RESULTS
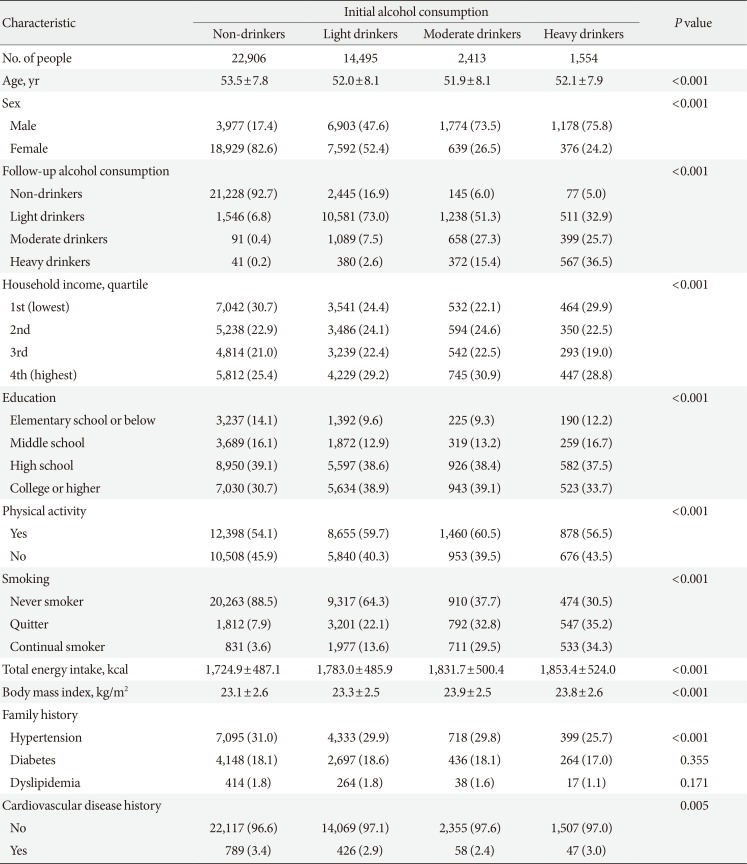
Table 1 depicts the descriptive characteristics of the study population during the initial health examination. The number of initial non-drinkers, light drinkers, moderate drinkers, and heavy drinkers are 22,906, 14,495, 2,413, and 1,554, respectively. The mean±standard deviation values of age for non-drinkers, light drinkers, moderate drinkers, and heavy drinkers are 53.5±7.8, 52.0±8.1, 51.9±8.1, and 52.1±7.9 years, respectively. Compared to initial non-drinkers, heavy drinkers tended to have a higher proportion of males, be heavy drinkers during the follow-up examination, have higher levels of education, be continual smokers, have higher total energy intake, have greater body mass index, and not have a past history of cardiovascular disease or a family history of hypertension (all P<0.001).
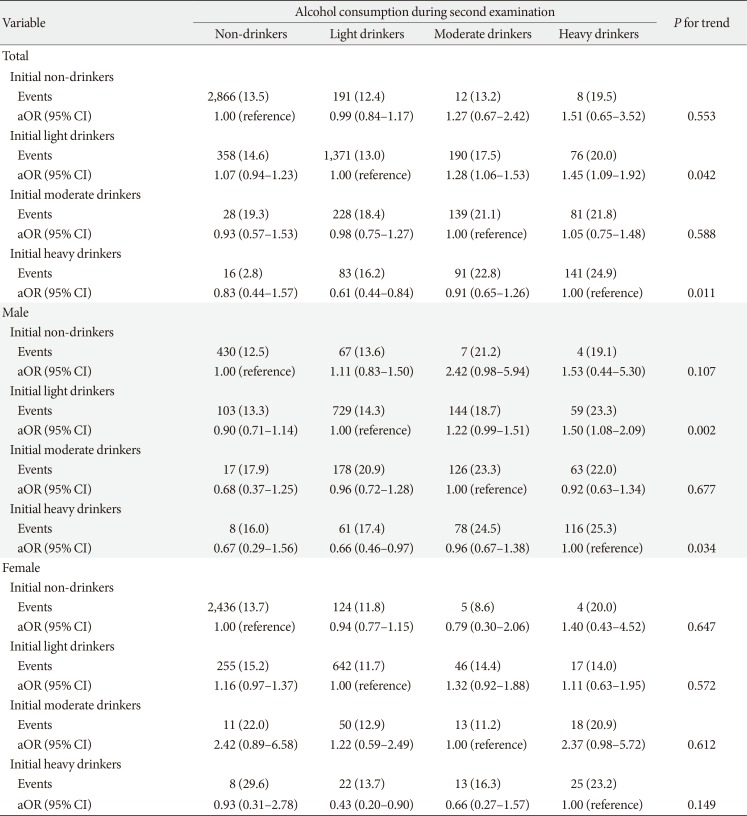
The association between change in alcohol consumption and metabolic syndrome according to baseline alcohol consumption is shown in Table 2. Light drinkers who increased alcohol consumption to moderate and heavy levels had elevated risk of metabolic syndrome ([aOR, 1.28; 95% CI, 1.06 to 1.53] and [aOR, 1.45; 95% CI, 1.09 to 1.92], respectively) compared to persistent light drinkers. Among initial light drinkers, increases in alcohol consumption were associated with elevated risk for metabolic syndrome (P for trend 0.042). Compared to persistent heavy drinkers, those who reduced the amount of alcohol to light levels had decreased risk of metabolic syndrome (aOR, 0.61; 95% CI, 0.44 to 0.84). Among initial heavy drinkers, alcohol intake reduction was associated with decreased risk for metabolic syndrome (P for trend 0.011).
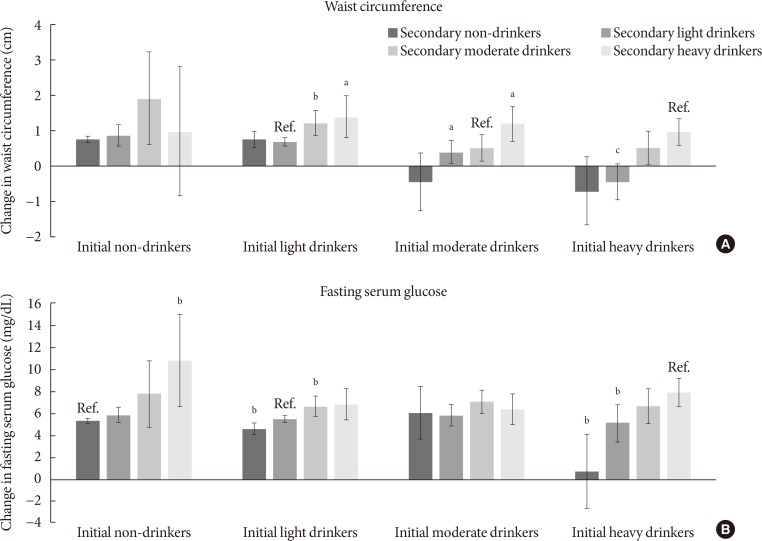
Fig. 1 shows the association between change in alcohol consumption and change in waist circumference or FSG. Compared to persistent light drinkers, those who increased alcohol consumption to moderate and heavy levels had elevated waist circumference (P=0.003 and P=0.017, respectively). Moderate drinkers who became non-drinkers had reduced waist circumference (P=0.032), while those who became heavy drinkers had elevated waist circumference (P=0.023). Compared to persistent heavy drinkers, those who reduced the amount of alcohol consumption to light levels had reduced waist circumference (P<0.001). Similarly, heavy drinkers who became non-drinkers had reduced waist circumference compared to persistent heavy drinkers (P=0.001). Non-drinkers who became heavy drinkers had elevated FSG levels (P=0.009) compared to persistent non-drinkers. Light drinkers who became non-drinkers had reduced FSG levels (P=0.003) while those who became moderate drinkers had elevated FSG levels (P=0.007). Finally, compared to persistent heavy drinkers, those who became light and non-drinkers had decreased FSG levels (P=0.009 and P<0.001, respectively).
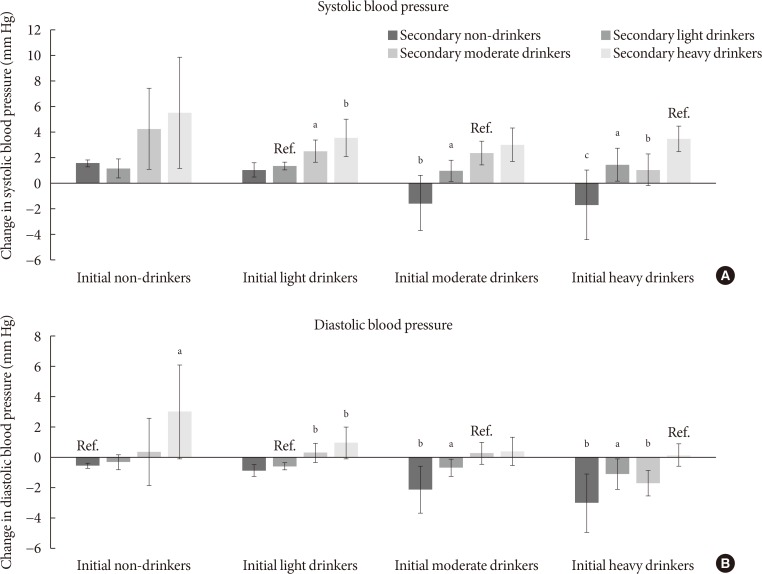
The associations between change in alcohol consumption and change in systolic or diastolic blood pressure are shown in Fig. 2. Light drinkers who increased alcohol consumption to moderate and heavy amounts had elevated systolic blood pressure (P=0.010 and P=0.003, respectively) compared to persistent light drinkers. Compared to persistent moderate drinkers, those who became light and non-drinkers had reduced systolic blood pressure (P=0.035 and P=0.001, respectively). Heavy drinkers who became moderate, light and non-drinkers had reduced systolic blood pressure (P=0.002, P=0.015, and P<0.001, respectively). Non-drinkers who elevated the amount of alcohol to heavy levels had increased diastolic blood pressure (P=0.023). Similarly, light drinkers who increased alcohol consumption to moderate and heavy amounts had elevated diastolic blood pressure (P=0.005 and P=0.003, respectively). Compared to persistent moderate drinkers, those who became light and non-drinkers had reduced diastolic blood pressure (P=0.045 and P=0.006, respectively). Finally, heavy drinkers who became moderate, light, and non-drinkers had decreased diastolic blood pressure (P=0.020, P=0.049, and P=0.003, respectively).
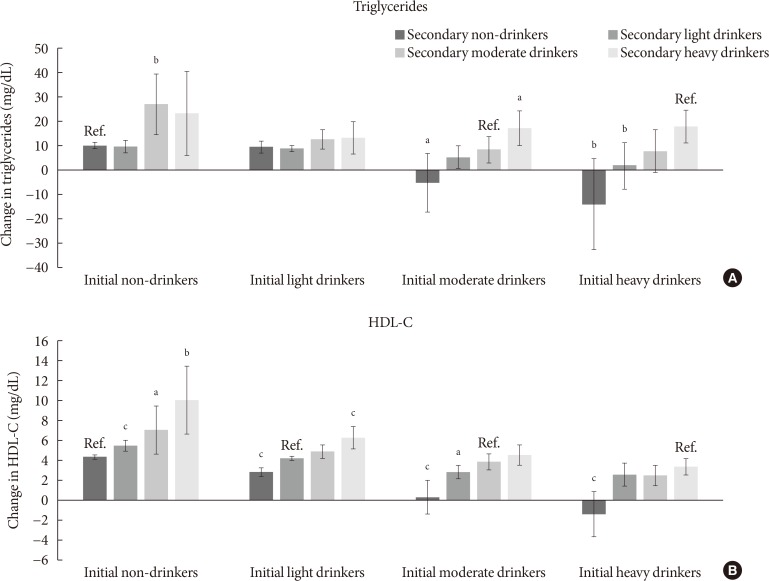
Fig. 3 shows the associations between change in alcohol consumption and change in triglyceride or HDL-C levels. Non-drinkers who increased alcohol consumption to moderate levels had elevated triglyceride levels (P=0.007). On the other hand, compared to persistent moderate drinkers, those who became non-drinkers had reduced triglyceride levels (P=0.041), while those who increased the amount of alcohol consumed to heavy levels had higher triglyceride levels (P=0.041). Non-drinkers who became light, moderate, and heavy drinkers had elevated HDL-C levels (P<0.001, P=0.033, and P=0.001, respectively) compared to persistent non-drinkers. Finally, compared to persistent heavy drinkers, heavy drinkers who became non-drinkers had reduced HDL-C levels (P<0.001).
DISCUSSION
In this large-scale longitudinal study, we have shown that increased alcohol consumption was associated with elevated risk of metabolic syndrome, while alcohol intake reduction was associated with decreased risk of metabolic syndrome. Furthermore, increased alcohol consumption was associated with elevated waist circumference, FSG, blood pressure, triglyceride, and HDL-C levels while reduced consumption of alcohol was associated with decreased levels of each component of metabolic syndrome. Past studies were limited to measuring alcohol consumption at one point in time, while our study extended from previous investigations by determining the risk of metabolic syndrome according to the changes in alcohol consumption.
Previous studies investigating the association between alcohol consumption at one point in time and metabolic syndrome or its individual components support the findings of this study. In a recent meta-analysis consisting six prospective studies with 28,862 participants, Sun and colleagues showed that heavy levels (>35 g/day) of alcohol consumption was associated with elevated risk of metabolic syndrome (relative risk, 1.84; 95% CI, 1.34 to 2.52) compared to non-drinkers [6]. In another cohort study, Kim and colleagues showed that increased alcohol consumption was associated with not only elevated risk of metabolic syndrome, but also abdominal obesity, impaired fasting glucose, and hypertriglyceridemia [15]. Similarly, another prospective study demonstrated that heavy levels of alcohol consumption is associated with elevated risk of metabolic syndrome, abdominal obesity, impaired FSG, hypertension, and hypertriglyceridemia [16].
Alcohol consumption may lead to elevated risk of metabolic syndrome by increasing waist circumference, FSG, blood pressure, and triglyceride levels. It has been suggested that alcohol may inhibit fat oxidation, which would lead to fat sparing upon heavy alcohol consumption, resulting in increased adiposity [17]. Furthermore, alcohol has been previously associated with β-cell dysfunction and alcoholic steatohepatitis, which could lead to deteriorating glycemic control and elevated FSG levels [18]. In terms of hypertension, alcohol has been shown to be associated with increased corticotropin-releasing hormone [19] and cortisol [20], elevated sympathetic nervous system activity [21], and vasoconstriction due to elevated intracellular calcium [2223], all precursors of elevated blood pressure. Finally, alcohol has been shown to stimulate hepatic secretion of very low density lipoproteins [24] and lipolysis by lipoprotein lipase [25], which could then lead to hypertriglyceridemia [26].
In contrast to other components of metabolic syndrome, the risk of low HDL-C decreased upon increased alcohol intake. Furthermore, heavy drinkers who reduced alcohol consumption had increased risk of low HDL-C. This finding is supported in multiple previous studies investigating the effect of alcohol intake on HDL-C levels, which reveal that greater alcohol intake was associated with higher HDL-C levels [2728293031]. One possible mechanism for the apparent benefit of alcohol on HDL-C is the increased transport rate of apolipoproteins A-I and A-II, major apolipoproteins of HDL, upon alcohol consumption [32]. This benefit of elevated HDL-C levels upon increasing alcohol consumption may have contributed to the lack of increased risk of metabolic syndrome upon elevating alcohol intake to light levels among non-drinkers, as well as the lack of benefit when light drinkers became non-drinkers.
Interestingly, two longitudinal studies have shown that moderate to heavy levels of alcohol intake is associated with reduced risk of metabolic syndrome [45]. However, both studies were conducted among Western populations. Therefore, the discrepancy in the relationship between alcohol consumption and metabolic syndrome compared to our results may be due to the ethnic differences in alcohol metabolism or drinking patterns [33]. Indeed, two previous studies investigating the association between alcohol consumption and metabolic syndrome among Korean populations have shown that greater alcohol intake is associated with increased risk of metabolic syndrome [1516]. Nonetheless, the exact reasons for the differences in the association between alcohol consumption and metabolic syndrome among Western and Asian populations are unclear and merit further investigation.
Previously, there have been limited studies that investigated the association between change in alcohol intake and metabolic syndrome. Furthermore, the relatively large study population and extensive adjustment of covariates enhance the reliability of our findings. We also attempted to take into account a potentially important confounder, sex. Although the significance was decreased likely due to the reduction in statistical power, our results suggest that the risk-elevating effect upon increased alcohol intake tended to be preserved among both males and females.
Nonetheless, several limitations must be considered upon interpreting the results from our study. First, as alcohol intake was determined using a self-reported questionnaire, the reported amount of alcohol intake may differ from the actual amount of alcohol consumption. However, previous studies have shown that alcohol consumption reported by a questionnaire correlates well with the actual amount of alcohol intake [3435]. Second, as the participants in HEXA-G underwent only two health examinations, we could not determine whether changes in alcohol intake occurred after the second period. Future studies with multiple repeated measurements of alcohol intake are needed to validate our findings. Third, although we were able to show that each of the five components of metabolic syndrome were affected by alcohol intake change, we could not demonstrate which of the five components was most influenced by alcohol consumption. Therefore, future studies investigating which of the five components of metabolic syndrome are most influenced by alcohol consumption change are needed. Fourth, as metabolic syndrome and secondary alcohol consumption were both determined during the follow-up health examination, the sequence of causality cannot be established with certainty. However, previous studies showing differing susceptibilities to elevated HDL-C [36] and increased risk of type 2 diabetes mellitus [37] according to the variation in the alcohol dehydrogenase genotype suggest that alcohol and its metabolites appear to alter the risk of developing metabolic syndrome. Fifth, the fact that the study population consisted of Korean participants who underwent health examinations, who may have certain sociodemographic tendencies, may limit the generalizability of our results. This may be particularly true in terms of alcohol consumption category, which was based on a similar previous study with an Asian population [13]. Since the alcohol consumption category may differ for Western populations, future studies conducted among study participants of other ethnicities are needed to validate our findings.
In conclusion, increases in alcohol consumption may lead to elevated risk of developing metabolic syndrome, while reducing alcohol consumption may lead to decreased risk of metabolic syndrome. Heavy drinkers who reduce alcohol intake may benefit from reduced risk of metabolic syndrome. Since metabolic syndrome is associated with higher risk of cardiovascular disease and all-cause mortality, the fact that increases in alcohol intake is associated with higher metabolic syndrome risk of both public health and clinical importance. However, as metabolic syndrome is a constellation of five features related to metabolic abnormalities, metabolic syndrome does not necessarily translate directly into a particular disease. Therefore, future studies that directly investigate the association of alcohol intake change with other health outcomes such as cardiovascular disease are needed.
 XML Download